The speculator’s chief enemies are always boring from within. It is inseparable from human nature to hope and to fear
William Delbert Gann – 1949
The Brutal Truth of the Trading Floor You think you are investing, but you are likely gambling. For 20 years, sitting at a bank’s trading desk, I watched retail investors make the same mistake over and over again: “Entering when the news is loudest, and exiting when the charts look ugliest.” The recent pullback in Solana (SOL) is panic for the masses, but for institutional operators, it is a carefully orchestrated “Liquidity Hunt.” While you look at the $137 price tag thinking it’s a “bargain,” Wall Street’s algorithmic machines are mocking your naivety. Today, I will tear off the market’s wrapping paper and use the rawest technical data to tell you: Why is entering now financial suicide? And where exactly is the “Smart Money” placing their limit orders?
【Analysis Benchmark Statement】
The following technical analysis is based on a price snapshot taken on December 12, 2025, at 14:05 (HKT): SOL = 136.99 USD. This snapshot provides a stable reference point. All support, resistance, and projected paths are relative to this benchmark. Market prices change instantly; please view this report as an ‘analytical map,’ not a real-time quote.
Catalyst & Fundamental View (Rearview Mirror): News is “Opium” for Retail
In the last 24 hours, news about Solana has been overwhelming. JPMorgan is pushing RWA (Real World Assets) projects on the Solana chain, and Sky’s Keel has launched a $500 million ecosystem fund. Sounds wonderful, right? That’s exactly why you will lose money. In the eyes of professional traders, news falls into two categories: “Catalysts” and “Exit Liquidity.” When bullish RWA news scrolls across headlines, but the price fails to make new highs and instead starts to bleed, this is known in technical analysis as a “Price-Sentiment Divergence.” Institutions use good news to generate buy orders so they can distribute their holdings at high prices to retail traders like you. While the long-term fundamentals are strong, short-term market sentiment is overextended. The current drop isn’t because the fundamentals are broken; it’s because chips need to change hands—from impatient retail to patient institutions.
Multi-Timeframe Technical Deep Dive (The Predictive Lens): Decoding the “Institutional Algorithm”
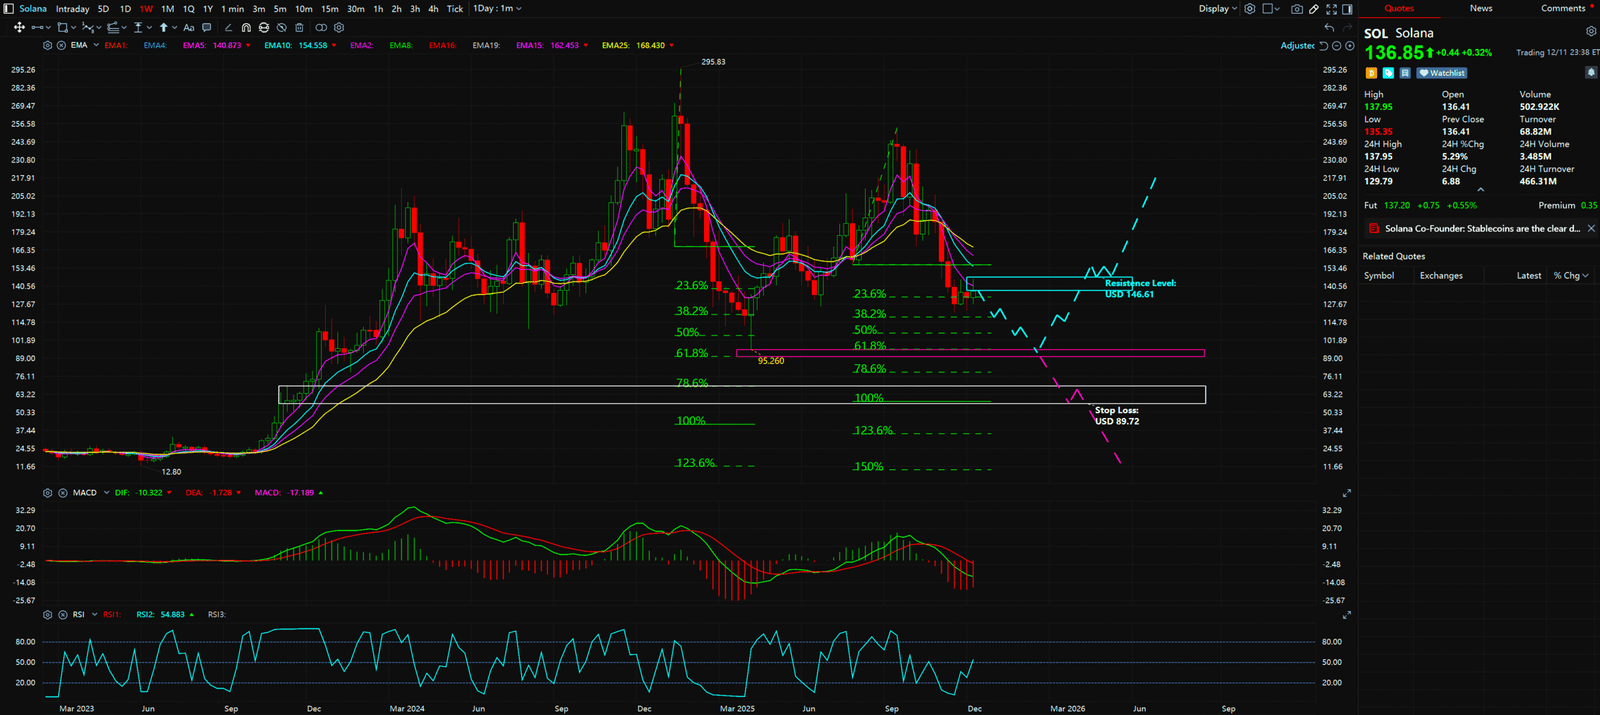
1. Weekly Chart (The Big Picture): Reading the “Whale’s Breath” Open the weekly chart I’ve prepared. Don’t just look at red and green candles; look at the structure. SOL’s current trend is what textbooks call a “Higher Highs, Lower Lows” consolidation. But in the trading room, we call this the “Washout Zone.” Why can’t you hold onto a trade? Because you don’t understand the macro cycle. We use an institutional-grade tool called the “Trend-based Fibonacci Extension” to retrace the previous rally from USD 168.88 to USD 295.83.
- History’s Lesson: Data shows the last correction stopped precisely at the 61.8% Golden Ratio (around USD 95) before exploding to USD 253. This isn’t a coincidence; it’s an algorithm.
- Current Script: SOL has entered a downtrend channel again. If sentiment continues to sour, based on the same algorithmic logic, the USD 95.3 area will once again serve as a historical “Iron Bottom.” This means from the current $137 to $95, there is still massive downside risk. Catching a falling knife here will only leave you bleeding.
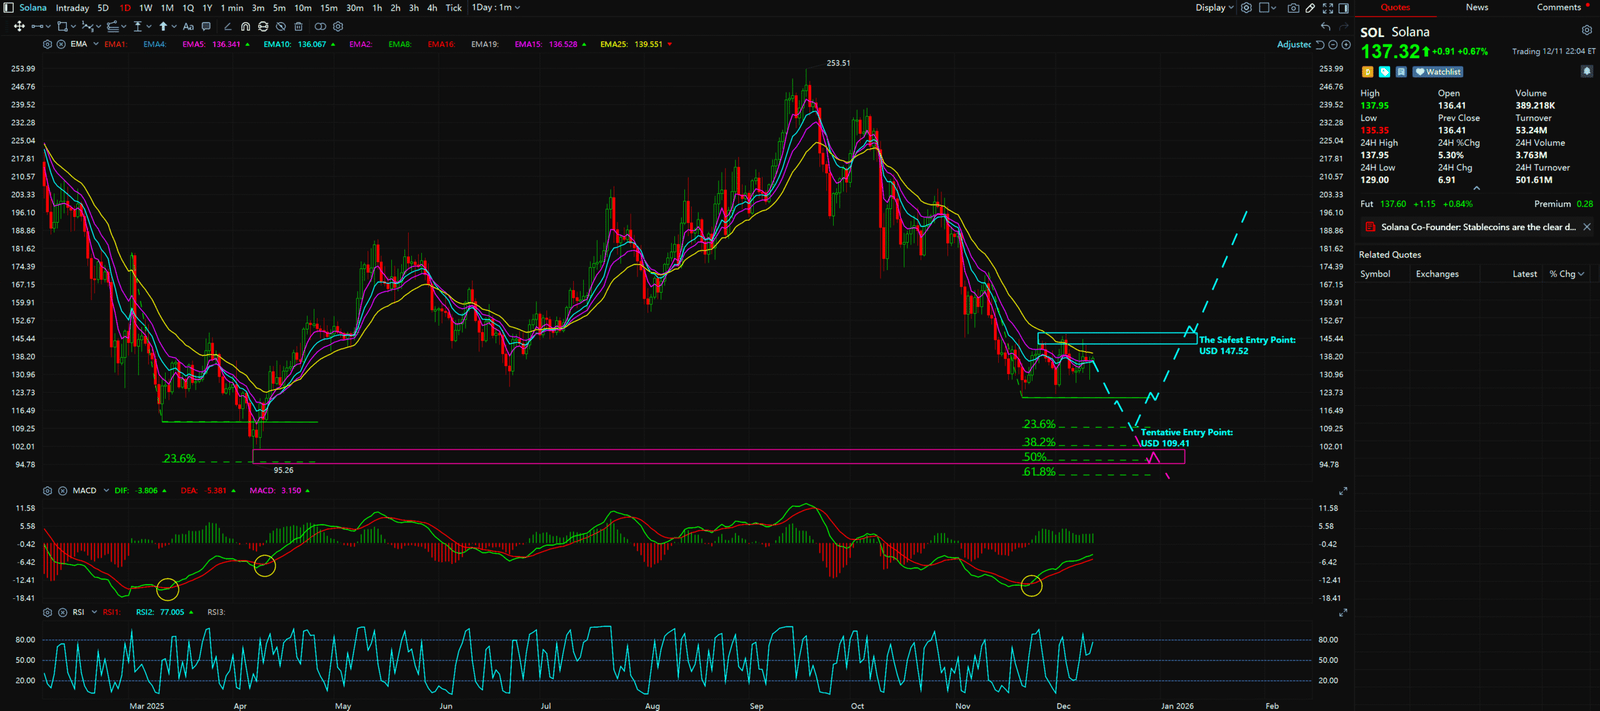
2. Daily Chart (The Sniper Entry): The Secret of $109.41 Switching to the daily chart, this is our battlefield for “sniping.” Many retail traders ask me: “Can I buy at $130? How about $125?” My answer is: “Don’t trade during garbage time.” Let me reveal a calculation logic known only to senior traders—“Fractal Geometry and Retracement Mapping.”
- The Precedent: Look at the bottom of April 2025 at USD 95.26. That level perfectly aligned with the 23.6% extension of the previous drop.
- History Rhymes: Applying this same “Banker’s Algorithm” to the current drop from USD 171.94 to USD 121.66, the computer gives a cold, precise answer: USD 109.41
Synthesis & Unique Insight: Why is $109.41 Worth Gold?
This isn’t just a number; it is the “Extreme of Panic.” When the price hits $109.41, most retail traders who bought the dip at $130-$140 will be forced to sell due to fear or liquidation. And that is exactly the moment institutional whales love to enter.
- Trend Alignment: The weekly chart shows downside room, and the daily chart locks in a specific target. Both resonate to confirm that $137 is currently “No Man’s Land.”
- Trading Strategy: True hunters spend most of their time waiting. Entering now gives you a terrible Risk-Reward Ratio. You are risking $10 to make $1 of profit.


Key Takeaways
Summary / Key Levels Tactical Manual
- ⛔ Stop Loss: USD 89.72
- This is the last line of defense. If it breaks, the trend has completely reversed, and you must exit unconditionally to survive.
- 🎯 Tentative Entry Point: USD 109.41
- Action Guide: This is the “Golden Point” for counter-trend trading. When price touches here, AND the MACD indicator shows “Bullish Divergence” (price makes a new low but momentum bars shorten), aggressive traders can deploy 30%-50% of capital. This is called “Dancing with the Whales.”
- 🛡️ Safest Entry Point: USD 147.52
- Action Guide: This is for conservative traders. Only when the price reclaims $147.52 does it mean bulls have regained control. You miss the bottom profit, but your win rate increases drastically.
Our goal is not to provide a crystal ball, but to offer a clear, logical, and actionable framework by simplifying professional analysis.
Unlocking Technical Analysis: Power Moves with Diagrams !
Weekly Timeframe for TRON (TRX)
Daily Timeframe for TRON (TRX)
For continuous, real-time analysis of these developing market structures, visit www.chart-blitz.com.
Fundamental news tells you what happened. Technical analysis predicts what will happen. To master the professional framework that separates market signal from noise, explore our exclusive models at www.chart-blitz.com.
Sources:
- https://www.coingecko.com/en/coins/tron
- https://coinmarketcap.com/currencies/tron/
- https://www.tradingview.com/symbols/TRXUSD/
【Disclaimer】 The content herein is for educational purposes and reflects the author’s personal opinion only; it is not investment advice. All financial investments, including cryptocurrencies, carry significant risk, and you could lose your entire capital. To support this site, this article may contain affiliate links. While we strive for accuracy, we cannot guarantee all information is complete or error-free. Please conduct your own research and be fully responsible for your own investment decisions.