When you make a trade, you should have a clear target of where you expect to get out
William Delbert Gann – 1949
You Think It’s a “Dip,” The Whales Thank You for Being “Exit Liquidity”.
Open Crypto Twitter or any news app today, and the discourse around DOGE (Dogecoin) revolves around one word: “Faith.” “DOGE is culture! Buy the dip!” “Elon will save us!”
Hearing this, as an ex-bank trader who spent 20 years in the dealing room watching sharks eat minnows, I can only smirk. For the average retail investor, trading is faith; it’s gambling. But for those of us trained professionally, trading is a cold-blooded Game of Probabilities.
Today, I won’t sell you dreams. I will use the most brutal data and charts to dismantle why the $0.16 level is likely to be a “graveyard” for retail capital in the coming months. If you don’t want to be the main course for the market makers, spend 10 minutes reading this “Survival Manual.” This isn’t just an analysis; it’s a masterclass on “Support/Resistance (S/R) Flip” and the “Andrews Pitchfork.”.
If you don’t want your capital to become the profit margin for an institutional quarterly report, take 10 minutes to read this deep dive. Using Andrews Pitchfork structural analysis and Volume Profile (VPFR), I will explain why $88k is a “No-Go Zone” for professionals.
【Analysis Baseline Statement】
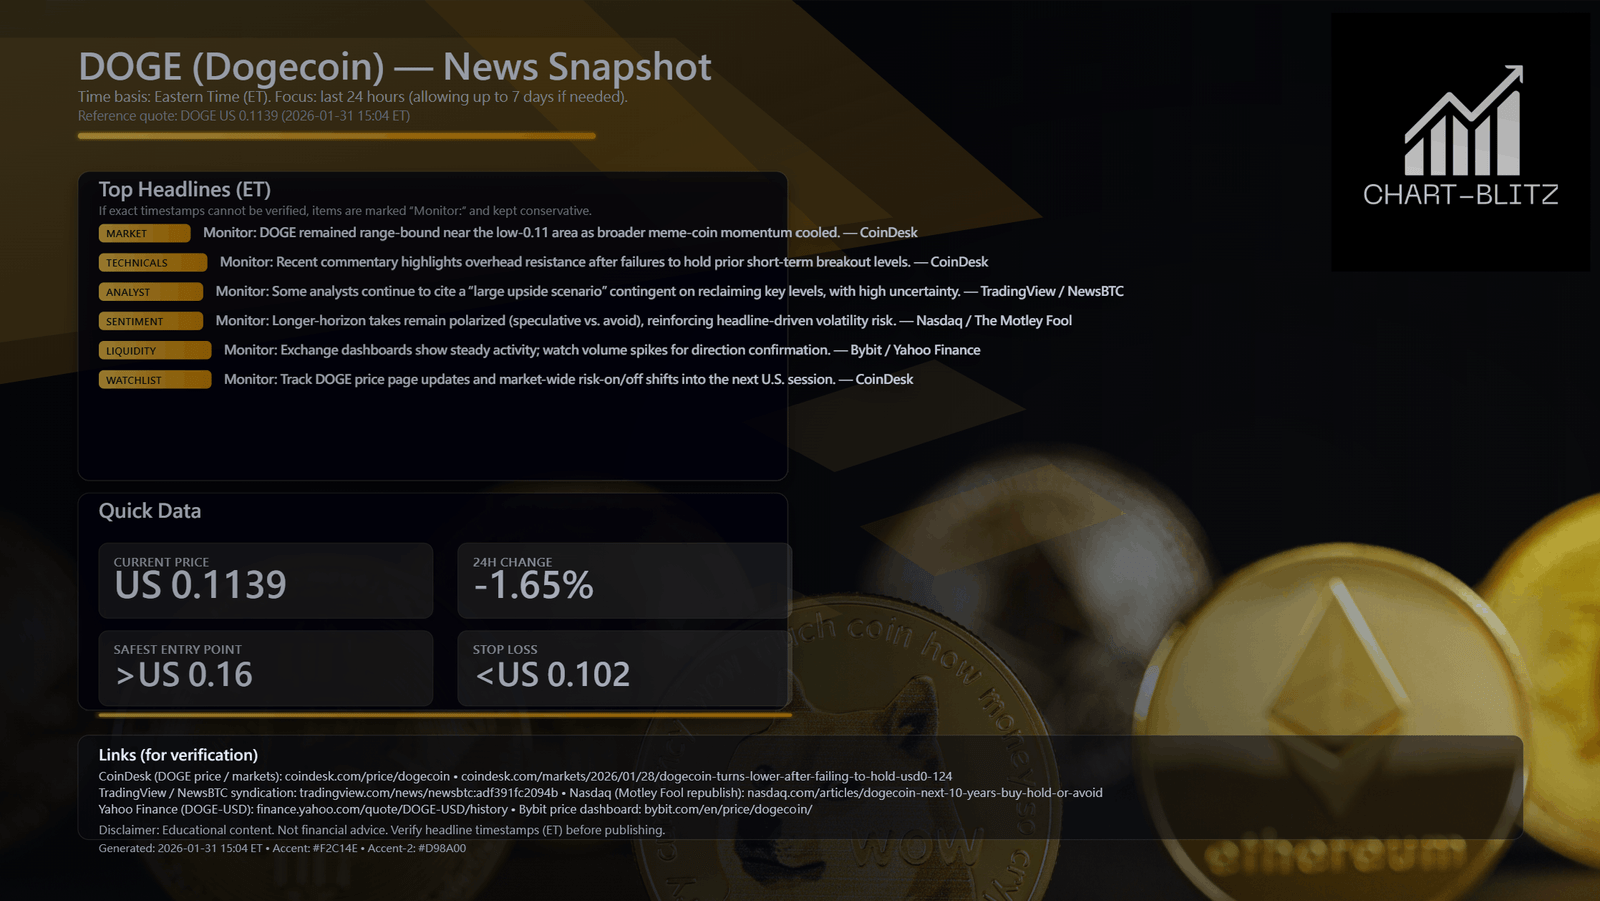
All technical analysis below is based on the price snapshot locked at 2026-01-31, 15:21 (GMT+8): DOGE = 0.11450 USD. This snapshot provides a stable reference point. All support, resistance, and projected paths are relative to this benchmark. Market prices change instantly; please view this report as an “analytical map,” not a real-time quote.
Chapter 1: Ripping Off the Mask of News: Why Fundamentals are a “Rearview Mirror”
In the last 24 hours, the market has been filled with noise. According to reports from CoinDesk and major financial sites, DOGE’s fundamentals seem mixed. Rumors of payment integration, celebrity tweets—these are the “catalysts” retail traders love.
But have you ever wondered why price sometimes drops after good news? In the bank, we lived by the adage: “Buy the Rumor, Sell the News.” News is lagging. It explains “what happened in the past.” By the time you read “Why DOGE Crashed” in the headlines, Smart Money has already sold their bags and is sipping vintage wine.
The real battlefield is solely on the charts: Price Action. Price encompasses everything. Charts don’t lie; only you lie to yourself.
Chapter 2: Weekly Chart Deep Dive: The Gravity of the Andrews Pitchfork
Many novices draw random lines and call them channels. But at the institutional level, we rely heavily on the Andrews Pitchfork. Invented by physicist Dr. Alan Andrews, this tool isn’t just about drawing lines; it’s based on Newton’s Third Law and the principle of “Mean Reversion.”
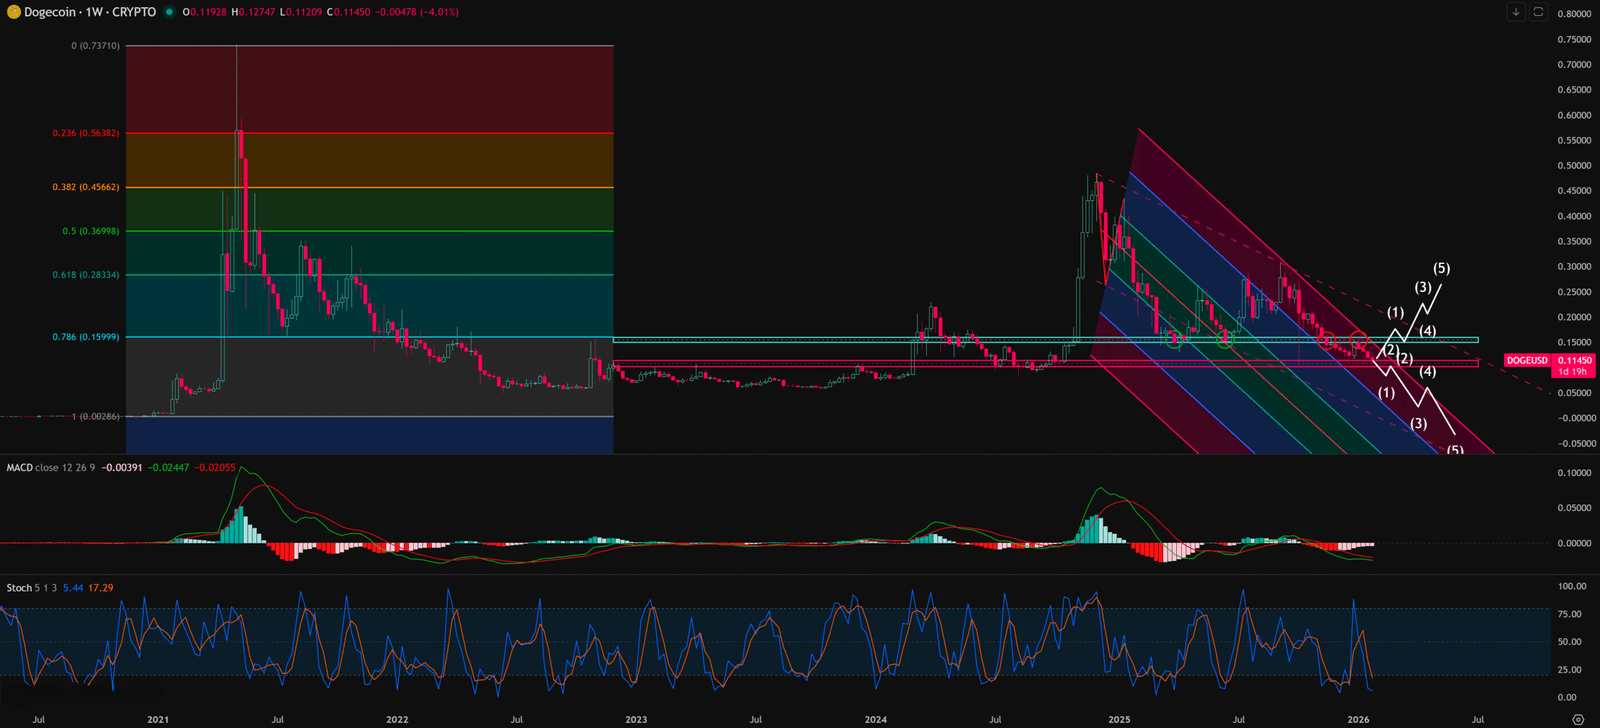
Look closely at the DOGE Weekly Chart I’ve provided:
- The Art of Pivots (P0-P1-P2): I selected Dec 9, 2024 (P0) as the Starting Point of the Downtrend, connecting the Dec 16, 2024 Bottom of the Downtrend (P1) and the Jan 13, 2025 Peak of Rebound (P2). These three points define the market’s entire “energy flow.”
- The Judgment of the Median Line: Andrews’ core theory is that price returns to the Median Line 80% of the time. But more importantly, once price breaks the Median Line and fails to reclaim it, the trend accelerates. Notice that on March 3, 2025, DOGE broke the 0.618R Lower Median Line. From that moment, the market screamed: “I am terminally ill.”
- Structural Collapse: The Weekly Chart currently prints a textbook “Lower Highs, Lower Lows” structure. Until this structure is broken, any rally is just a “Dead Cat Bounce”—an opportunity for whales to short again, not for you to buy.
- MACD’s Underwater Struggle: Look at the MACD (12,26,9) on the sub-chart. Both signal lines are below the Zero Line. Imagine a person submerged underwater (below 0); no matter how hard they struggle (golden cross), they can’t breathe. In a banker’s eyes, a golden cross below zero is often a “Short Signal,” not a buy signal.
Weekly Timeframe for DOGE (Dogecoin)
Chapter 3: Daily Chart Decoded: The “Bag Holder Psychology” of $0.16 (The S/R Flip)
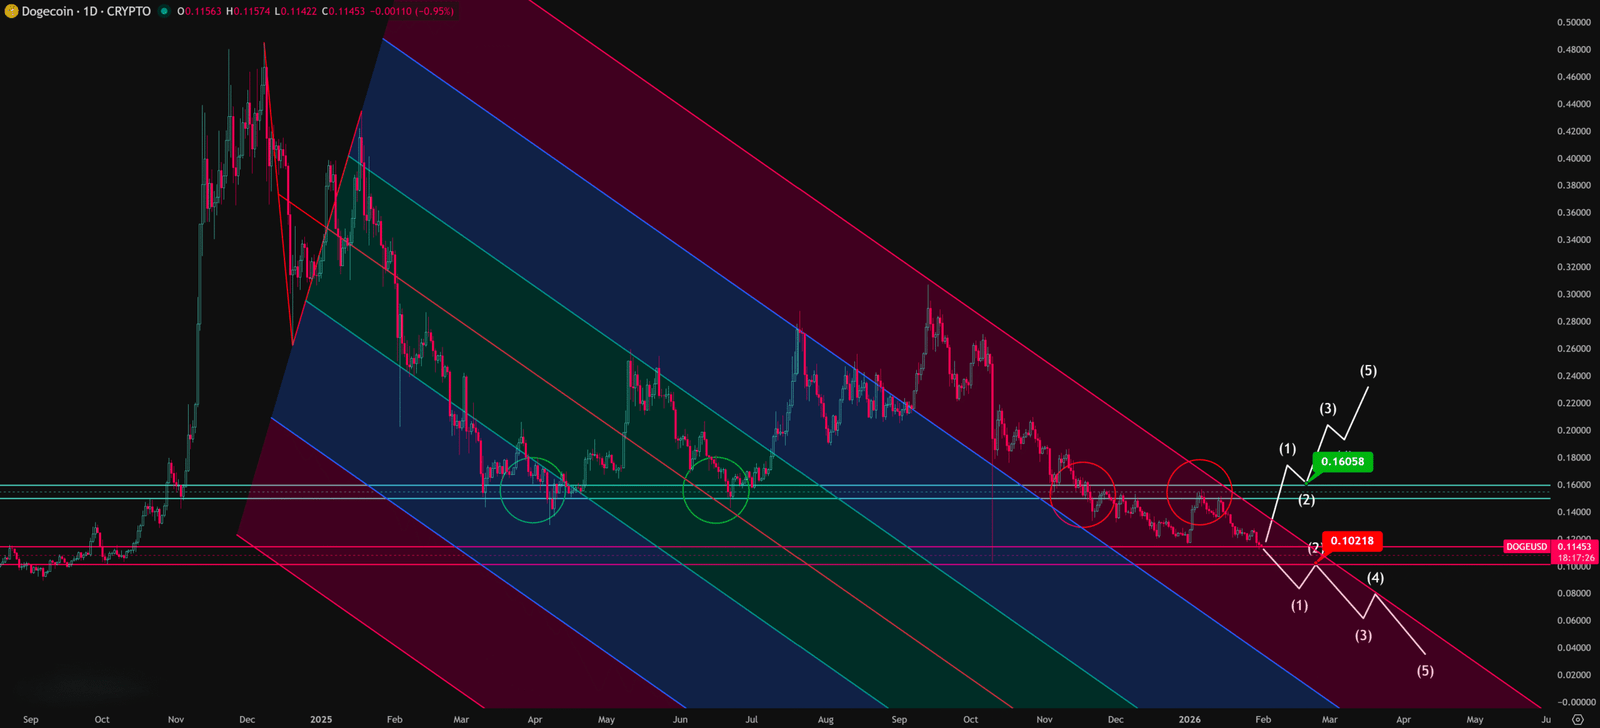
If the Weekly Chart is the strategic map, the Daily Chart is your tactical manual. This is the most brutal, bloody part of the analysis. Stare at the Red Circles on the Daily Chart (around Nov 26, 2025 and Jan 6, 2026).
What is an S/R Flip? Technical Analysis has an iron rule: “Support broken becomes the strongest Resistance.” Why? It’s not magic; it’s Human Psychology.
- History Lesson: Back in April and June 2025, $0.16 was a massive Support level. Many retail traders thought it was “cheap” and bought heavily at $0.16.
- Trapped Souls: When price officially crashed through $0.16 in Nov 2025, everyone who bought at $0.16 instantly became “Bag Holders.” They are sitting on unrealized losses, praying for one thing: “Just let me get back to Breakeven, and I swear I’ll sell!“
- The Wall of Resistance: So, when price tries to bounce back to $0.16 (the Red Circles), these Bag Holders sell desperately to escape. Combined with fresh shorts from bears, this creates a massive wall of selling pressure.
This is why I call $0.16 a “Death Sentence.” The chart clearly shows price attempting to challenge $0.16 twice, and being violently rejected both times. This proves the overhead supply is massive. Market Makers have no intention of letting retail off the hook.


Daily Timeframe for DOGE (Dogecoin)
Chapter 4: The Banker’s Playbook: How to Survive This Market
Many ask me: “So what now? Short it? Or bet on a bounce?” If you ask a gambler, they say “Bet.” If you ask a bank trader, they answer with one word: “Confirmation.”
We don’t predict markets; we follow confirmed signals. Here is my execution playbook based on the current charts:
Scenario A: The Call of the Abyss (The Bearish Case) – High Probability
- Status: Price at $0.11450, hanging in mid-air.
- Critical Level: The last line of defense is $0.102.
- Execution: If the Daily Candle closes (Real Body) below $0.102, it means the last buyers have capitulated. Below lies a vacuum, and price could trigger a Panic Sell.
- Advice: If you hold bags, a close below $0.102 is your stop loss. No excuses. Live to fight another day.
Scenario B: The Miracle Breakout (The Bullish Case) – Low Probability but Safe
- Mindset: Do not guess the bottom!
- Safe Entry: It sounds counter-intuitive, but the safest entry is NOT now. It is waiting for price to strongly break above $0.16.
- Strict Criteria: Not just a wick. I need to see 3 consecutive Daily Closes (Big Green Candles) ABOVE $0.16.
- Logic: Only then is it proven that the overhead “Bag Holders” have been absorbed, and Market Makers are willing to eat the sell orders. Until this signal appears, every buy is catching a falling knife.
Key Takeaways
Summary / Key Levels: Stop guessing. Let the market dictate. Here is my operational plan:
⛔ Critical Support (Stop Loss / The Line of Death): < US 0.102
- This is the final line of defense. If the Daily candle closes below US 0.102, the downtrend accelerates into a vacuum.
- Action: If you are holding, this is your hard Stop Loss. Do not hope. Do not pray. If this breaks, the floor is gone.
🛡️ The Safe Entry (The Banker’s Trigger): > US 0.16
- Want to go Long? Not yet. Sit on your hands. Unless BTC can break US 0.16 with a strong bullish candle and hold above it for 3 consecutive days.
- Logic: Only a reclaim of this level proves that the overhead “bag holders” have been absorbed. That is the only high-probability entry.
Our goal is not to provide a crystal ball, but to offer a clear, logical, and actionable framework by simplifying professional analysis.
Conclusion: Hunter or Prey?
The financial market is a mechanism for transferring wealth from the “impatient” to the “patient.” Retail fears missing out (FOMO); Pros fear being wrong. Currently, DOGE’s chart structure is fragile. The Pitchfork points down; the S/R Flip offers heavy resistance. Rushing in now makes you the “Exit Liquidity” for the whales.
Instead of gambling, wait. Remember, Cash is a position too.
Unlocking Technical Analysis: Power Moves with Diagrams !
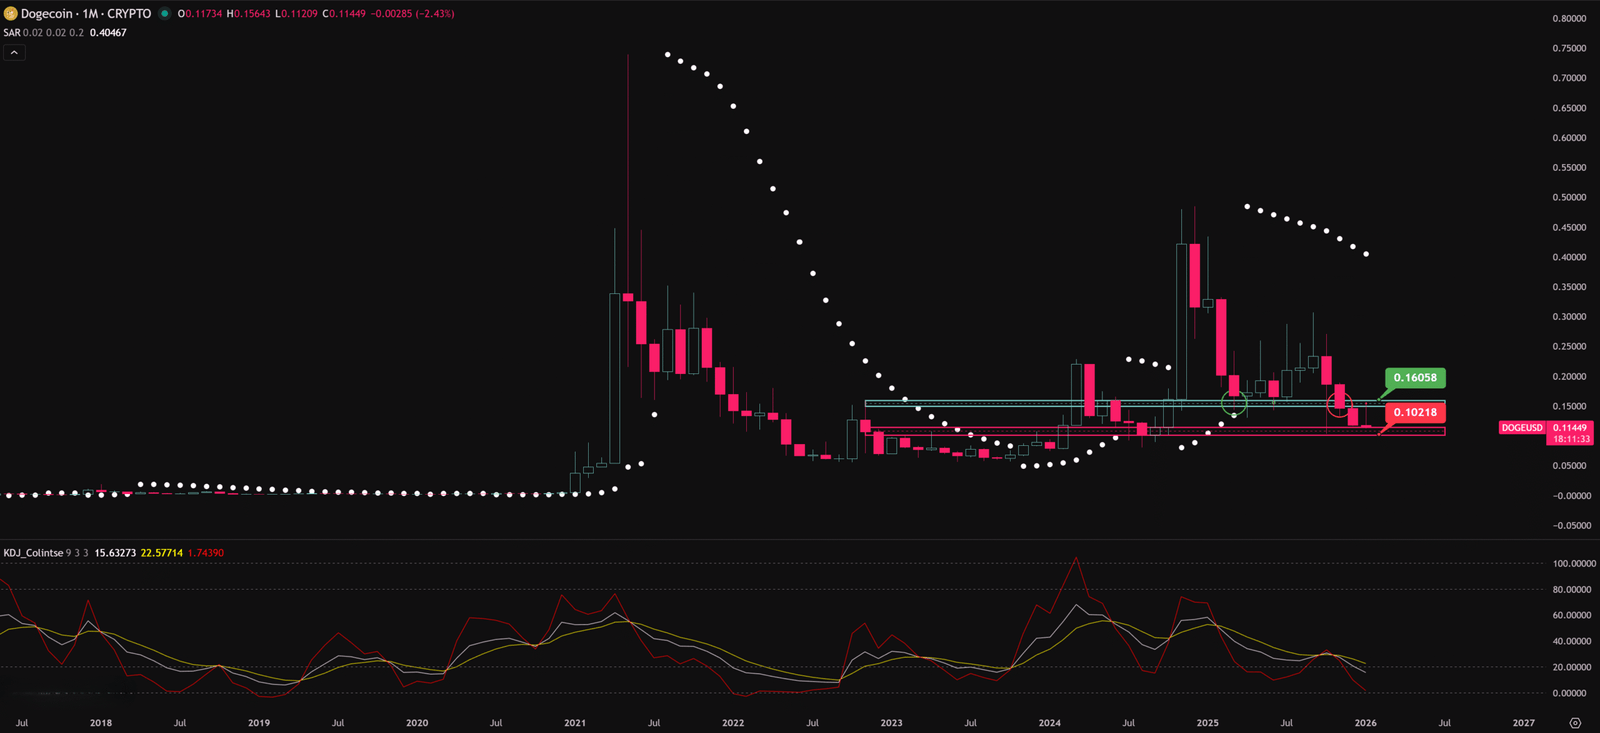
Monthly Timeframe for DOGE (Dogecoin)
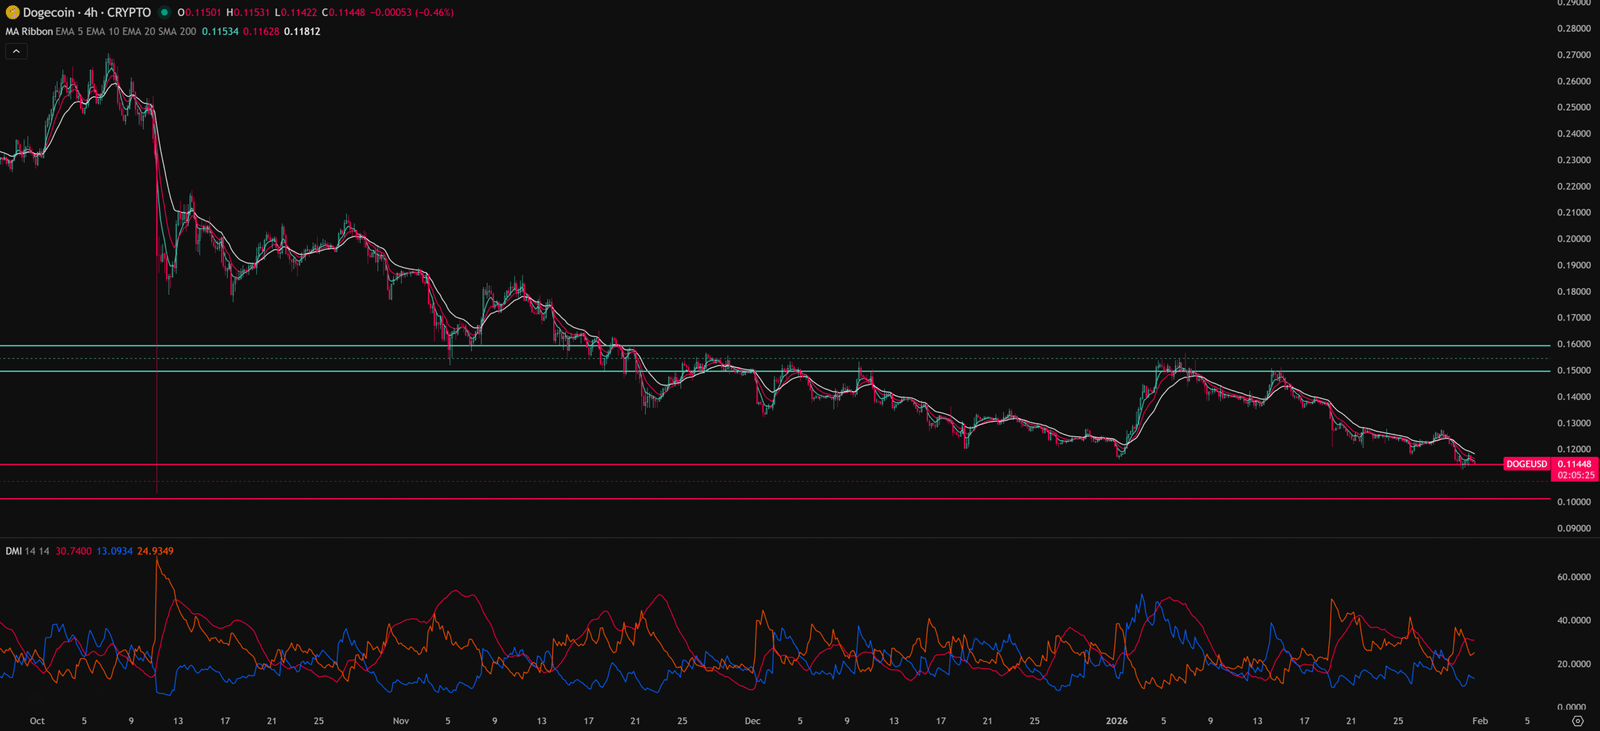
4-Hour Timeframe for DOGE (Dogecoin)
Charts don’t lie, but you have to learn their language.
Want to see our full, interactive chart breakdown? If you want to learn how to draw Pitchforks yourself, identify S/R Flips, and stop trading blind. Please browse the following『Further Reading』links. Fundamental news tells you what happened. Technical analysis predicts what will happen. To master the professional framework that separates market signal from noise, explore our exclusive models at www.chart-blitz.com.
Further Reading:
- https://www.chart-blitz.com/pitchfork-the-three-line-tool-pros-use-to-map-the-market/
- https://www.chart-blitz.com/volume-profile-vpfr-find-the-real-battle-zones-on-the-chart/
- https://www.chart-blitz.com/dmi-indicator-spot-real-breakouts-dodge-the-fakeouts/
- https://www.chart-blitz.com/kdj-indicator-triple-line-magic-for-fast-paced-trading/
- https://www.chart-blitz.com/parabolic-sar-spot-explosive-moves-before-anyone-else/
【Disclaimer】 The content herein is for educational purposes and reflects the author’s personal opinion only; it is not investment advice. All financial investments, including cryptocurrencies, carry significant risk, and you could lose your entire capital. To support this site, this article may contain affiliate links. While we strive for accuracy, we cannot guarantee all information is complete or error-free. Please conduct your own research and be fully responsible for your own investment decisions.