What’s up, traders! Are you staring at the charts day and night, feeling like you’re searching for a needle in a haystack, wanting to make bank but terrified of buying right at the top? Today, I’m breaking down a classic battle from the Dow Jones in 2025. I’m going to show you, step-by-step, how I not only perfectly sidestepped an epic market slaughter during a moment of pure panic but also found a ridiculously perfect, ultra-safe entry point. Then, I just kicked back and watched my account grow on its own. This method isn’t about luck; it’s a proven, underground playbook. Once you learn it, you can turn the market into your own personal ATM.
【Chapter 1: The Death Trap Before the Plunge】
First, let’s rewind to the beginning of 2025. On January 31st, the Dow hit a record high of 45,054. The market was euphoric; everyone thought the only way was up. But that was the calm before the storm. From that day on, the Dow fell like a lead balloon.
By March 13th, the index had plunged to 40,661 and finally showed a small bounce. At that moment, ninety percent of the so-called “experts” and the “value investing” crowd came out screaming, “This is the bottom! Buy the dip!” They figured that after such a long drop, a V-shaped recovery was imminent, maybe even the start of a “Higher High and Higher Low” uptrend.
But in my eyes, this was nothing but an extremely dangerous death trap. Based on my years of experience, a drop like this was far more likely to be an “a, b, c corrective wave” from Elliott Wave Theory. The decline from late January to mid-March was just the insignificant ‘wave a’. The small bounce that followed was ‘wave b’—the sucker’s rally designed to lure you in. Once wave b finished, what awaited everyone was the most destructive, painful drop of all: ‘wave c’!
I told myself to stay disciplined. The golden rule of Dow Theory echoed in my mind: “Never confirm an uptrend until you see clear Higher Highs and Higher Lows!” That discipline alone saved me from a historic disaster.
【Chapter 2: The Night of the 1,000-Point Crash, I Watched with Popcorn】
Fast forward to April 2nd. The market sentiment was still optimistic, and some of my friends couldn’t resist jumping the gun and buying in. But my gut told me something was off. I decided to wait one more day.
The result? The next day, April 3rd, was a date for the history books. At the opening bell, the Dow Jones Industrial Average flash-crashed, opening 1,200 points lower! The entire market froze. By the closing bell, it had hemorrhaged a staggering 1,680 points. I can only imagine the bloodbath in the portfolios of those who bought in early.
And me? I was at my desk, eating popcorn and enjoying the show. Because all of this was playing out exactly according to my script. That moment hammered home just how damn important the wisdom of the trading legends is. Go ahead and ask: if you’re a “fundamental analysis” believer, how could you possibly have predicted that flash crash? The only thing you could do was buy at the top and pray every day for the market to recover.
【Chapter 3: The Holy Trinity of Indicators to Lock in a 100% Safe Launch Point】
Now for the main event. How did I find the true golden bottom and the safest entry point amidst the wreckage? I relied on a holy trinity of indicators:
Indicator 1: The Fibonacci “Divine Number” 0.618
Since I determined the March 13th low wasn’t the real bottom, where would it be? I used a method that’s both intuitive and incredibly effective: the Fibonacci Golden Ratio. I took the range of the first wave of decline (Jan 31 to Mar 13) and multiplied it by the universally sacred “divine number,” 0.618. This gave me a magic target zone: 37,900 points. I didn’t buy there. I just waited quietly for the market to walk right into my scripted scene.
Indicator 2: The Cosmic Order of the “Gann Angle”
As the index drifted towards my magic target, I brought out my second weapon: the “Gann Angle.” I drew a sacred “1×1 descending angle line” from the peak on January 31st (45,054) down through the low on March 13th (40,661). And then, a miracle happened. On April 7th, the Dow’s low for the day landed with surgical precision on two things simultaneously: first, my 37,900 golden zone calculated with the 0.618 ratio; and second, this exact Gann Angle line! Although the price briefly dipped below, the closing price of 37,919 held firmly above this intersection. Two powerful, independent theories pointing to the exact same price. At that moment, I knew the correction was over. The bottom was 99% in.
Indicator 3: The Final Confirmation with the MACD “Double Bull” Signal
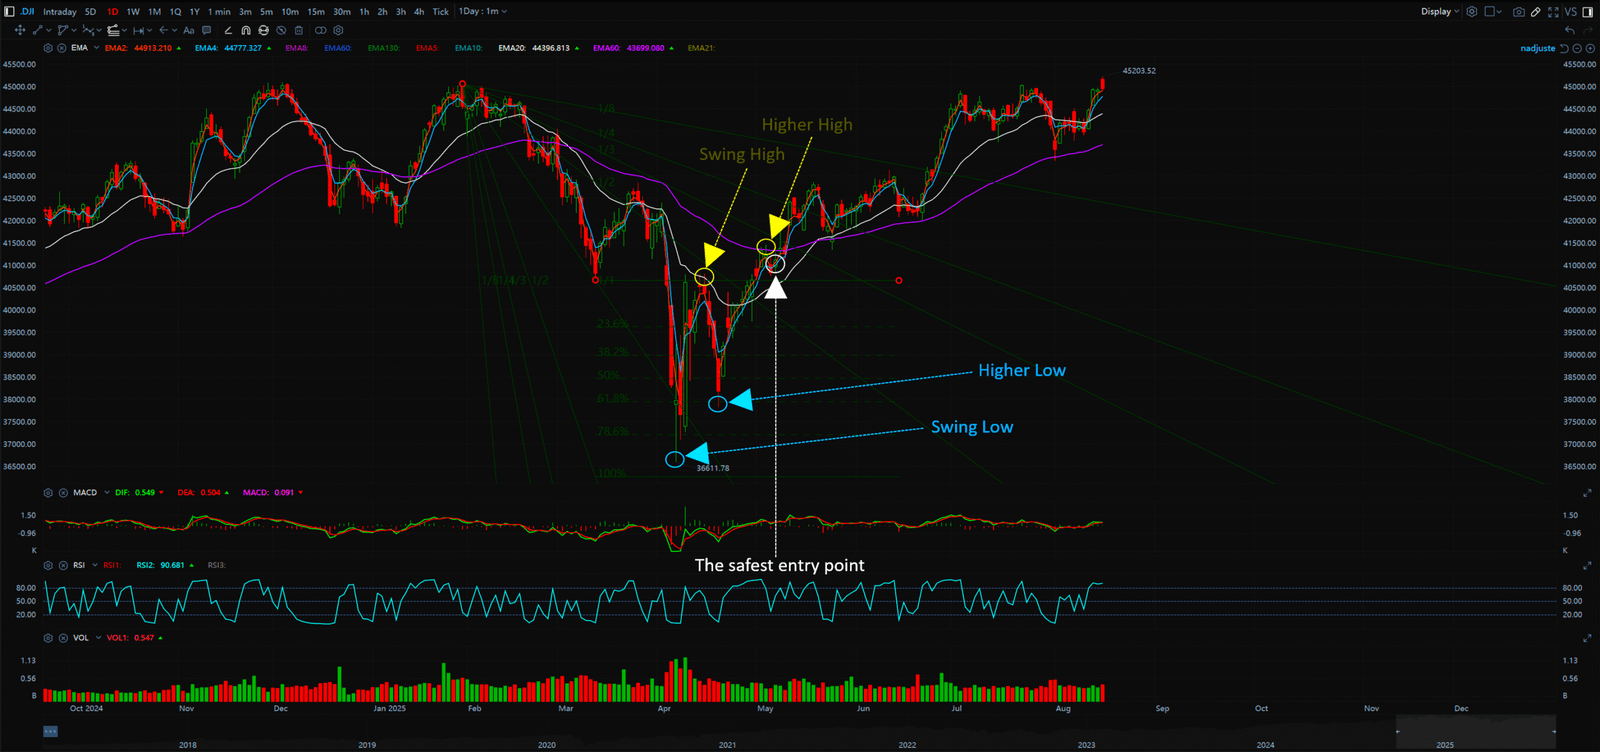
Finding the bottom doesn’t mean you immediately go all-in. What I demand is a 100% safe “launch point” where I can buy and watch it take off. For this, I patiently waited for the market to form a beautiful “Higher High and Higher Low” structure.
Finally, on May 7th, my ultimate weapon—a specially tuned MACD (1,20,3) indicator—flashed a brilliant “Double Bullish Buy Signal” above the zero line (both lines curling up). At the same time, the Dow’s structure had perfectly confirmed the “higher lows” uptrend pattern.
BINGO! The holy trinity of signals was complete! A confirmed golden bottom, support from the Gann line, a MACD double bull signal, PLUS the classic Dow Theory uptrend structure. What was I waiting for? I went in, and I went in heavy. And what happened next? You can see it on the chart. The Dow skyrocketed from there, soaring to unbelievable heights and easily breaking the old 45,000-point record.
Conclusion:
With this case study, I want to tell every aspiring trader out there that the market is never about guesswork. If you follow the time-tested principles of technical analysis and maintain discipline, you too can become a consistently profitable player in this brutal game. You don’t need insider tips. You don’t need to worship market gurus. Master this playbook, and the next person making regular withdrawals from the market will be you.