Whether you’re in the crypto, stock, or forex markets, countless young traders stare at colorful indicators (RSI, MACD, Bollinger Bands) every day, trying to find the secret to wealth. However, they often end up “knowing the what, but not the why,” ultimately becoming the market’s liquidity (aka “dumb money”).
If you want to achieve consistent profitability in the financial markets, you need to ditch those lagging indicators and return to the true essence of the market—Price Action and Order Flow. Today, from the perspective of a former banker and professional prop trader, we are going to deeply deconstruct the most core, high-win-rate concept widely used by institutions in technical analysis: Support/Resistance Flips (S/R Flips).
This isn’t some dark magic; it’s the inevitable result of real money colliding with market psychology. Master it, and you’ll be able to read the true intentions of Smart Money.
What are Support/Resistance Flips (S/R Flips)? Past, Present, and Core Logic

In the hall of technical analysis, S/R Flips are also known as the “Polarity Principle.” Its core definition is extremely simple, but the power behind it is immense:
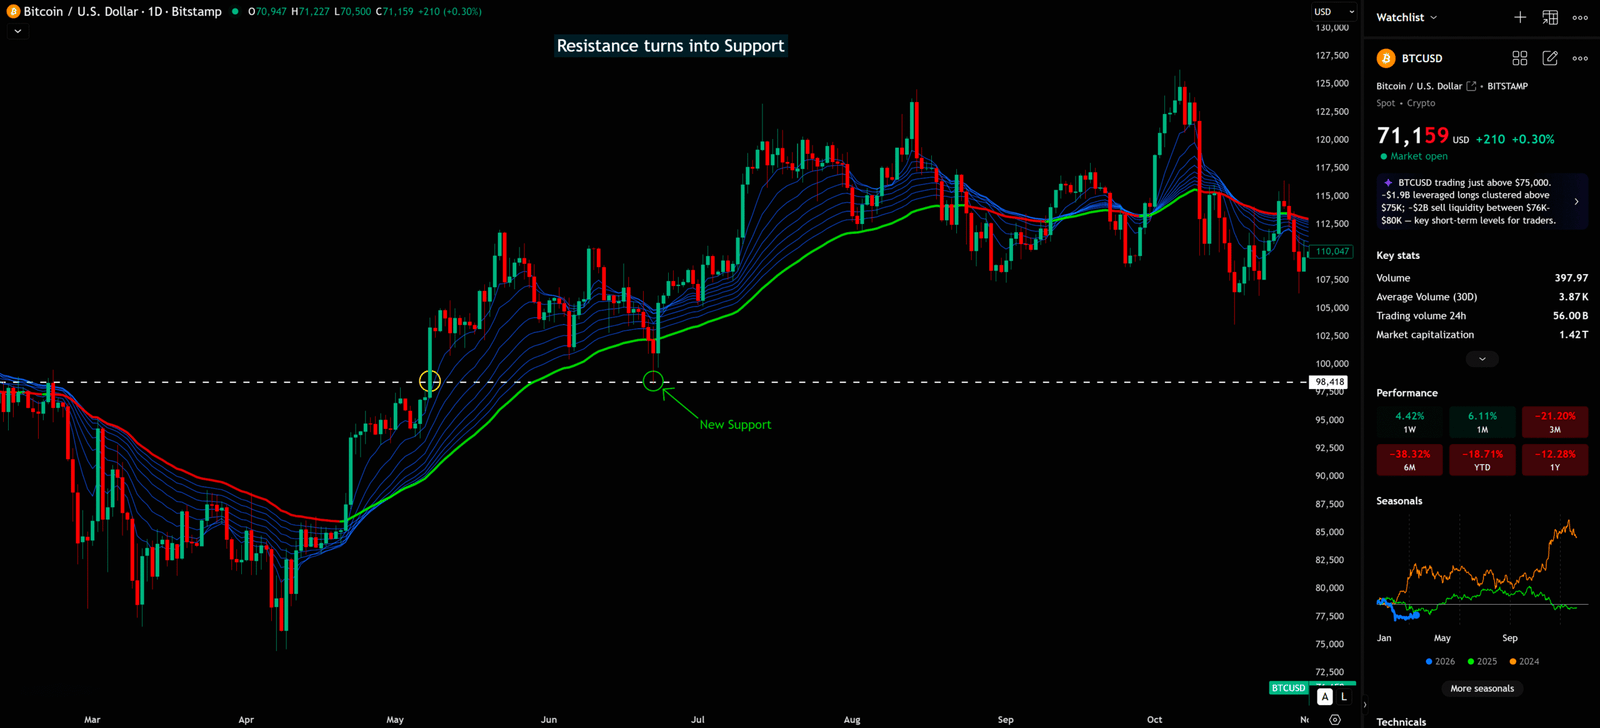
“When a strong support level (the floor) is effectively broken down, it will transform into a future resistance level (the ceiling); conversely, when a strong resistance level is effectively broken out, it will transform into a future support level.”
🧠 Why Does the “Flip” Happen? (The Market Psychology and Order Flow Behind It)
Many beginners think this is just a coincidence on the chart—dead wrong! This role reversal is 100% driven by the “greed, fear, and regret” of market participants, as well as institutional “order management.” Let’s break down the “Resistance flips to Support” scenario:
- Short Sellers’ Despair and Covering: Imagine a resistance level on Bitcoin (BTC) that has held for a long time (e.g., an all-time high). At this level, a massive number of retail traders and institutions are shorting. When the price suddenly breaks through this resistance with high volume, these short sellers are instantly underwater (in loss). When the price subsequently “pullbacks” to retest this broken level, these trapped shorts will be relieved, thinking “Finally, a chance to break even!” and frantically buy to cover their positions. This massive buying pressure directly provides support for the price.
- The FOMO of the Sidelined (Fear Of Missing Out): There is always a group of traders (bulls) who miss the initial breakout. They watch the price skyrocket and beat their chests in regret. When the price finally pulls back to the original resistance level, they see it as their “last chance to get on the train,” and a flood of buy orders pours in.
- Institutional Defense Line: The only force capable of pushing the price through key resistance is institutional capital (Smart Money). Once the price breaks out, this level becomes their new cost basis. When the price drops back to test it, institutions will inject passive buy orders (Limit Orders) again to defend the level and protect their breakout gains.
The convergence of these three massive buying forces at the exact same price level forcibly stomps the former “ceiling (resistance)” into a solid “floor (support).”
Formation and Confirmation Criteria of S/R Flips: Rejecting the “Fakeout” Trap
Knowing the concept is only the first step. The deadliest trap in live trading is the “Fakeout” (or Bull/Bear Trap). A perfect S/R Flip trade setup must go through a rigorous “Validation” process. Pro traders use the following criteria to confirm:
🔍 The 4 Stages of a Standard Formation:
- Establishment of Key Levels: The price must have historically been rejected or supported at a certain horizontal zone multiple times (at least 2-3 times). The more touches, the stronger the “memory effect” of that level, and the more powerful the future Flip will be.
- Decisive Breakout: This is crucial! The breakout cannot be weak. We need to see the price pierce through the level with strong momentum. On the chart, this manifests as one or several large-bodied bullish/bearish candlesticks (Marubozu/Momentum Candles), with almost no wicks in the opposite direction.
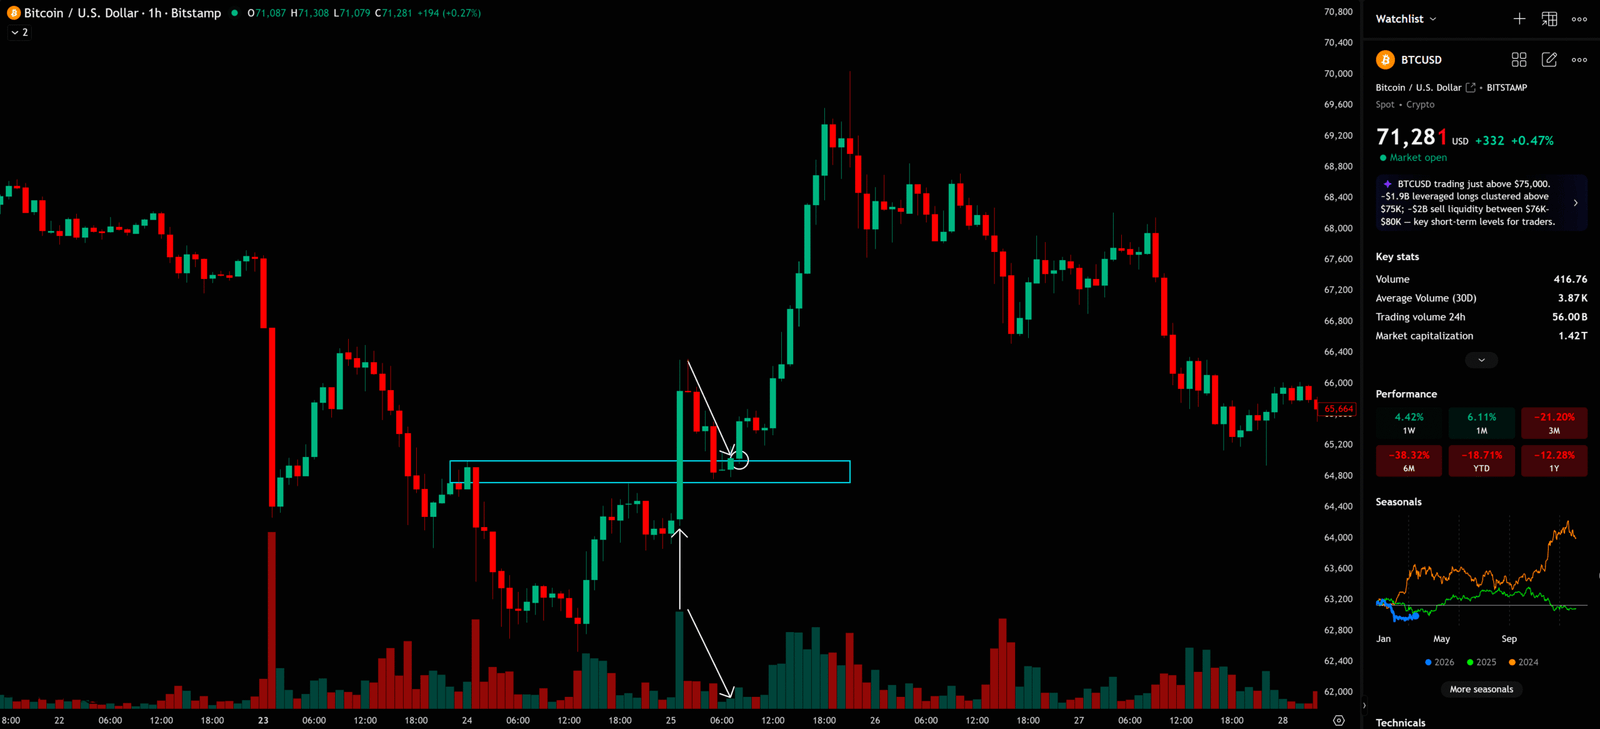
- Retest / Pullback: After the breakout, the price pulls back due to profit-taking, returning to the key level that was just broken. (Beginner’s fatal flaw: FOMO buying at the exact moment of breakout; Veteran’s wisdom: Patiently waiting for the retest).
- Confirmation: The price must show a clear “Rejection” reaction at that level. For example, the appearance of a Pin Bar with a long lower wick, or a Bullish Engulfing pattern, proving that the role of the level has successfully flipped and buyers/sellers have taken control of the market.
🛡️ High-Win-Rate “Filter” Conditions:
- The Secret of Volume: The breakout must be accompanied by abnormally high volume (at least 1.5 times the recent average), which proves the genuine participation of institutional funds. Conversely, when the price pulls back to retest, the volume should shrink significantly, indicating that the selling pressure (or buying pressure) is drying up and no one is willing to push the price further in the opposite direction at this level.
- Look at the Body, Not the Wick: A breakout must be judged by the Close Price of the candlestick body. If it’s just a long wick piercing the resistance and quickly retracting, it is absolutely not a breakout, but rather institutions conducting a “Liquidity Hunt” (explained in detail later).
- It’s a “Zone”, Not a “Single Price”: This is the most common mistake beginners make! Support and resistance are never a single price line accurate to the decimal point; they are a “Buffer Zone.” In highly volatile markets like crypto, you should draw a rectangular zone from the edge of the candlestick bodies to the edge of the wicks. As long as the price enters this zone and shows a reversal signal, it is considered a valid retest.
General Trading Strategies (Basic Usage): Building Excellent Risk/Reward Ratios
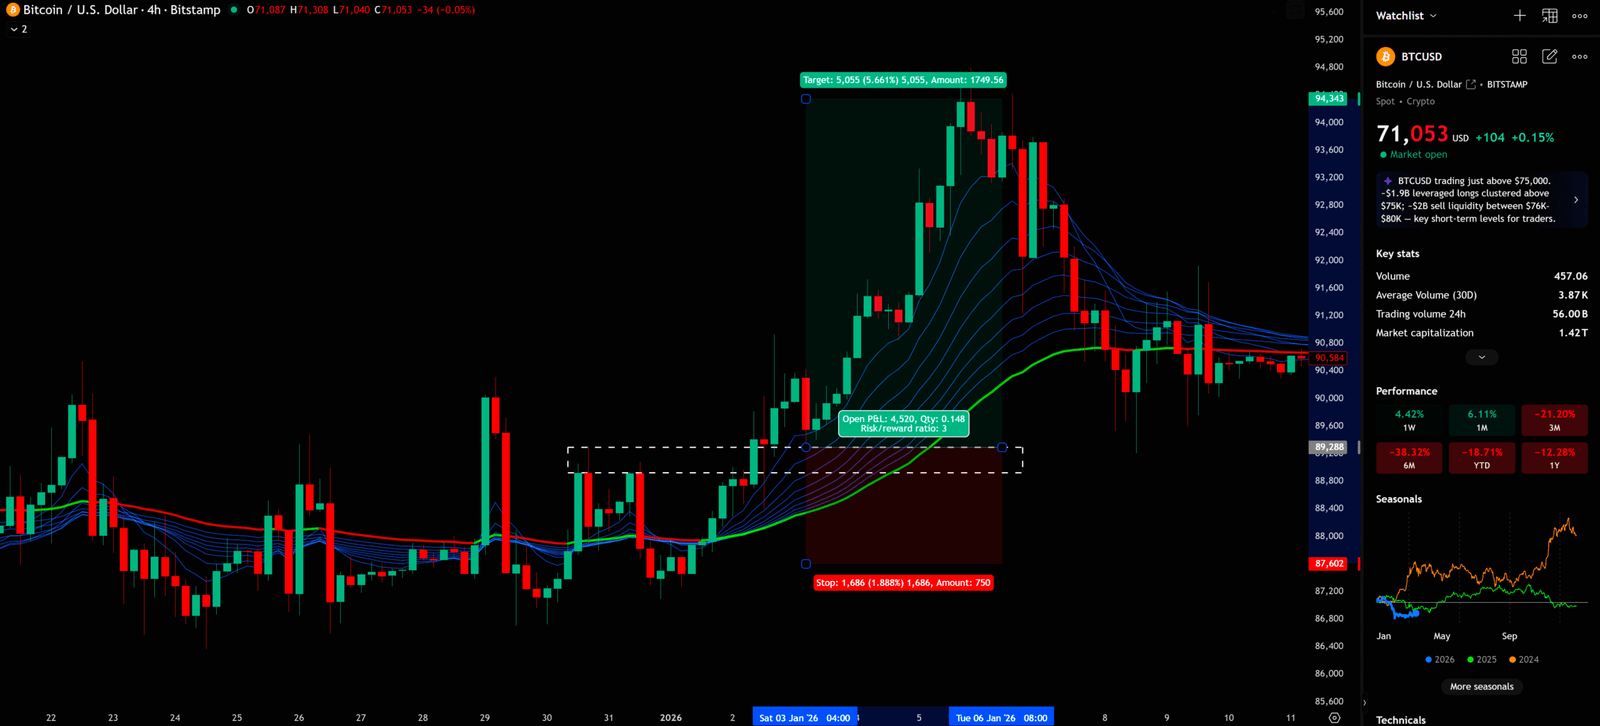
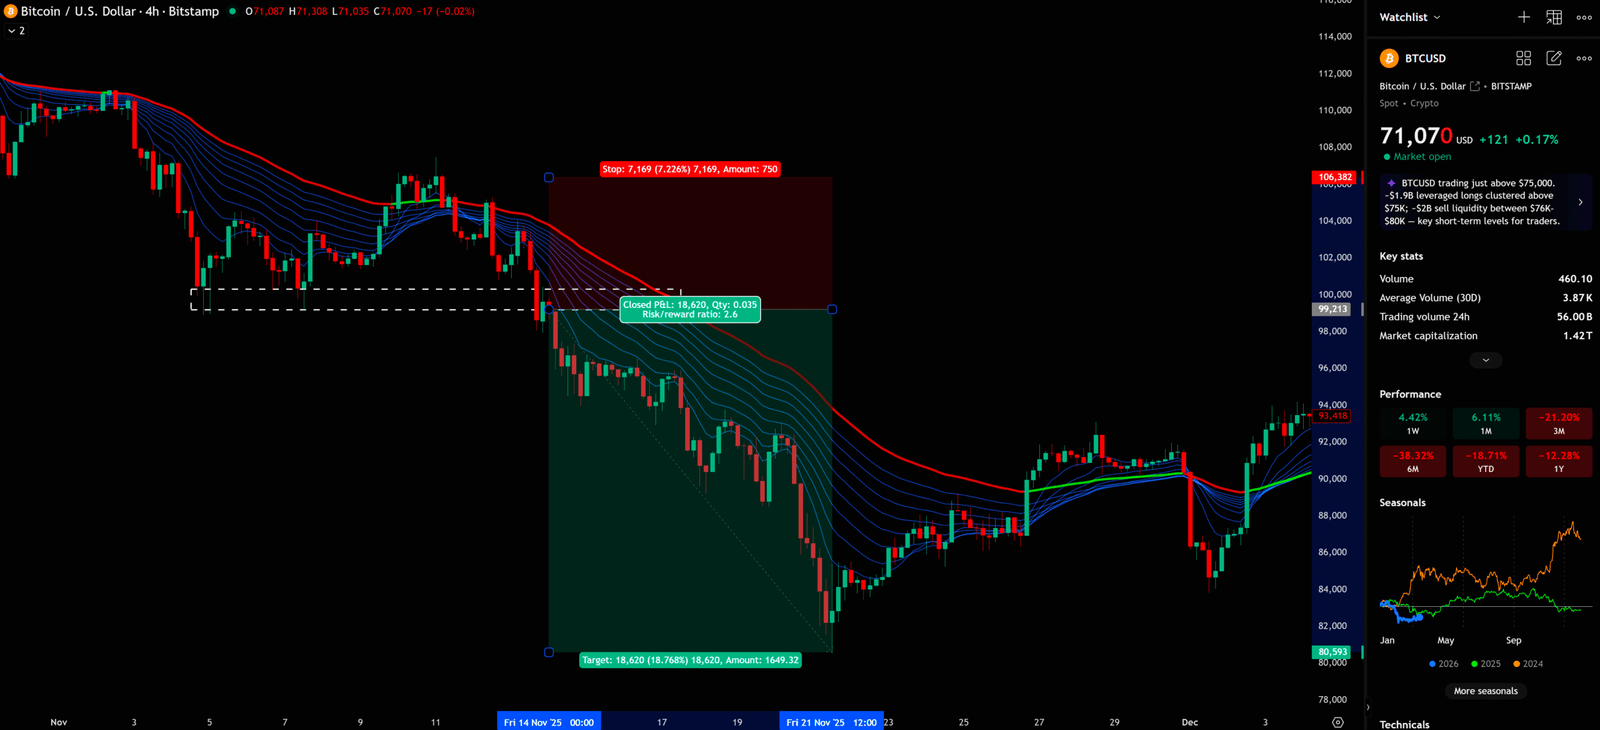
Once you master the confirmation criteria, we can build specific trading strategies. The greatest advantage of S/R Flips is that they provide us with extremely clear “Invalidation Levels,” which means we can set very tight stop-losses, thereby achieving excellent Risk/Reward Ratios of 1:3 or even 1:5+.
1. Break & Retest Long
This is the most common and robust way to get on board during a bull market.
- Scenario: Price breaks upward through a strong resistance zone that has been consolidating for a long time, accompanied by high volume.
- Entry: Absolutely do not FOMO buy at the top of the breakout candle! What you need to do is set a price alert and go grab a coffee. Patiently wait for the price to pull back and test the resistance zone that was just broken (now the new support zone). Enter at market price when the price enters this zone and shows a bullish candlestick reversal signal (like a Pin Bar or Morning Star) on a lower timeframe (e.g., 15-minute chart).
- Stop Loss: Set it slightly below the new support zone. The professional approach is to combine this with the ATR (Average True Range) indicator, placing the stop loss below the zone minus a distance of 0.5 to 1 ATR, to prevent being stopped out by random market noise or malicious wicks from market makers.
- Take Profit: Look for the next structural resistance level on the left side of the chart as your first take-profit target (TP1), ensuring a minimum Risk/Reward ratio of 1:2.
2. Break & Retest Short
This is the best weapon for trend-following shorts in a bear market or deep correction.
- Scenario: Price effectively breaks down below a key bottom support zone.
- Entry: Similarly, do not chase the short during the plunge. Wait for the price to pull back up to test the support zone that was just broken (now the new resistance zone). Enter short when the price touches this zone and prints a bearish candlestick (like a Shooting Star or Bearish Engulfing).
- Stop Loss: Set it above the new resistance zone, again leaving some ATR breathing room.
- Take Profit: Look down toward the next structural bottom support level.
Advanced Techniques from a Former Banker: Seeing the Truth Behind the Charts
If you stop at the basic usage in Section 3, you will still frequently get “chopped out” by the market. As professionals with banking trading experience, we don’t just look at the surface patterns; we combine S/R Flips with Liquidity, Market Structure, and Order Flow. This is the profit code of top-tier traders.
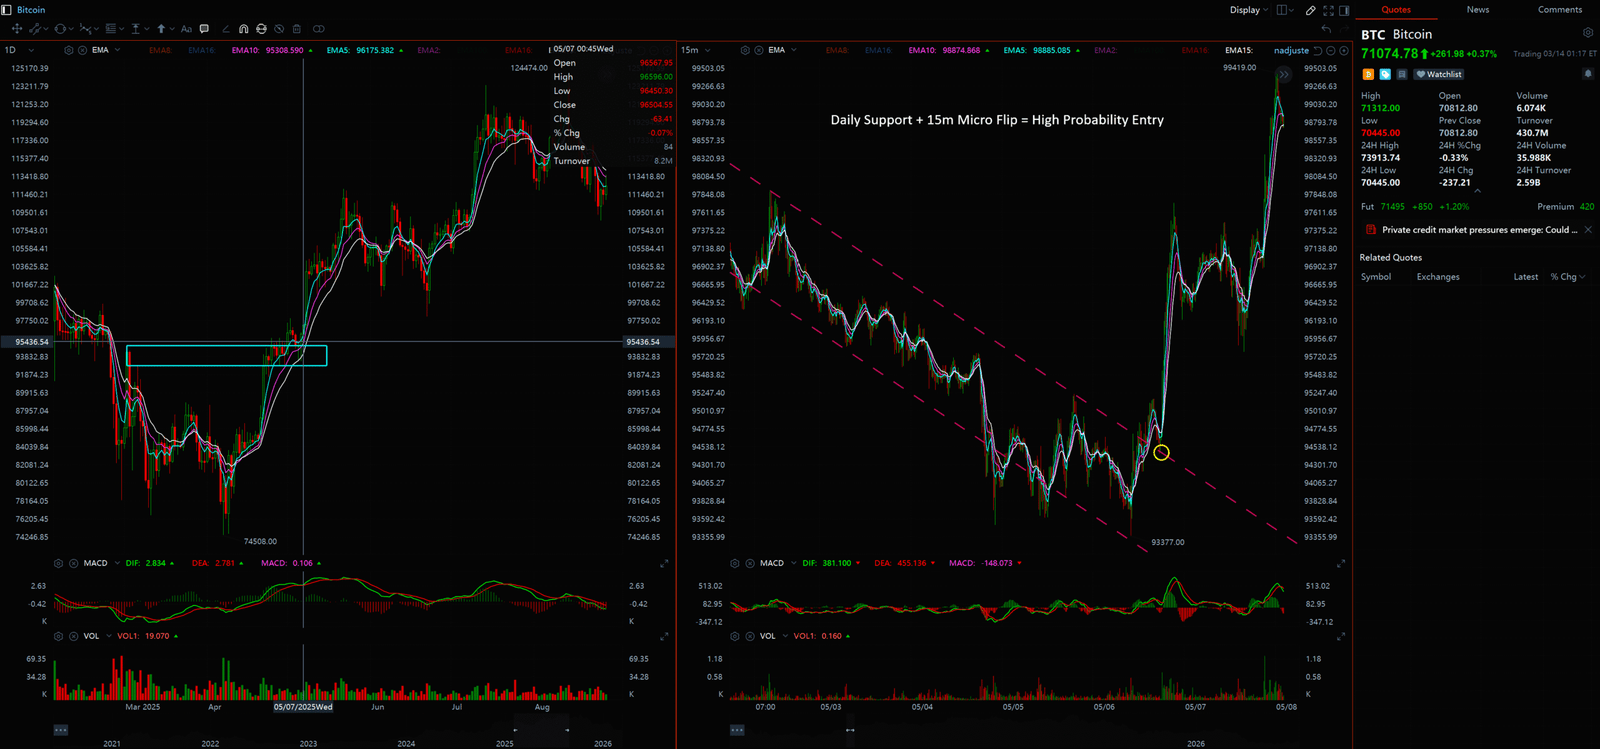
1. Multi-Timeframe Confluence: The Sniper’s Perspective
An S/R Flip drawn on a single timeframe (e.g., only looking at the 15m chart) is highly prone to failure because it might just be minor noise within a larger macro trend. Advanced traders always use a “Top-Down Approach.”
- The Anchor (Macro Level): Always open the Daily or Weekly chart first to draw the most macro, most important support/resistance zones. These levels represent the consensus of macro capital (hedge funds, institutions) and are extremely hard to change easily; they attract price like magnets.
- The Trigger (Micro Level): When the price approaches a key Daily level, switch to the 1-Hour (1H) or 15-Minute (15m) chart. If, right above a macro support level, a local “micro resistance is broken and retested (Micro S/R Flip)” occurs on the lower timeframe, this is an extremely high-win-rate, low-risk sniper entry point. This means the micro-trend has aligned (confluenced) with the macro-trend.
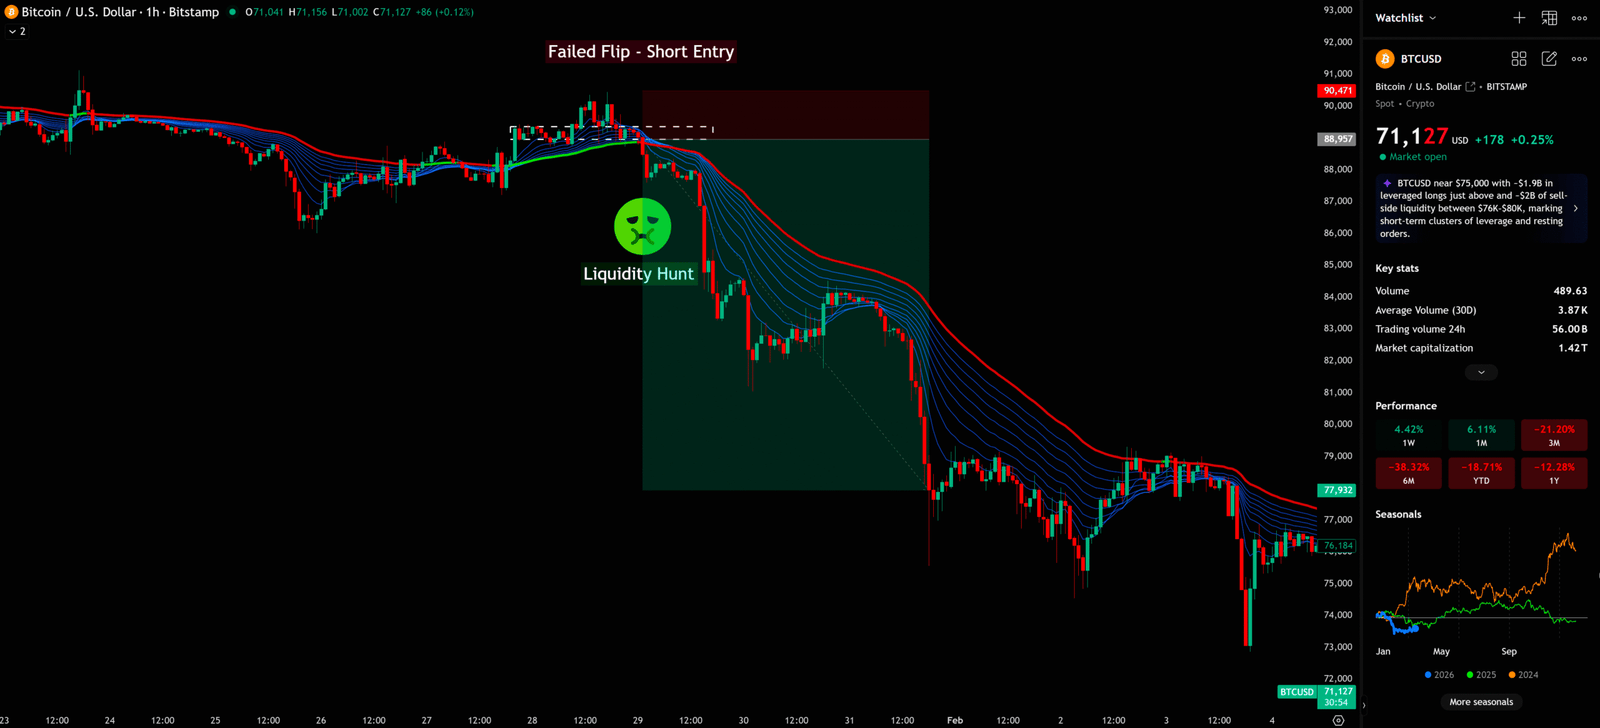
2. Identifying “Liquidity Hunts” (Stop Runs): Harvesting the Retail Traders
This is the most common institutional tactic in the crypto market. Retail traders love to chase breakouts or place their stop-losses tightly behind support/resistance levels. Institutions (Smart Money) know this perfectly well; they need these retail stop orders to provide “liquidity” for their own massive orders.
- Fakeouts Combined with S/R Flips: Suppose the price breaks upward through an obvious resistance level. Retail traders frantically buy long, and short sellers’ stop-losses are triggered (turning into market buy orders). But immediately after, the price doesn’t continue rising, nor does it successfully retest; instead, it rapidly dumps back below the resistance level with a massive bearish candle. This is a classic “Fakeout” or “Deviation.”
- Advanced Play (The Failed Flip): This means the retail traders who chased the long are trapped, and institutions have acquired enough liquidity to build their short positions. At this point, the anticipated “resistance turns support” has failed, and this level becomes a super resistance loaded with trapped buyers. Professional traders will not look to go long here; instead, they will decisively flip short, targeting the bottom of the consolidation range!
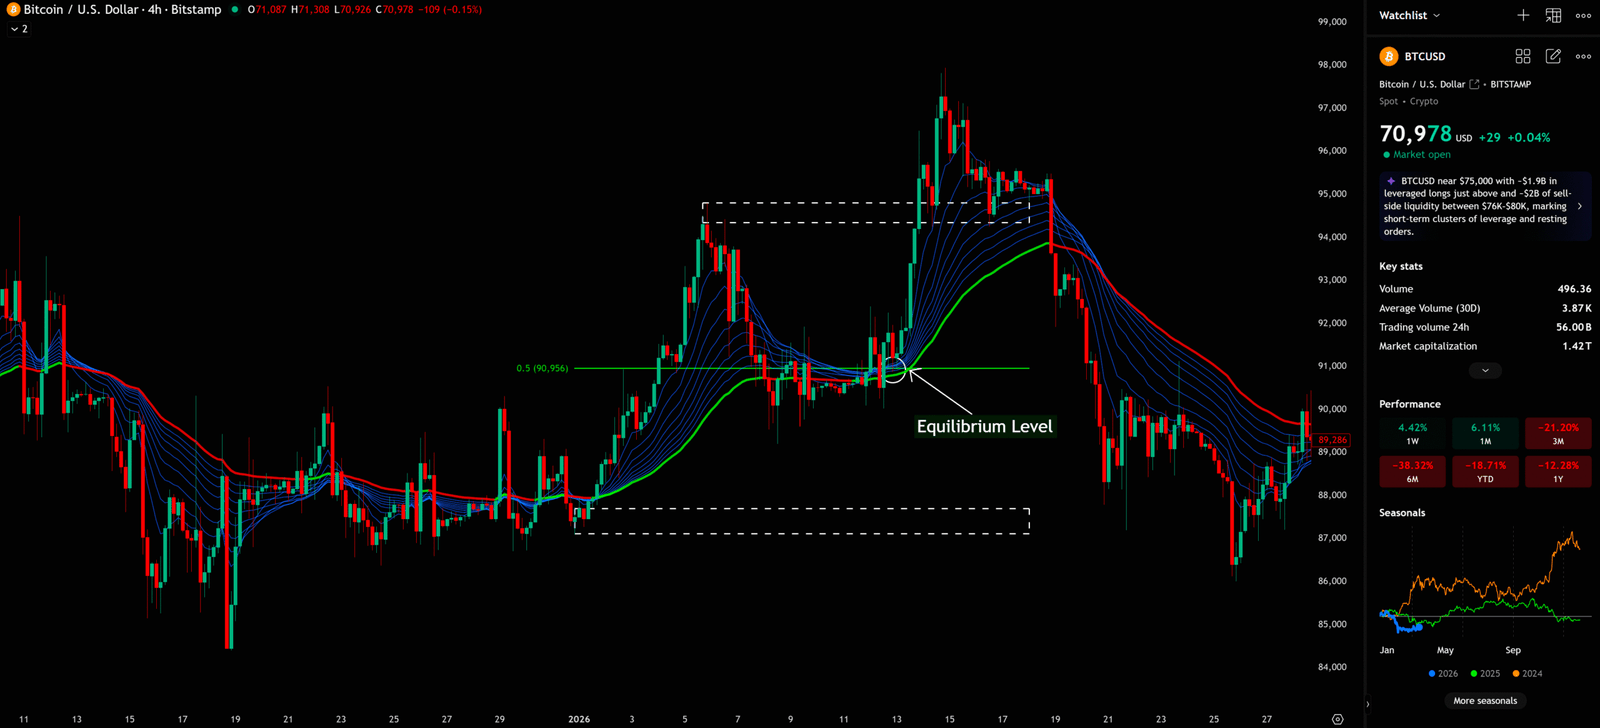
3. Trading the Equilibrium (EQ Level) in Ranges
The market spends 70% of its time in a Range-bound state. In a ranging market, besides the top resistance and bottom support, the midline of the range (EQ Level, or the 50% mark) is a crucial, hidden S/R Flip zone.
- The Battle for EQ: When the price is moving in the lower half of the range, the EQ line acts as resistance. Once the price breaks the EQ with volume and confirms the retest (EQ Flip), it strongly suggests that bulls have taken control of the range, and it is highly probable the price will go on to test the top of the range. Treating the EQ as a local S/R Flip level allows you to catch high-win-rate swings within choppy markets without foolishly waiting for the price to reach the extreme edges of the range.
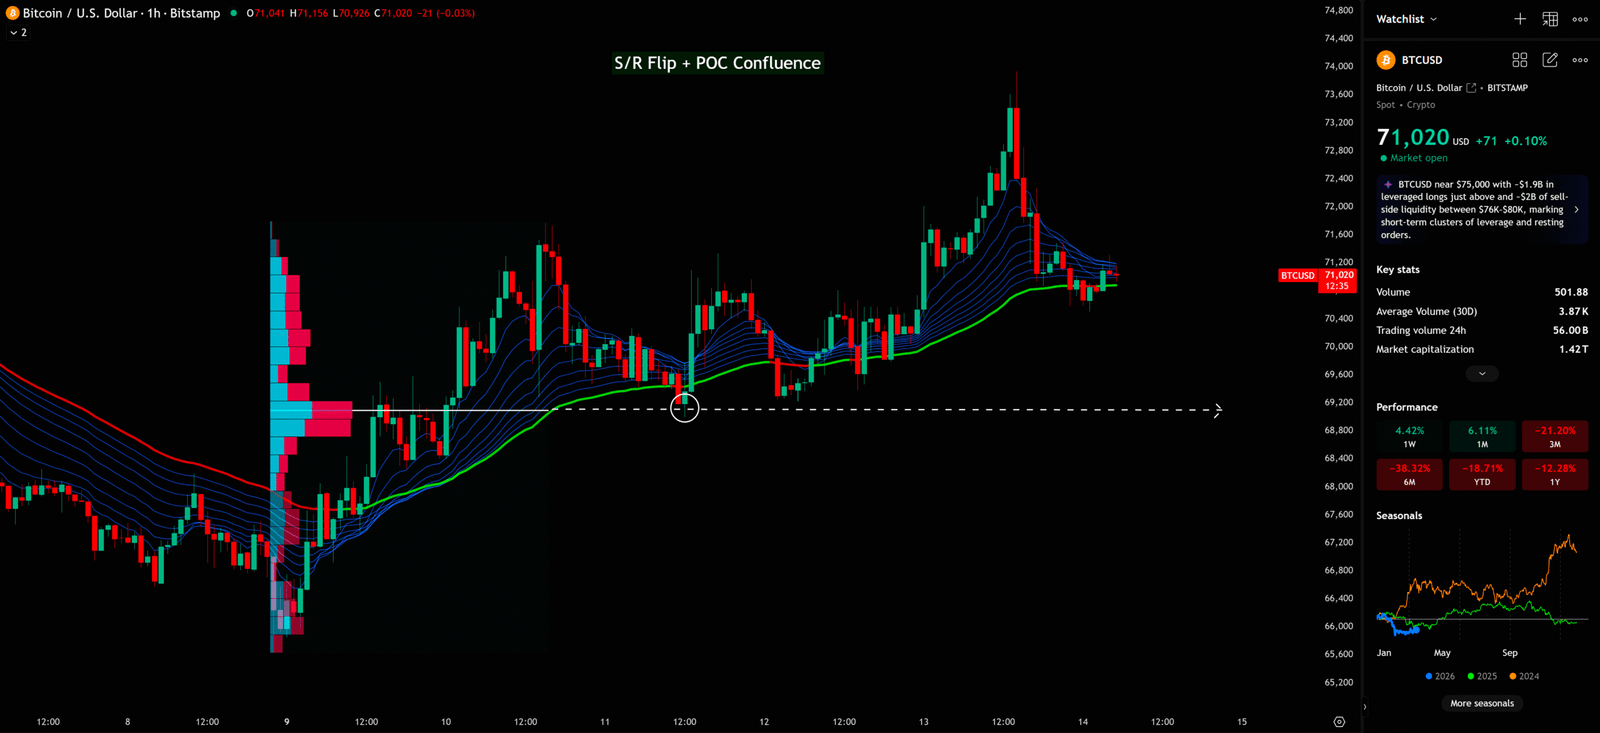
4. Combining Order Flow and Volume Profile
Traditional S/R Flips only look at candlestick prices, while advanced players use an X-ray machine to look at the market’s “internal structure.”
- HVN (High Volume Node) Validation: Introduce the VPVR (Volume Profile Visible Range) indicator. If an S/R Flip happens to occur near a “High Volume Node (HVN)” or the “Point of Control (POC)” on the VPVR, it means this price area has seen massive historical volume exchange. An S/R Flip backed by such a heavy volume cluster sees its validity as a new support/resistance increase exponentially!
- Absorption: (Advanced Concept) During the pullback retest of a new support level, if you observe on an Order Flow chart (Footprint Chart) that massive “Market Sells” are dumping, but the price stops falling, it means these sell orders are being completely absorbed by “Limit Buy Orders” pre-placed by institutions. This is ironclad proof that institutional money is fiercely defending the level. Seeing this, you should immediately follow them and go long heavily.
Conclusion & Bonus: The Most Popular “Golden Parameters & Timeframes” Worldwide Revealed!
Support/Resistance Flips are the purest manifestation of market structure. They teach us the most important lesson in trading: Never chase the moment of breakout; true professional traders always wait for the retest confirmation.
Many beginners often ask me: “What are the best parameters for S/R Flips? Which timeframe is the most accurate?”
We must clarify a core concept here: S/R Flips are pure price action; they do not have “default parameters” like traditional indicators (e.g., the 14-day RSI). Their power depends entirely on how you combine “Timeframes” with “Auxiliary Validation Tools.”
After deeply analyzing top prop traders and crypto influencers globally (US, Europe, Hong Kong, Taiwan, Singapore), I have summarized the hottest, highest-win-rate “Golden S/R Flip Combo” currently in the market, perfectly suited for 18-35-year-olds who have some time to watch the charts:
🏆 The Exclusive Golden Combo: [ 4H/1D for Zones + 15m for Entries + EMA 21/50 Dynamic Confluence ]
This combination perfectly balances “win rate” with “trading frequency.” Here is the exact execution:
- Macro Perspective (Setting the Stage): Use Daily (1D) or 4-Hour (4H) charts.
- Action: Draw your key S/R “Zones” on these two timeframes. Remember, only draw the most obvious zones with the most touches. These are your “main battlegrounds.”
- Micro Perspective (Finding the Trigger): Use the 15-Minute (15m) chart.
- Action: When the price enters your pre-drawn 4H/1D zones, switch to the 15m chart to monitor. Look for a candlestick breakout and retest confirmation (Micro Flip) on the 15m level. This allows you to get an extremely tight stop loss.
- The Ultimate Auxiliary Parameter (Dynamic Confluence): Add EMA 21 and EMA 50 (Exponential Moving Averages).
- Action: When the price retests the S/R zone on the 15m chart, if the EMA 21 or EMA 50 (from the 15m or 1H timeframe) happens to be passing through that zone providing “dynamic support/resistance,” this is called “Double Confluence.” The win rate for this signal is astronomically high, making it an excellent spot to size up your position!
Chart-Blitz’s Final Advice: Combine the S/R Flip with multi-timeframe analysis, an institutional liquidity perspective, and volume validation, and it will become the sharpest, most consistent profit-generating weapon in your trading system. Remember, trading isn’t about who trades the most; it’s about who has the patience to wait for that “perfect Retest.”
Good luck trading! See you in the next lesson!