When you make a trade, you should have a clear target of where you expect to get out
William Delbert Gann – 1949
When you see news headlines like “Trump hints Iran war could end soon,” followed by ETH’s sudden and violent bounce from $1,800 to reclaim the psychological $2,000 level, do you think it’s just a coincidence? Retail investors always chase the news, but an ex-bank trader with 20 years of traditional banking experience will tell you: News is merely a lagging catalyst; the real script was written on the technical charts long ago.
Today, we skip the hopium and focus purely on the data. We will start from the “God’s eye view” of the Weekly Chart and peel back the layers to reveal the whales’ true intentions for ETH, so you can finally see this bull-bear battle for what it truly is.
【Analysis Baseline Statement】
All technical analysis below is based on the locked price snapshot taken on March 10, 2026, 09:00 (GMT+8): ETH = $2,055 USD (cross-referenced from CoinGecko $2,046 and Yahoo Finance $2,066, averaged). Please treat this report as an “analytical map” rather than a real-time quote. Markets move fast; always use the actual market price at the time of your decision.

🔥 24-Hour Market Catalysts: News is the Bait, Charts are the Truth
Before diving into the charts, we must first examine what happened in the market over the past 24 hours. Not because the news itself matters much, but because understanding how whales use news to complement chart movements is the hallmark of a true professional.
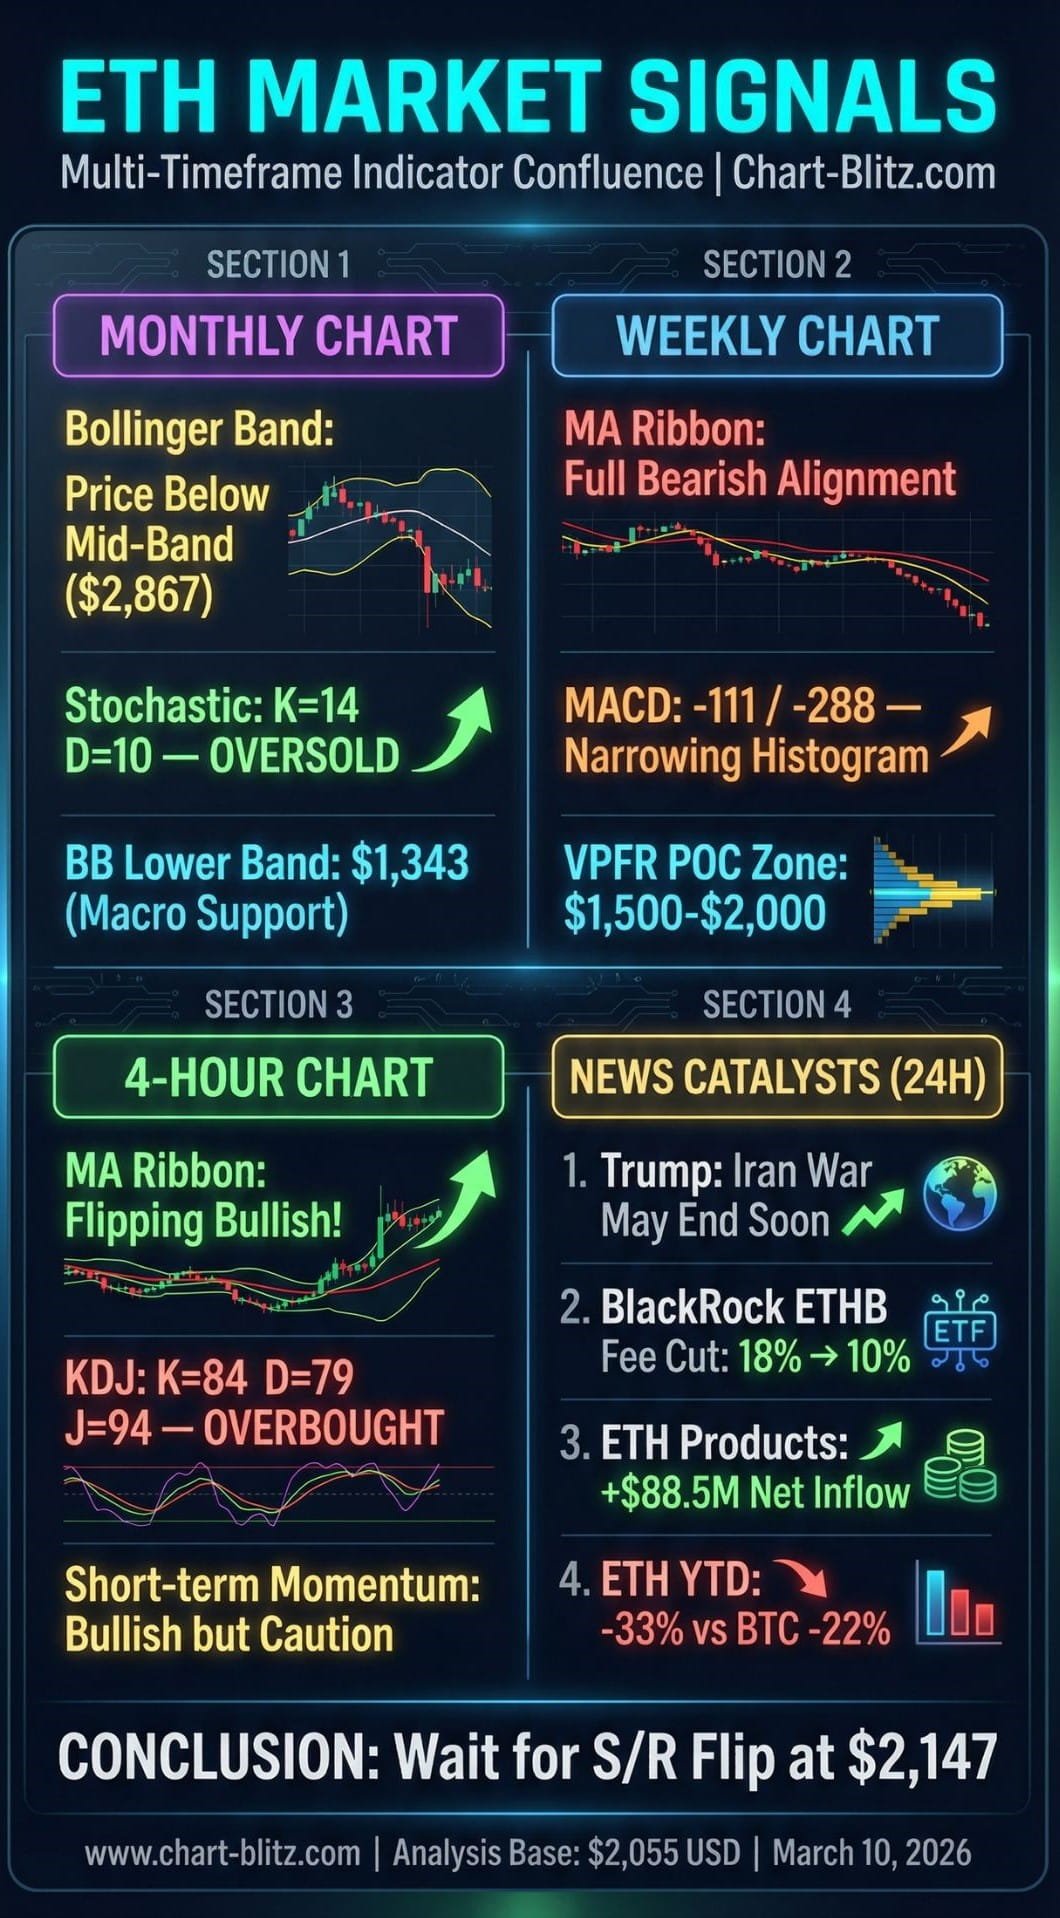
Catalyst #1: Trump’s Iran War Comments. US President Trump stated between March 9-10 that the Iran war could end “very soon.” These words triggered a rapid rally in global risk assets: the Dollar Index (DXY) fell to 98.5, oil prices dropped, and the crypto market surged within hours, with ETH bouncing violently from its $1,800 lows.
Catalyst #2: BlackRock ETHB Positive Development. BlackRock updated its iShares Staked Ethereum Trust (ETHB) filing, slashing the staking fee from 18% to 10%, with a launch expected in the first half of 2026. Simultaneously, BlackRock deposited approximately $153 million in BTC and ETH to Coinbase, signaling continued institutional interest in Ethereum.
Catalyst #3: ETH Investment Product Inflows. Ethereum-related investment products recorded a net inflow of $88.5M, with BlackRock’s iShares Ethereum Trust ETF (ETHA) being the standout performer.
However, the ex-banker’s perspective tells us: These bullish headlines may well be the bait that whales release to create “exit liquidity.” When retail investors rush to buy on BlackRock news, institutions are quietly distributing. Charts never lie; let’s return to the real battlefield.
📊 Weekly Chart: The God’s Eye View of Wave Codes and the Life-or-Death Line
As professional traders, the Weekly Chart is always the absolute core of our analysis. This is the highest dimension where whales lay their plans, and the battlefield that retail investors most often overlook. Currently, the ETH weekly chart is displaying a suffocating battleground.
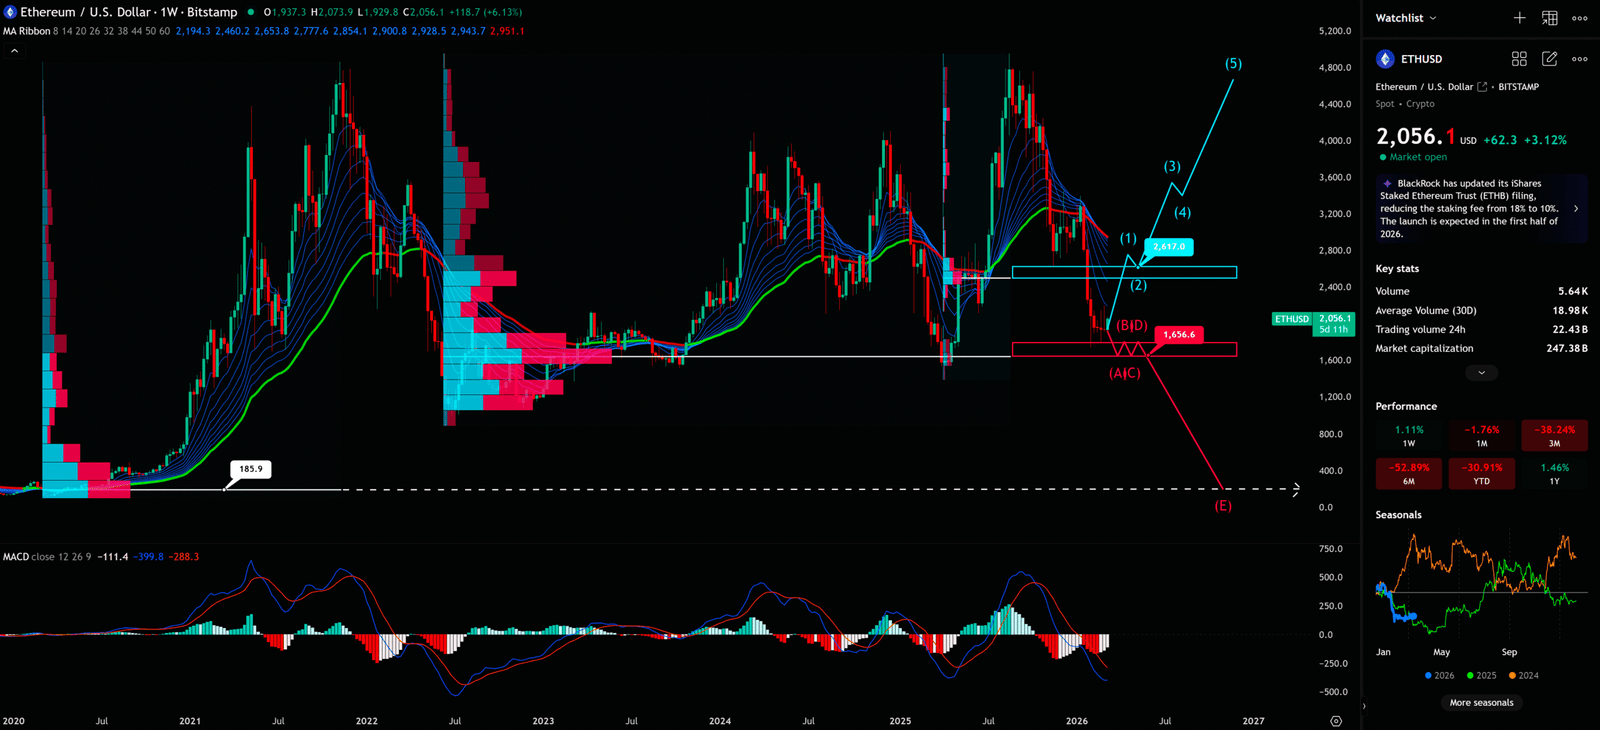
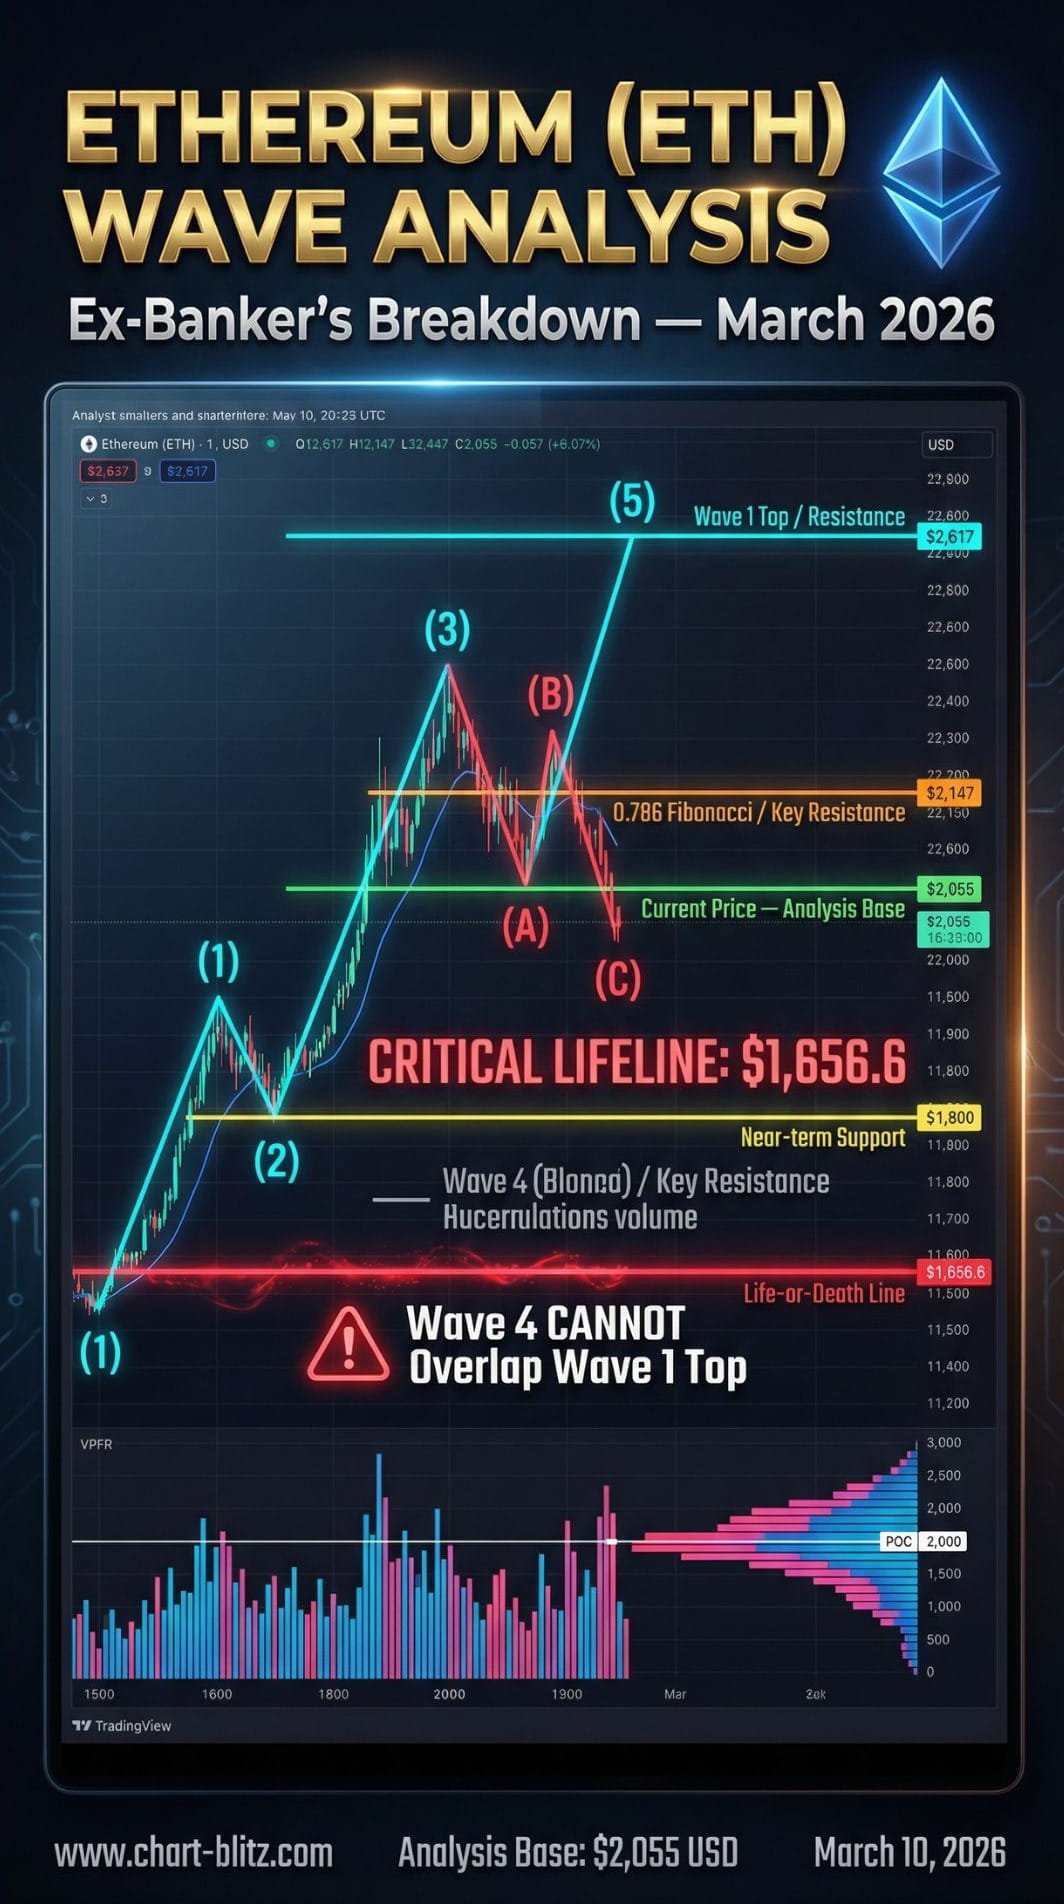
After retreating from its 2021 all-time highs, ETH entered a prolonged and complex corrective structure. The chart clearly marks the potential development of Elliott Waves: a massive (1)(2)(3)(4)(5) upward impulse wave, accompanied by (A/C)(B/D)(E) corrective waves. Here, an iron rule of Elliott Wave theory must be etched into your mind: The bottom of Wave 4 absolutely cannot overlap with the top of Wave 1. This is the most inviolable red line in Elliott Wave theory.
Currently, we are looking at a crucial line of defense—$1,656.6 (marked on the chart as the bottom of the B/D wave, highlighted in a red box). This level is not just a structural support; it is the “lifeline” of the entire bullish trend. If the ETH price ruthlessly breaks below this level, the hypothesis of the entire 1-2-3-4-5 upward impulse wave will be completely shattered. This would mean we are likely just part of a larger-degree corrective wave (A-B-C), potentially heading towards the deeper abyss of wave (E)—a destination far lower than the market currently imagines.
Meanwhile, the Volume Profile Fixed Range (VPFR) indicator reveals a brutal reality: there is massive volume accumulation (Point of Control area, shown as cyan and pink bars on the chart) between $1,500 and $2,000. This means the area below $2,000 is not an empty void but a “catch net” laid out by institutions. Those retail investors panic-selling at $2,000 are likely providing valuable liquidity for the whales.
The weekly MA Ribbon (8/14/20/26/32/38/44/50/60 EMA) is currently in a full bearish alignment, with the shortest EMA at the bottom and the longest EMA at the top (around $2,951), forming a downward-sloping “death waterfall.” This tells us the intermediate-term trend remains decisively bearish, and any bounce is merely a temporary respite within the downtrend.
The weekly MACD reads -111.4 / -288.3, still deep below the zero line, but the histogram shows a slight narrowing, suggesting that bearish momentum is marginally weakening. This is an early signal worth monitoring, but far from sufficient to confirm a reversal.
Weekly Timeframe for ETH (Ethereum)
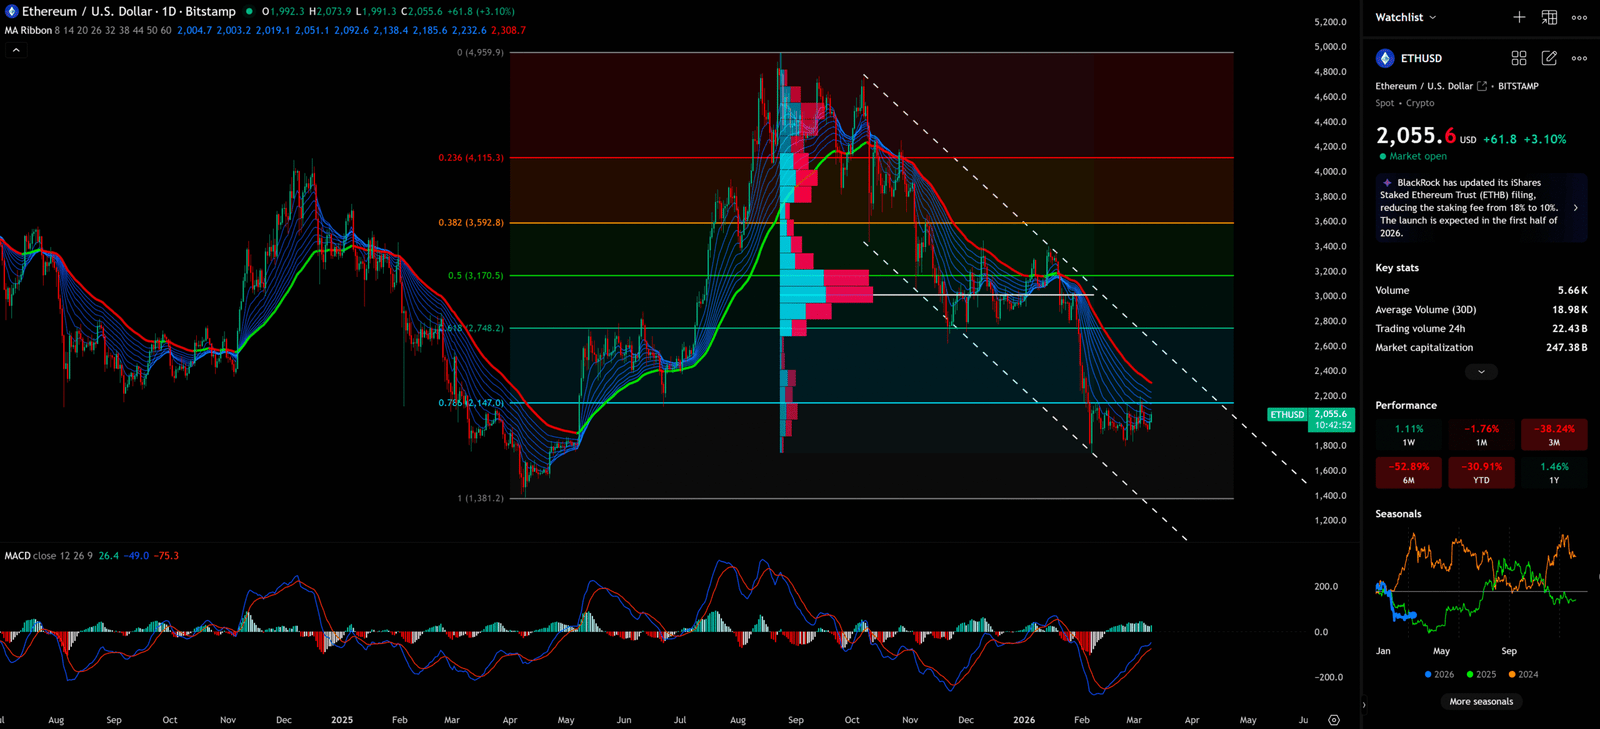
📈 Daily & Monthly Charts: The Ruthless Judgment of Fibonacci and MACD Divergence
Zooming into the Daily Chart, the situation remains grim, but some noteworthy technical signals are beginning to emerge.
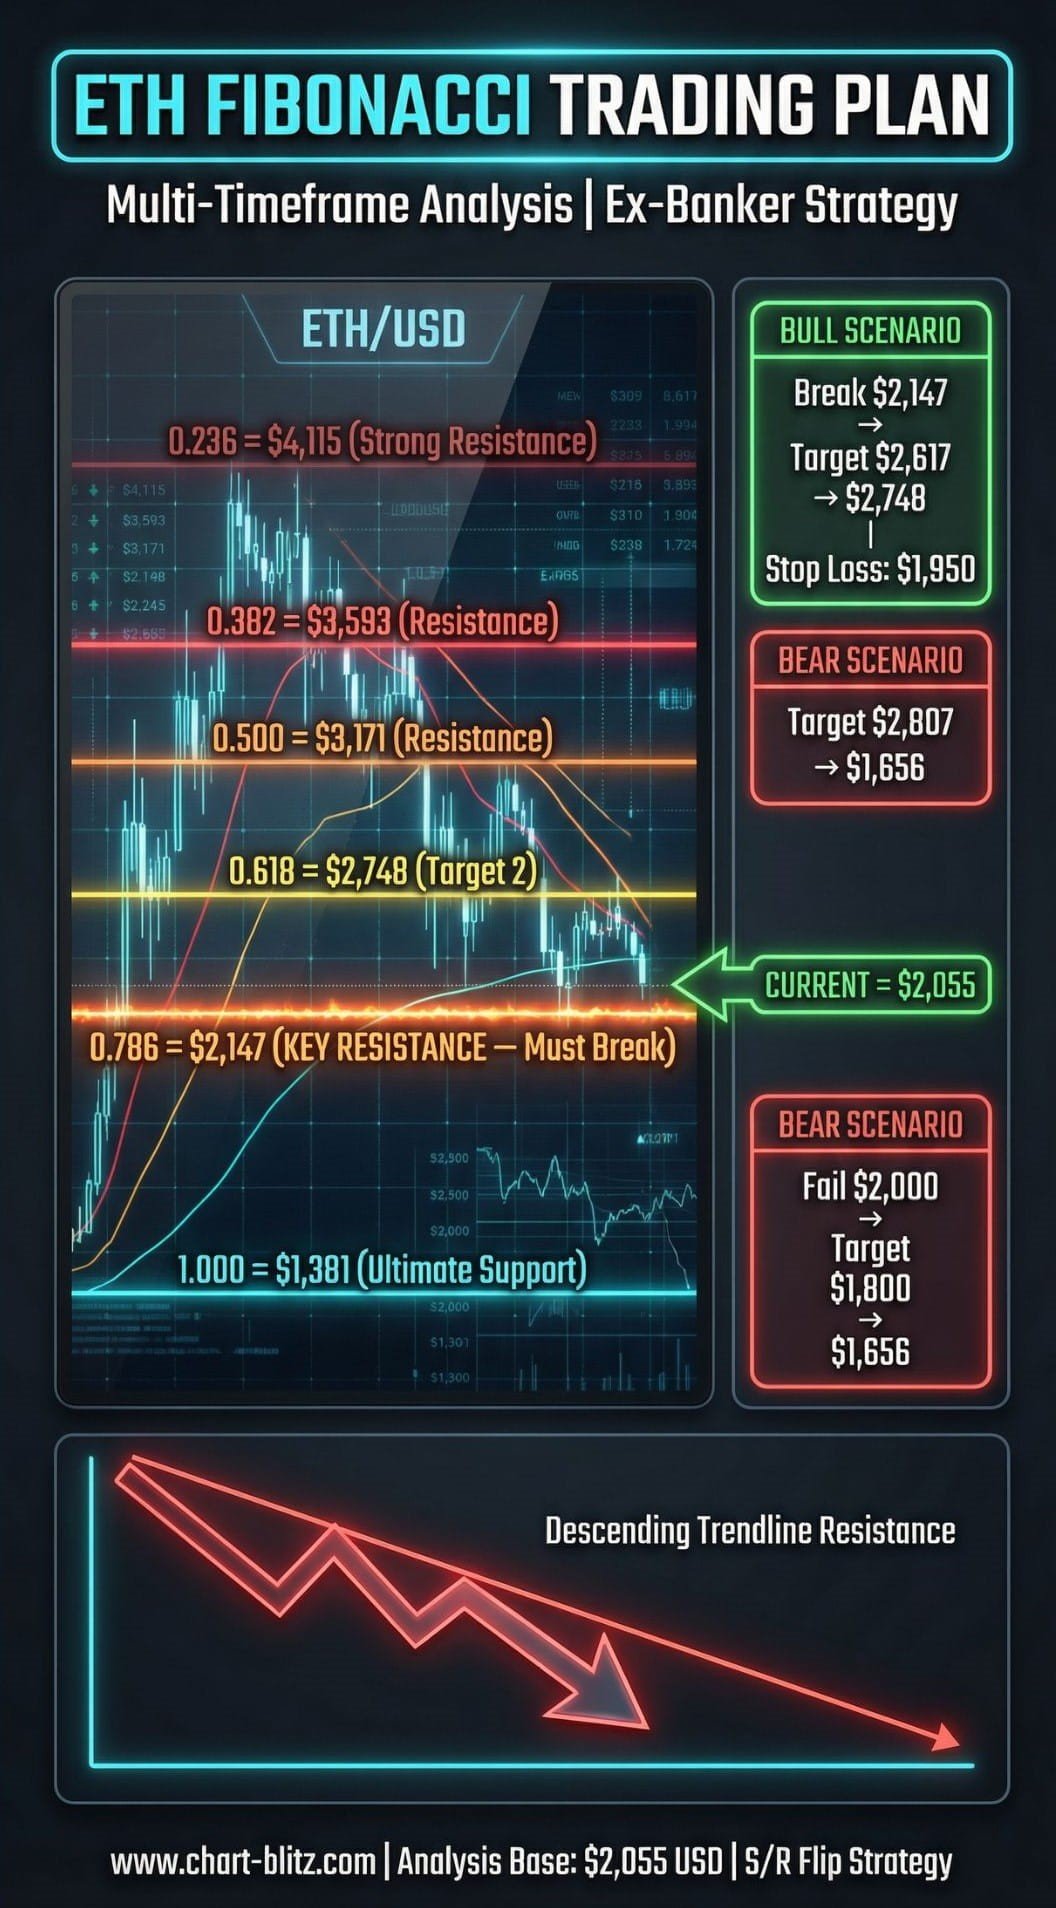
The Fibonacci Retracement drawn from the high of $4,959.9 to the low of $1,381.2 acts like a precision ruler, measuring every ETH bounce. Here is the strategic significance of each key Fibonacci level:
| Fibonacci Level | Price | Technical Significance |
| 0.236 | $4,115.3 | Strong Resistance (Bull Market Long-term Target) |
| 0.382 | $3,592.8 | Medium-term Resistance |
| 0.500 | $3,170.5 | 50% Retracement Resistance |
| 0.618 | $2,748.2 | Golden Ratio Resistance (Bull Market Near-term Target) |
| 0.786 | $2,147.0 | Current Most Critical Resistance (Must Break) |
| Current Price | $2,055 | Analysis Base |
| 1.000 | $1,381.2 | Ultimate Bottom Support |
Currently, the ETH price is heavily suppressed below the 0.786 Fibonacci retracement level ($2,147). This is a formidable barrier. Simultaneously, a descending trendline (shown as a white dashed line on the chart) extending from the highs hangs over ETH like the Sword of Damocles, currently sitting around $2,200.
The daily MA Ribbon remains in a bearish alignment, but the shortest EMA ($2,004.7) has begun to curl upward, indicating improving short-term momentum. More importantly, the daily MACD has quietly displayed a critical technical signal: Bullish Divergence—price made a lower low near $1,800, but the MACD histogram did not make a corresponding lower low. This divergence between price and indicator is one of the most reliable reversal warning signals in technical analysis.
However, divergence is merely a “possible reversal” signal, not a “confirmed reversal” signal. Until $2,147 resistance is broken, any long position remains a high-risk, left-side trade.
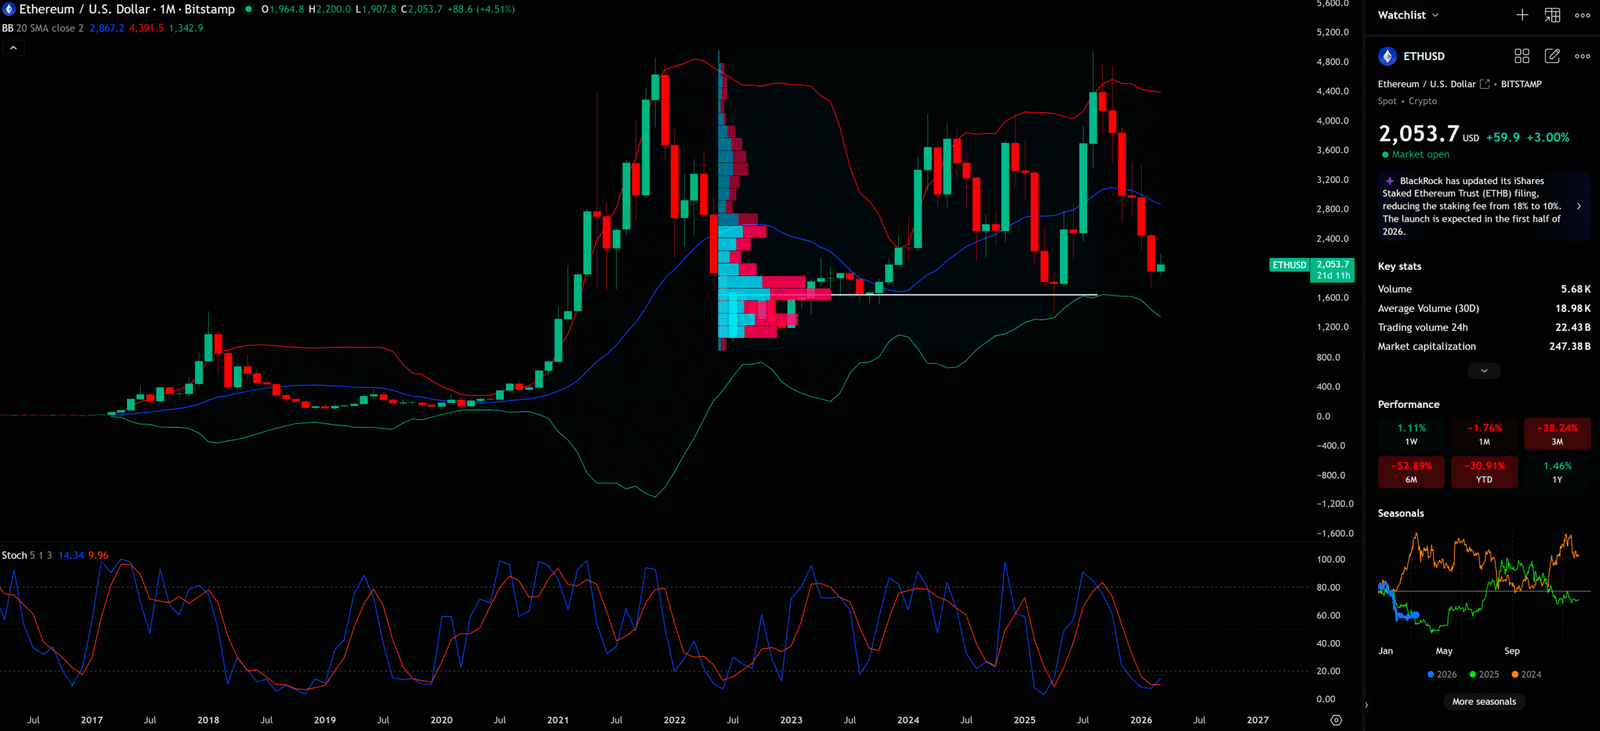
Looking at the Monthly Chart, the Bollinger Bands provide a macro boundary. ETH is currently struggling below the middle band ($2,867.2), approaching the lower band ($1,342.9). The Stochastic Oscillator (5,1,3) has plunged deep into oversold territory (K=14.34, D=9.96) and is showing faint signs of a bullish crossover. From a macro-cycle perspective, ETH’s downward momentum is exhausting, and an epic rebound is brewing.
Daily Timeframe for ETH (Ethereum)
Monthly Timeframe for ETH (Ethereum)
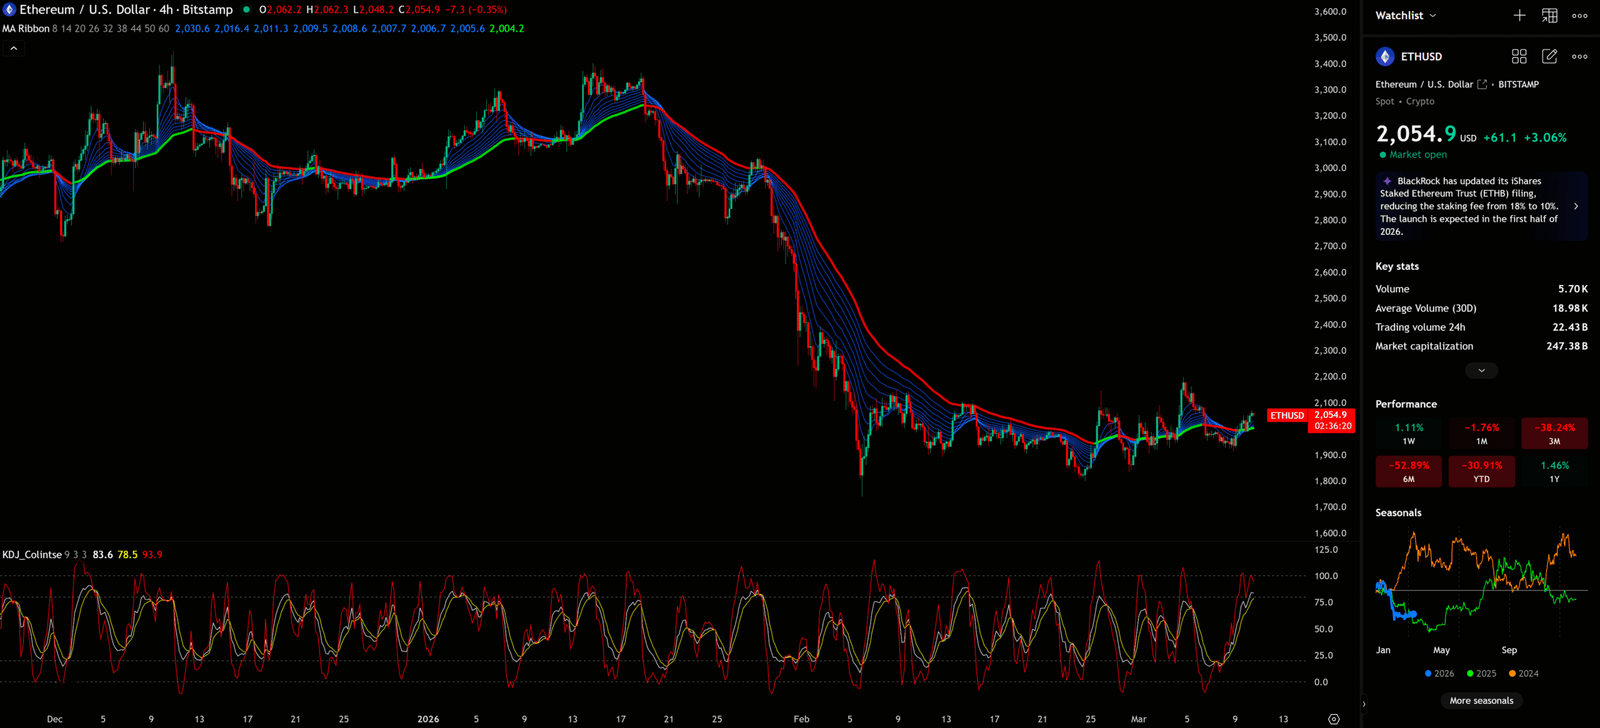
⏱️ 4-Hour Chart: The Turning Point in Close-Quarters Combat
On the short-term battlefield of the 4-Hour Chart, we finally see a glimmer of hope—but it comes with a clear risk warning.
The MA Ribbon has begun to narrow and is showing signs of flipping from a bearish to a bullish alignment, with short-term EMAs crossing above long-term EMAs. The ETH price has forcefully broken above this moving average cluster, indicating strong short-term momentum.
However, the KDJ indicator (9,3,3) readings are alarming: K=83.6, D=78.5, J=93.9—all three lines have entered severe overbought territory (above the 80 threshold). This is a clear warning signal: chasing the pump in the short term carries immense risk. Whales could execute a shakeout at any moment to flush out weak hands.
4-Hour Timeframe for ETH (Ethereum)
🎯 Ex-Banker’s Trading Plan: S/R Flips and the Art of War
Synthesizing this deep, multi-timeframe analysis, we have formulated the following ruthless trading plan for ETH. The core logic of this plan is the S/R Flip (Support and Resistance Flip)—the most frequently used tool in a professional bank trader’s arsenal:
Theoretically, the ETH downtrend should not be over yet, but if the ETH price does not continue to fall but instead turns upwards and explodes, it needs to be seen whether it can rise to the $2,147-$2,200 resistance zone. If it breaks above and holds, then enter the market; otherwise, it will reach the stop loss and sell off.
We don’t predict; we react. Here are the two specific operational scenarios:
Scenario 1: Bullish Breakout (Right-side Entry, ~40% Probability)
Entry condition: ETH daily close breaks and holds above $2,147 (0.786 Fib) and the descending trendline. Enter in tranches between $2,150-$2,200 after confirmation. Target 1 is the top of weekly wave (1) at $2,617. Target 2 is $2,748 (0.618 Fib). Stop loss is strictly set at $1,950 (below the $2,000 psychological level). Risk-reward ratio is approximately 1:2.5 to 1:3.5—a quality trade setup.
Scenario 2: Bearish Continuation (Patient Waiting, ~60% Probability)
Trigger: $2,000 level is lost again and price falls back below $1,900. Be patient and do not blindly buy the dip. Downside Target 1 is $1,800 (recent low). Downside Target 2 is $1,656.6 (the weekly lifeline). If a weekly reversal signal (such as a Doji or Hammer candle) appears near $1,656.6, consider a small exploratory position with a stop loss at $1,550.
Re-entry Strategy After Stop Loss: If stopped out, do not be discouraged, and absolutely do not revenge trade. Wait for the market to provide a clear directional signal, then re-enter following the S/R Flip logic at the newly confirmed support level.
💡 The Ex-Banker’s Final Warning: News is the Bait, Charts are the Weapon
Do not be blinded by news of BlackRock cutting ETF fees or easing geopolitical tensions. These headlines are merely smoke bombs released by whales to match the chart’s trajectory.
Consider this: ETH is down 33% year-to-date, underperforming BTC by more than 10 percentage points. This persistent relative weakness is no accident. Against the backdrop of a fully bearish weekly MA Ribbon and MACD deep in negative territory, no single piece of positive news is sufficient to change the trend.
While you are reading the news, whales are reading the charts. While you are hesitating, whales have already completed their setup. The true value of technical analysis is not in predicting the future, but in maintaining calm judgment amidst the market’s noise.
Charts don’t lie, but you have to learn their language.
I will continue to closely monitor the price action of this crypto. Once I spot a critical reversal signal on the charts, I will update my analysis and views right here immediately. Remember to bookmark this page and check back for the latest updates!
Want to see our full, interactive chart breakdown? If you want to learn how to draw Fibonacci Retracement Ratio yourself, identify S/R Flips, and stop trading blind. Please browse the following『Further Reading』links. Fundamental news tells you what happened. Technical analysis predicts what will happen. To master the professional framework that separates market signal from noise, explore our exclusive models at www.chart-blitz.com.
Further Reading:
- Complete Guide to Fibonacci Retracement — How to use the golden ratio to find the most precise entry points
- Elliott Wave Theory for Beginners — Iron rules of wave theory and practical applications
- Volume Profile (VPFR) Tutorial — Using volume distribution charts to identify whale setups
【Disclaimer】 The content herein is for educational purposes and reflects the author’s personal opinion only; it is not investment advice. All financial investments, including cryptocurrencies, carry significant risk, and you could lose your entire capital. To support this site, this article may contain affiliate links. While we strive for accuracy, we cannot guarantee all information is complete or error-free. Please conduct your own research and be fully responsible for your own investment decisions.