The trend is your friend, except at the end where it bends
Jesse Livermore – 1923
While Bitcoin’s recent price action appears robust, a critical divergence in Ethereum’s performance suggests the current market rally may be deceptive. This growing gap between the top two cryptocurrencies warrants a deeper look into the market’s underlying health.
Top Stories at a Glance
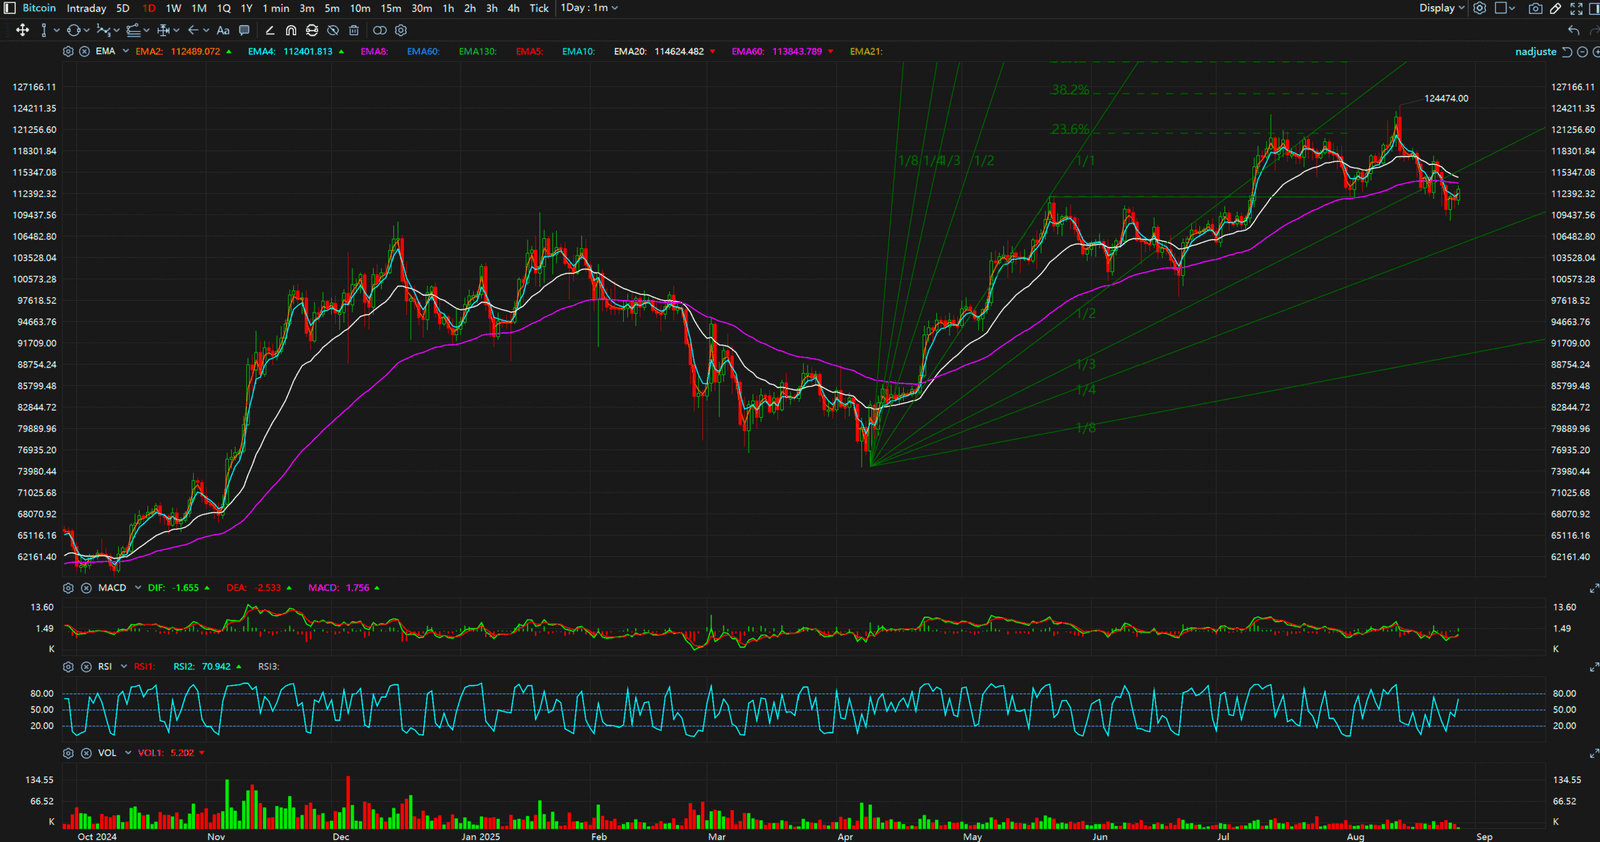
The Bull Case / The Obvious Story: Bitcoin is demonstrating a clear bullish market structure, establishing what appears to be a pattern of ‘higher highs and higher lows.’ The price has confidently broken above former resistance levels and is currently holding strong above the key psychological level of $113,000, fueling optimistic sentiment across the market.
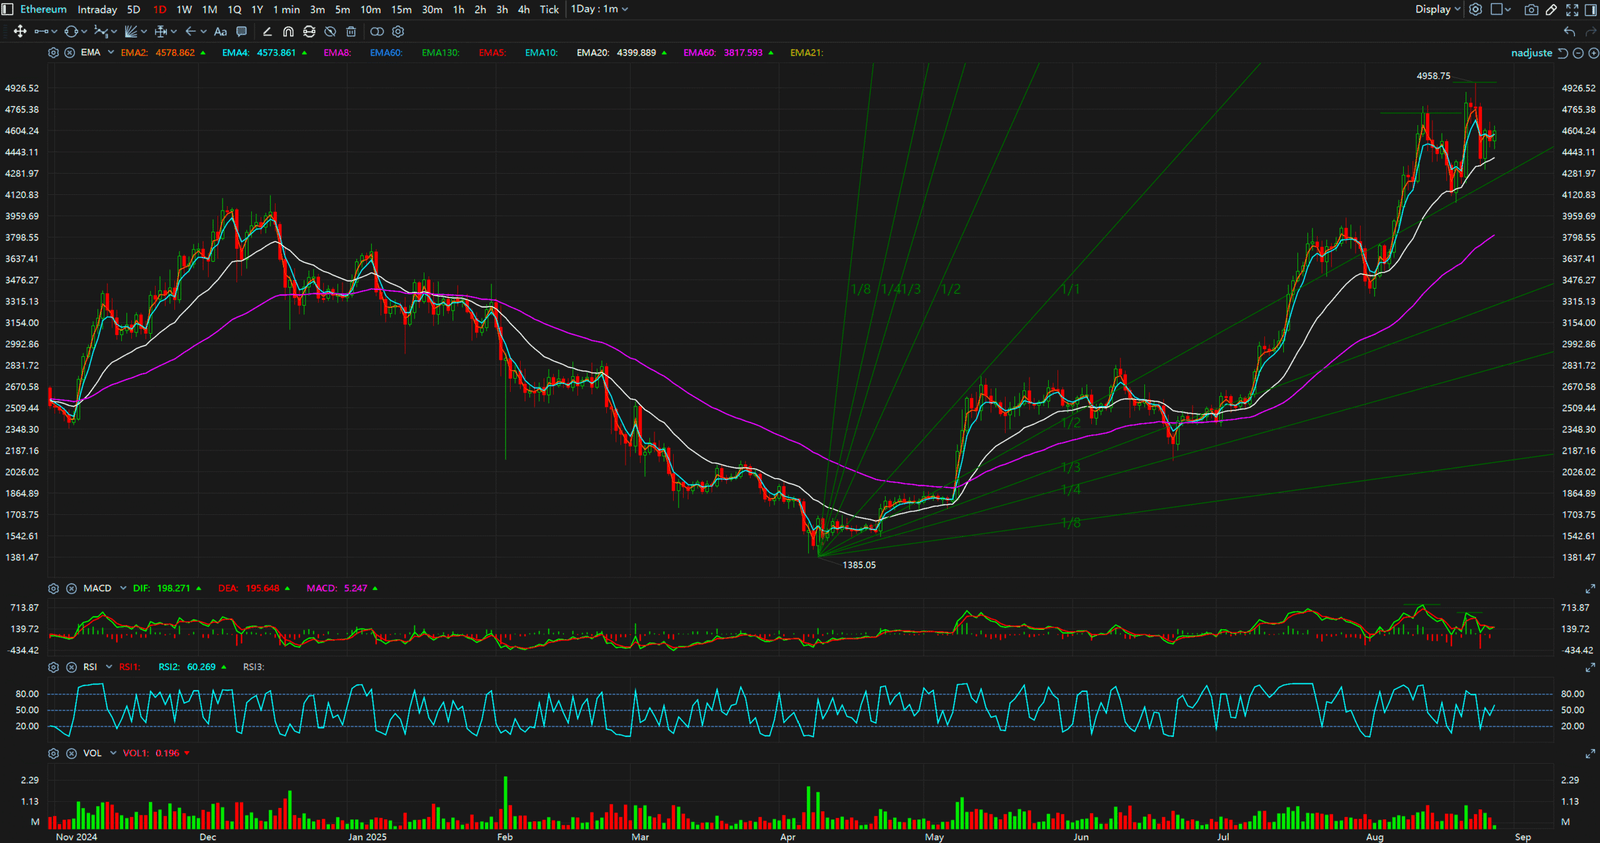
The Bear Case / The Hidden Signal: However, a closer examination of Ethereum’s charts reveals a concerning signal: a classic Bearish Divergence. While Bitcoin is forging new highs, ETH has failed to follow suit, showing a slight decline of -0.19% over the past 24 hours. This divergence, where the market leader’s strength is not confirmed by major altcoins, is often a precursor to a broader market correction, signaling weakening momentum and investor hesitation.
Synthesis & Implication: This conflict between Bitcoin’s ascent and Ethereum’s stagnation implies that the current rally may be narrower than it appears. For traders, this is a critical warning sign. It suggests that “smart money” may be taking profits on altcoins while retail investors chase Bitcoin’s upward trend, a scenario that could lead to a sudden reversal if Bitcoin’s momentum falters.


Key Takeaways
In summary, the market presents a conflicting picture. While Bitcoin’s trajectory is positive, the bearish divergence shown by Ethereum cannot be ignored. Traders should exercise caution. Key levels to watch for Bitcoin are support at $110,000 and resistance at $115,000. A break below this support could confirm the bearish signal from Ethereum and trigger a wider market downturn.
For continuous, real-time analysis of these developing market structures, visit www.chart-blitz.com.
True trading advantage comes from interpreting these conflicting technical signals. To learn how to apply a professional-grade analytical framework to decode the market’s real intentions, visit www.chart-blitz.com to explore our exclusive chart breakdowns and models.
Sources:
- https://www.barrons.com/articles/bitcoin-price-ethereum-xrp-crypto-dcda7348
- https://www.tradingview.com/symbols/ETHBTC/
- https://www.ccn.com/analysis/crypto/bitcoin-dominance-ethereum-reversal/
Unlocking Technical Analysis: Power Moves with Diagrams
Daily Timeframe for BTC
Daily Timeframe for ETH