The speculator’s chief enemies are always boring from within. It is inseparable from human nature to hope and to fear
William Delbert Gann – 1949
While Solana (SOL) has been capturing headlines with its meteoric rise, a deeper look at the charts reveals potential signs of exhaustion that traders should not ignore. Conversely, Dogecoin (DOGE), which has been relatively quiet, is exhibiting a market structure that could be laying the groundwork for a significant move. This divergence between the high-flying leader and the lagging memecoin presents a critical conflict in the current market landscape.
Top Stories at a Glance
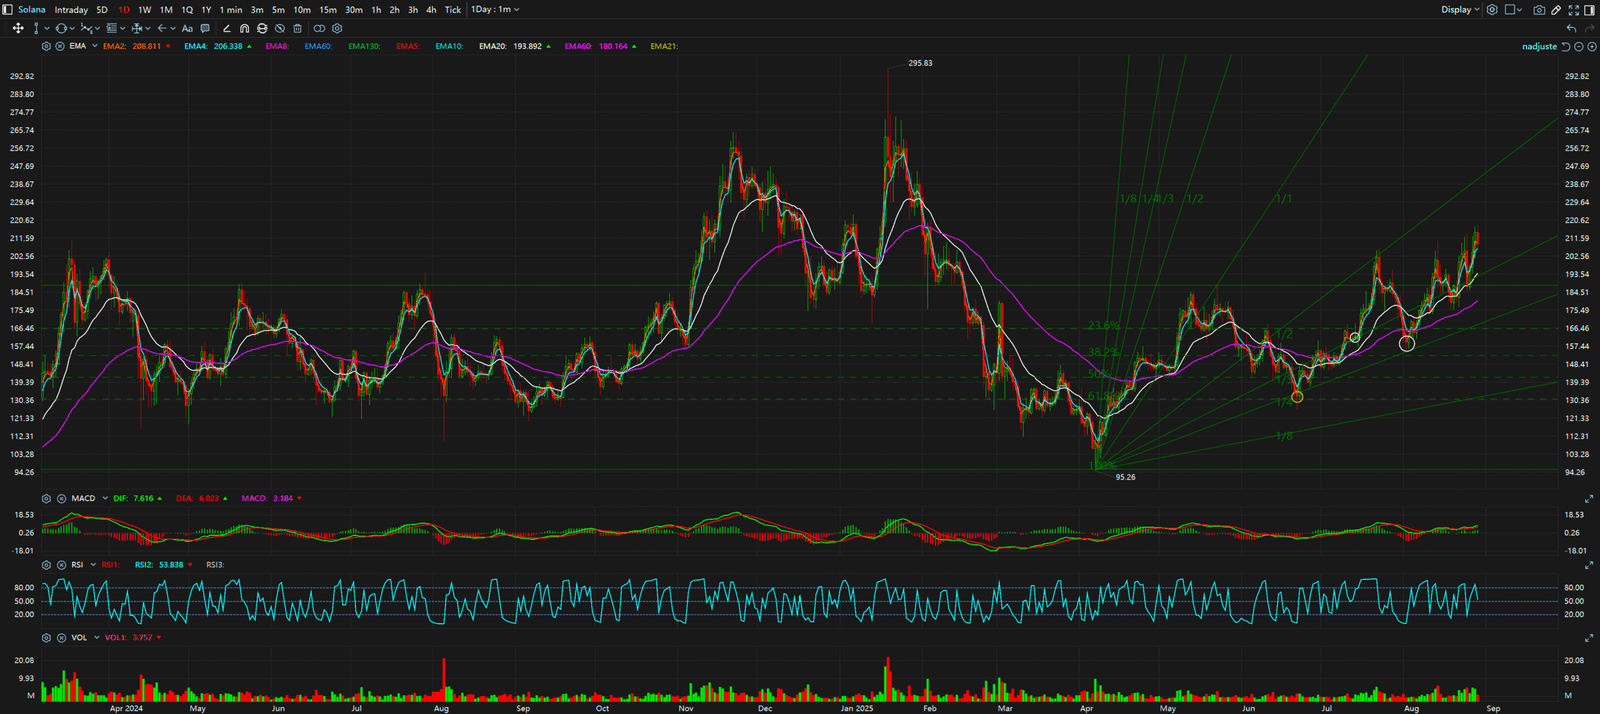
The Bull Case / The Obvious Story: Solana has been in a powerful uptrend, consistently printing higher highs and higher lows, breaking past previous resistance levels with significant volume. The narrative surrounding its ecosystem growth and high-performance blockchain has fueled this rally, drawing in immense retail and institutional interest. The price action, on the surface, looks incredibly bullish, suggesting that the path of least resistance is to the upside.
The Bear Case / The Hidden Signal: However, a closer inspection of the SOL/USD 4-hour chart reveals a potential MACD Bearish Divergence (頂背馳). While the price has recently pushed to a new high, the MACD histogram has failed to follow suit, printing a lower high. This is a classic technical warning sign that the upward momentum is waning, and the risk of a price correction is increasing. This divergence suggests that “smart money” might be taking profits while the masses are still chasing the rally.
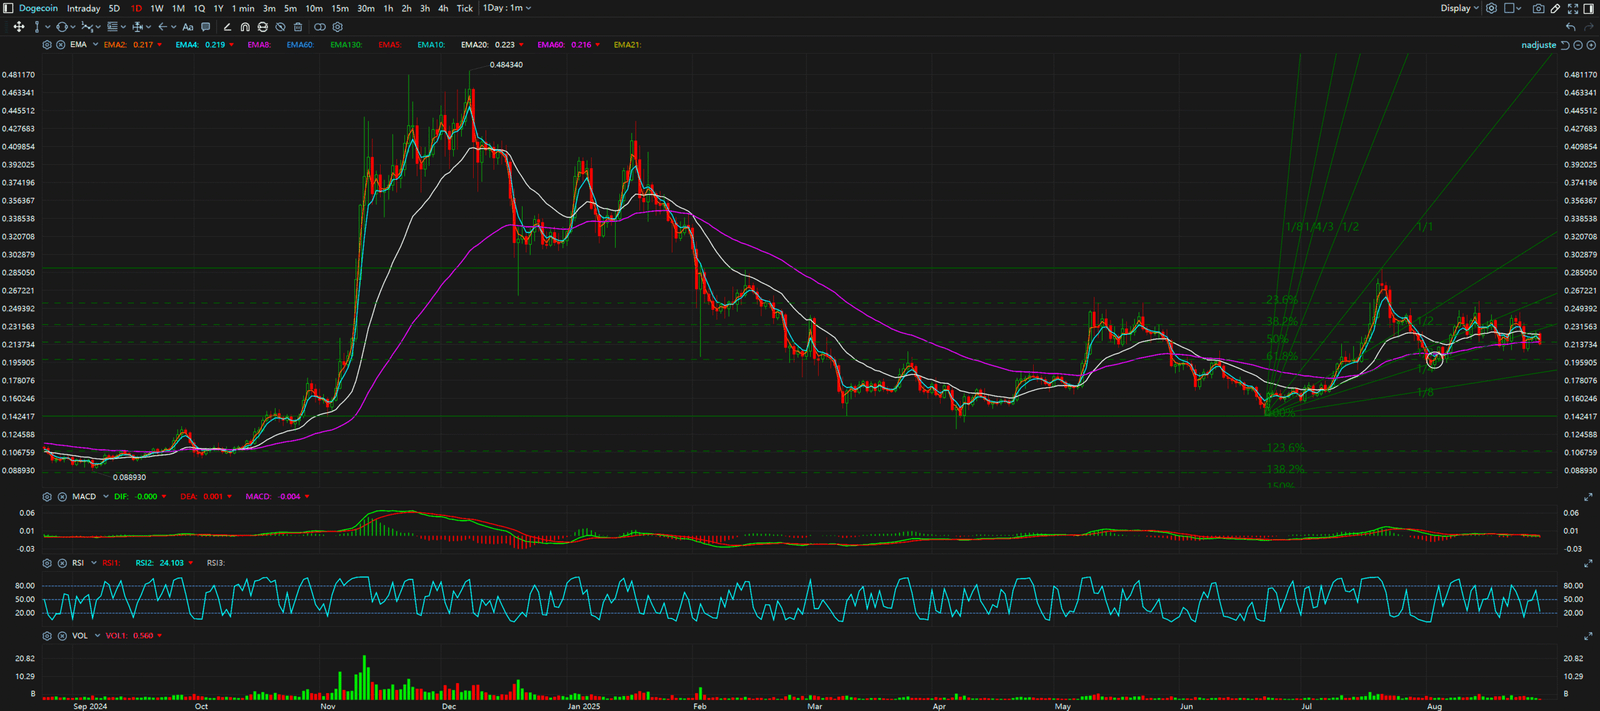
Synthesis & Implication: This conflict between Solana’s bullish price action and its underlying bearish momentum divergence is significant. It implies that the SOL rally could be deceptive and vulnerable to a sharp pullback. Meanwhile, Dogecoin’s price has been consolidating within a defined range, building a stable base. While it lacks the explosive momentum of Solana, its market structure is less volatile and could be coiling up for a potential breakout. For traders, this means that chasing the SOL rally at these levels carries a heightened risk, while DOGE might present a more favorable risk/reward opportunity if it can break out of its consolidation phase.


Key Takeaways
In conclusion, the crypto market is presenting a fascinating divergence between Solana and Dogecoin. While SOL’s rally is impressive, the bearish divergence on the MACD indicator is a major red flag. Key resistance for SOL is now at its recent highs, with support around the $200 level. For Dogecoin, the key resistance is at the top of its consolidation range (around $0.24), with support at the bottom of the range (around $0.22). A decisive break of these levels will likely determine the next major move for both assets.
For continuous, real-time analysis of these developing market structures, visit www.chart-blitz.com.
True trading advantage comes from decoding these conflicting signals. To learn the professional-grade framework for seeing the market’s real intentions, explore our exclusive models on www.chart-blitz.com.
Sources:
- https://www.tradingview.com/symbols/DOGESOLUSD/technicals/
- https://www.mitrade.com/insights/news/live-news/article-3-1066249-20250825
- https://cryptorank.io/news/feed/0b550-solana-dogecoin-2024-price-prediction-analysis
- https://www.tribuneindia.com/partner-exclusives/dogecoin-and-solana-see-price-pullback-amid-growing-interest-in-layer-bretts-staking-features/
Unlocking Technical Analysis: Power Moves with Diagrams
Daily Timeframe for SOL
Daily Timeframe for Doge