The big money is not in the individual fluctuations, but in the main movements. That is, not in reading the tape but in sizing up the entire market and its trend.
Jesse Livermore – 1923
Here we go again. The financial media and Wall Street analysts are once again singing the praises of Waste Management’s (WM) “green initiatives” and “stable cash flow.” 😴 They tell you WM has an “economic moat,” that it’s a “defensive asset,” your “safe harbor” in a volatile market. Sounds appealing, doesn’t it? Like a warm, safe blanket. But have you ever stopped to think whether this “good news” is genuine insight or just breadcrumbs laid out to lead you down a predetermined path? While the entire market is applauding WM’s latest ESG report 🤦, the real Navigators saw the next move on the charts weeks ago. While the sheep are busy looking at the rearview mirror, we’re already reading the map of the road ahead.
The “Official Story”: A Fundamentalist’s Paradise
The “Official Story” The “Official Story” that Wall Street wants you to believe is a meticulously crafted script. They’ll tell you the North American waste management market is a colossal industry worth over $100 billion, a market poised for steady expansion thanks to population growth and increasingly stringent environmental regulations. According to projections from Grand View Research, the U.S. market alone could reach $129 billion by 2030. In this script, there are three main characters:
👑 The Leader: Waste Management, Inc. (WM)
- Core Advantage: WM possesses the largest network of landfills in North America. These aren’t just piles of trash; they are cash-printing machines. Owning a landfill is like owning a toll road; every truck that passes through must pay. With over 260 landfills, WM has built a physical moat that is nearly impossible for competitors to replicate. Their vertically integrated model—from collection and transfer to final disposal—gives them control over the entire value chain, naturally leading to superior profit margins. Their 2023 financial statements boast annual revenues exceeding $20 billion and free cash flow approaching $3 billion. These are the numbers Wall Street loves to parade.
- Achilles’ Heel: WM’s immense size makes its growth slow and cumbersome. Its core business is heavily dependent on macroeconomic activity. When the economy is booming, industrial waste volumes are high, and WM profits. When the economy slows, construction debris and commercial waste decrease, and WM’s revenue takes an immediate hit. Furthermore, the company is highly sensitive to fuel prices. Every fluctuation in oil prices directly impacts the operating costs of its tens of thousands of collection vehicles. These are the risks typically buried in the fine print of the “Official Story.”
⚔️ The Challenger: Republic Services, Inc. (RSG)
- Core Advantage: If WM is the industry behemoth, RSG is the more agile, more focused boxer. RSG is number two in market share, but its recent strategy has been noticeably more aggressive. They focus on acquiring smaller waste management companies in high-growth regions like the U.S. Sun Belt, gobbling up market share like Pac-Man. Concurrently, RSG’s investments in recycling technology and renewable energy (such as electricity generation from landfill gas) have been earlier and more aggressive than WM’s, often earning them higher ESG scores and attracting a flock of so-called “socially responsible investors.”
- Achilles’ Heel: RSG’s lifeblood is acquisitions. Its growth story is largely built on a foundation of continuous M&A. If the credit market tightens, financing costs rise, or quality acquisition targets become scarce, RSG’s growth engine will immediately stall. Their heavy reliance on a single market (the U.S.) leaves them less geographically diversified than WM, making them fatally vulnerable to any significant shifts in domestic regulations.
🐘 The Old Guard: Waste Connections, Inc. (WCN)
- Core Advantage: WCN plays a completely different game. They don’t go head-to-head with WM and RSG in major metropolitan areas like New York or Los Angeles. Instead, they focus on “exclusive markets” in secondary cities and rural areas. In these locations, they are often the sole service provider, granting them immense pricing power. This “surround the cities from the countryside” strategy often results in the highest profit margins in the industry. Their customer base is highly fragmented, loyal, and generates incredibly stable cash flow.
- Achilles’ Heel: WCN’s growth ceiling is palpable. Rural markets are stable but limited in scale. In their quest for growth, they have recently ventured into more specialized but highly cyclical sectors like oilfield waste services. This business can be a goldmine when oil prices are high, but it can turn into a massive financial black hole during a downturn, dragging down their stable core operations.
This “Official Story” sounds comprehensive and logical, doesn’t it? It gives you a macro blueprint, three protagonists, each with their pros and cons. You feel like you’ve grasped the whole picture. But…
The Critical Twist: The Chart is the Only Truth
You spend dozens of hours studying financial reports, analyzing market share, and listening to analyst conference calls… and for what? You get a pile of lagging data, a collection of information that Wall Street wants you to see. This is all the “rearview mirror.” By the time you see in the rearview mirror that WM’s earnings beat expectations, the smart money may have already positioned itself months earlier, when the stock price formed a perfect double bottom at a key support level. By the time the news tells you RSG successfully acquired a smaller company and is poised for major growth, the volume on the chart may have already told you that insiders, through several instances of unusual volume spikes, had already taken their first bite long before the announcement.
This is the difference between “breadcrumbs” and a “map.” Fundamental analysis is the trail of breadcrumbs that the big players sprinkle in the forest. They want you to follow the crumbs, happily picking them up, thinking you’ve found the path. In reality, you’re just following their preset route, and the destination is often the cliff where they plan to offload their shares. Technical analysis, on the other hand, is having the satellite map of the entire forest. You don’t need the breadcrumbs. You only need to see the “footprints” of capital flow—the path formed by candlesticks, volume, trendlines, and moving averages. These footprints don’t lie.
Consider this thought experiment: Scenario A (The Fundamental Believer): In early 2024, you read news about a potential economic slowdown and rising oil prices. You conclude this is bad for a heavy-asset company like WM, so you decide to wait or even sell. As a result, WM’s stock price pulls back to its 200-day moving average, finds strong support, and then proceeds to break out and hit new all-time highs in the following months. By the time you read the Q1 report saying “costs were well-managed, and earnings beat expectations,” the stock is already up 20%. You missed everything. Scenario B (The Technical Navigator): In early 2024, you see WM’s price pulling back, but you notice that volume is consistently shrinking on the way down, indicating it’s just retail panic-selling, not institutional distribution. When the price touches the 200-day moving average, widely regarded as the long-term bull/bear line, you spot a “hammer” candlestick with a long lower wick, confirmed by a high-volume green candle the next day—a powerful reversal signal. You don’t need to read any news. You establish your position right there. Your entry point is a full three months earlier and 20% cheaper than the Fundamental Believer who waited for the “good news.” It’s crystal clear who is the sheep and who is the Navigator.


Conclusion: Stop Being the Sheep. Learn to Read the Map.
Stop being one of the market’s sheep, led astray by Wall Street’s “Official Story.” Financial statements are history, news is noise, and analyst reports are scripts. In this market, driven by capital and emotion, the only truth is on the chart. The chart is the market’s EKG, recording every inflow and outflow of capital. The chart is the footprint of the whales, revealing their true intentions.
Learning to read the chart isn’t an option; it’s the only skill for survival in this brutal arena. Do you want to keep following the breadcrumbs someone else left for you, walking towards an unknown destination? Or do you want to pick up the map, become a Navigator, and take control of your own financial destiny?
The choice is yours. Visit our website to learn the real rules of the game. Stop being a sheep who reads the news. Start becoming a Navigator who reads the map.
Sources:
- Grand View Research, U.S. Waste Management Market Size Report, 2023-2030
- Waste Management, Inc. 2023 Annual Report
- Republic Services, Inc. 2023 Annual Report
- Waste Connections, Inc. 2023 Annual Report
Unlocking Technical Analysis: Power Moves with Diagrams
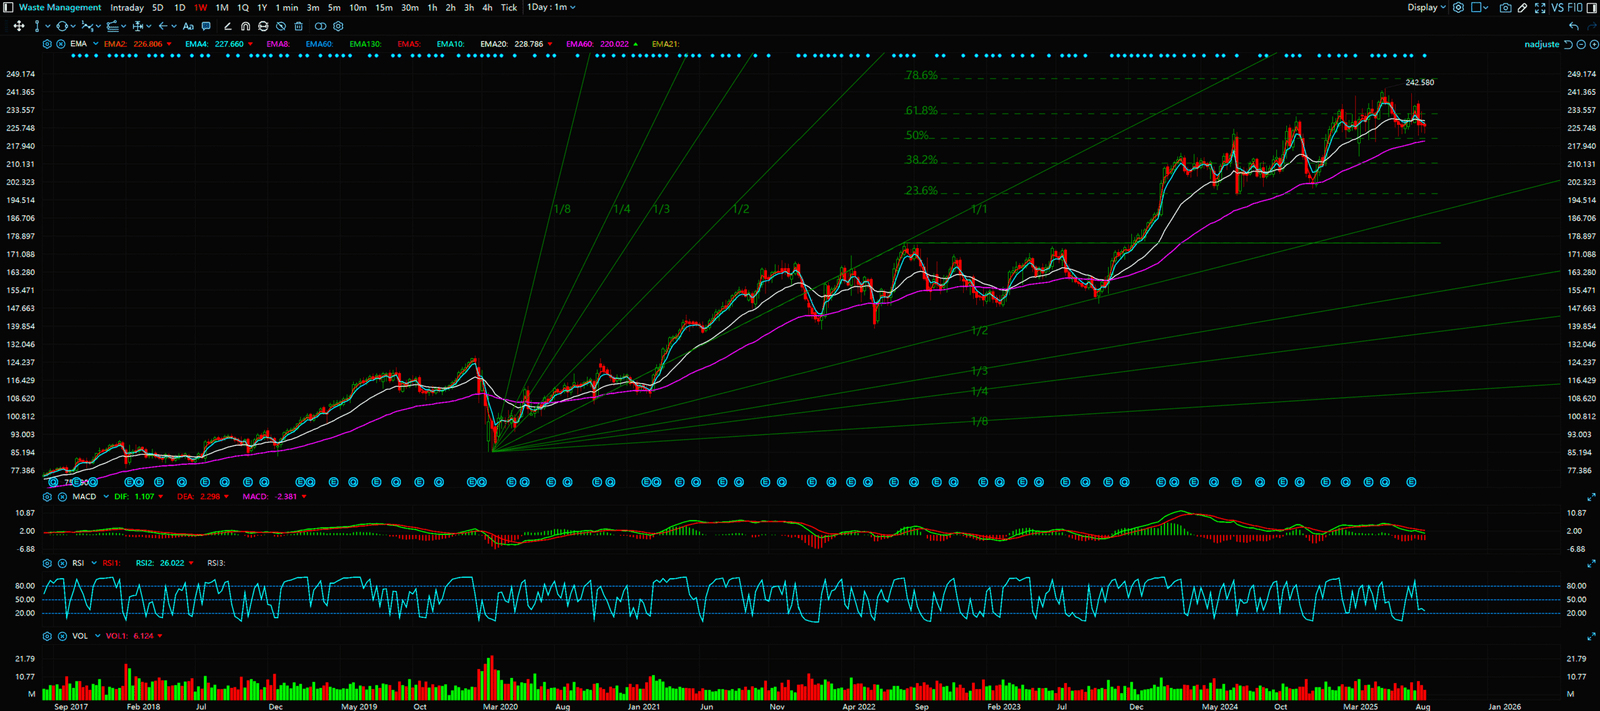
Weekly Timeframe (WM)
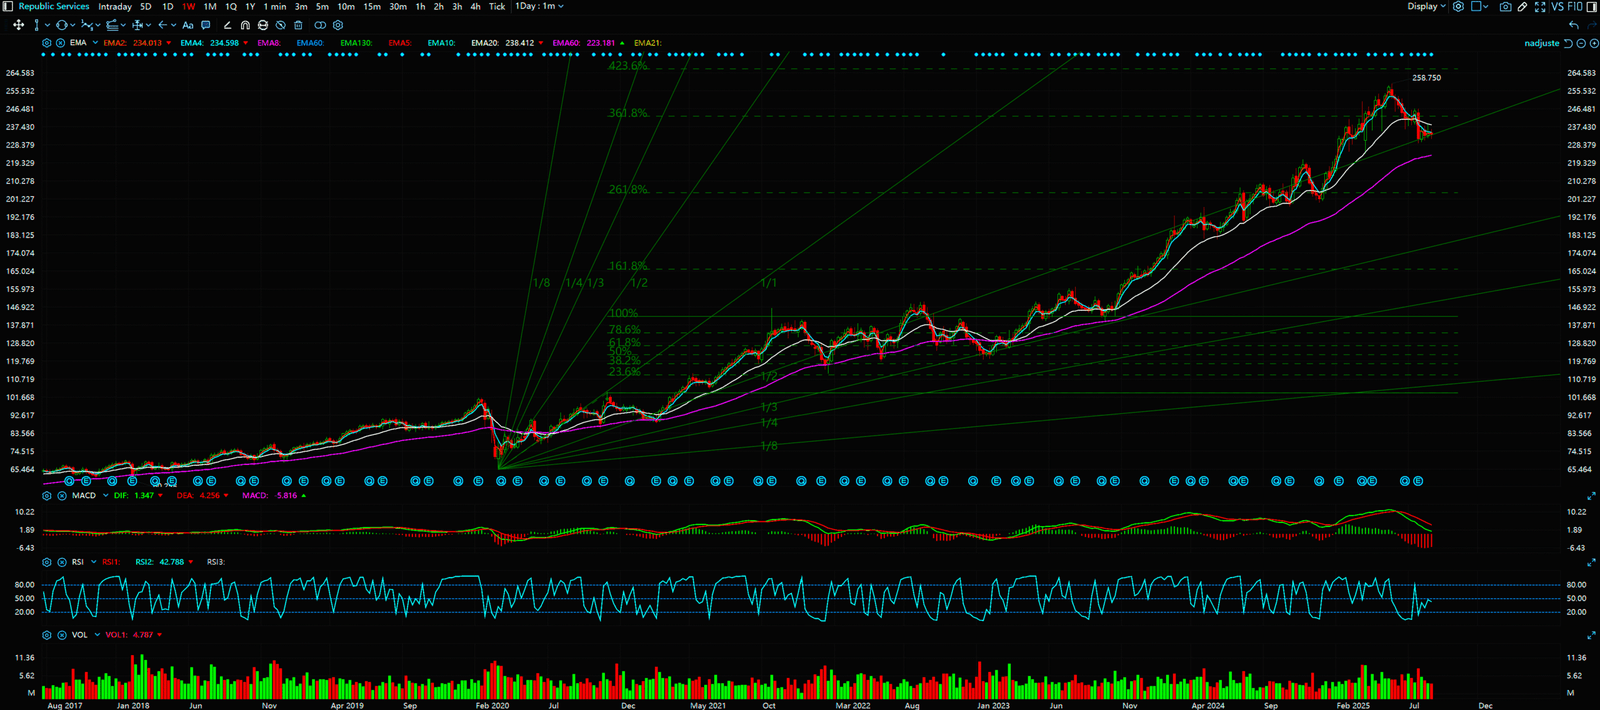
Weekly Timeframe (RSG)
Weekly Timeframe (WCN)