The speculator’s chief enemies are always boring from within. It is inseparable from human nature to hope and to fear
William Delbert Gann – 1949
While Bitcoin appears robust, maintaining its ground above a critical price threshold, a significant divergence in Ethereum’s price action suggests the market’s current stability may be deceptive. This growing gap between the market’s two largest assets warrants a deeper look.
Top Stories at a Glance
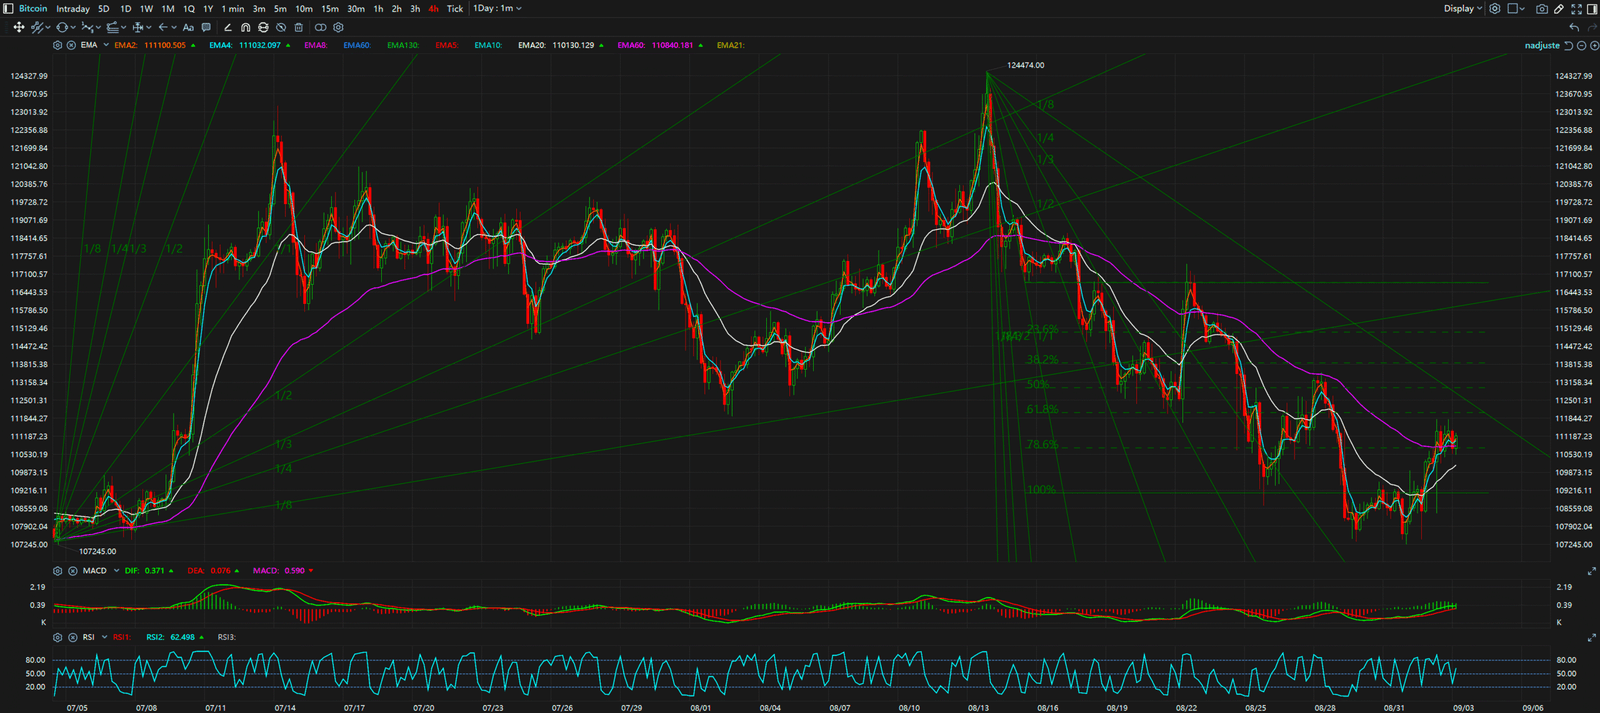
The Bull Case / The Obvious Story: Bitcoin is demonstrating considerable strength, holding a stable market structure above the key psychological level of $110,000. Its ability to absorb selling pressure and post a slight 24-hour gain indicates a resilient bull case, leading many to believe the broader market uptrend remains intact.
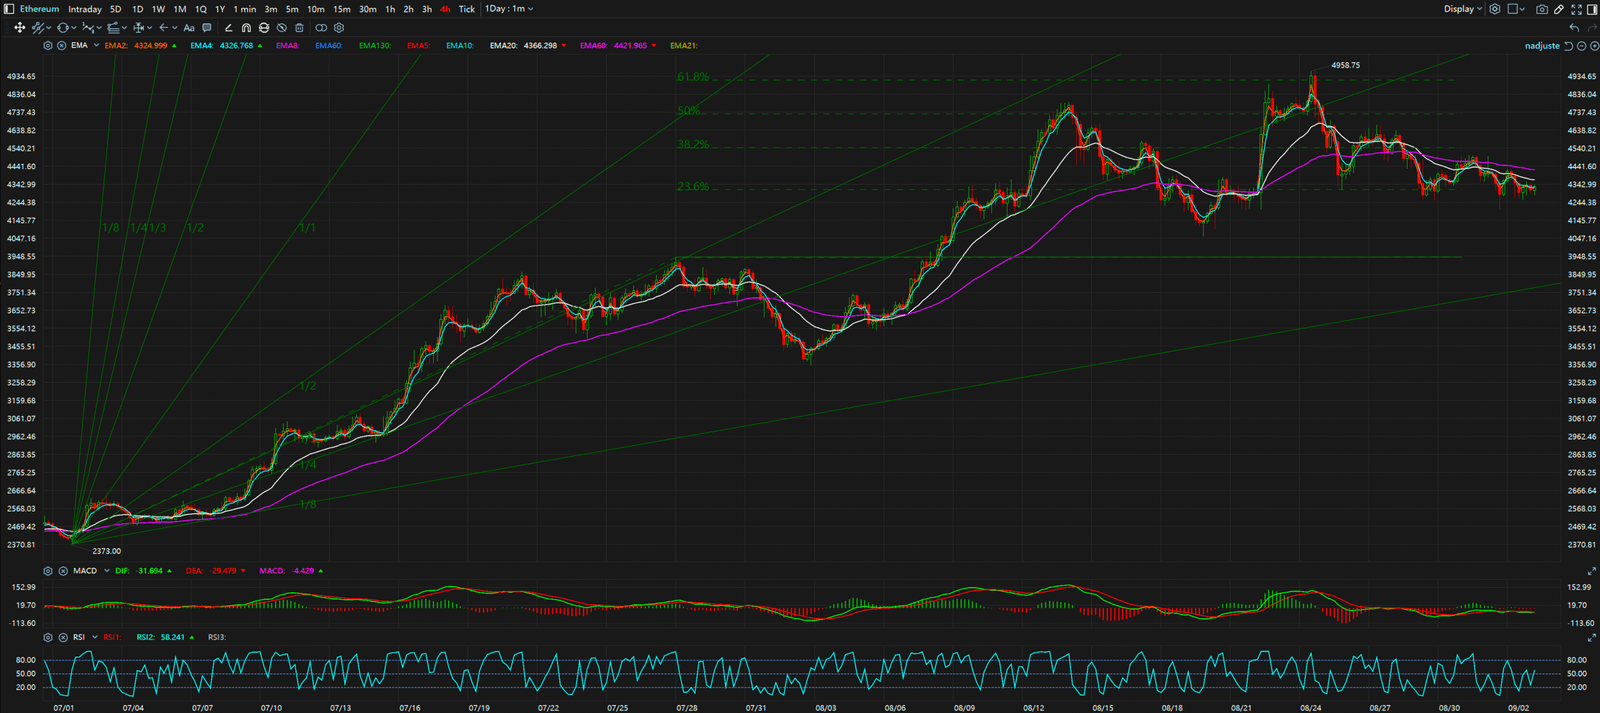
The Bear Case / The Hidden Signal: However, a look at Ethereum reveals a counter-narrative. The asset has posted a nearly 2% loss over the same 24-hour period. This price action divergence, where the market leader holds firm while a major altcoin falters, is a classic signal of weakening underlying momentum. It suggests that conviction is waning and the market could be vulnerable to a broader correction.
Synthesis & Implication: This conflict between BTC and ETH implies that the market is at a critical decision point. While BTC’s strength provides a floor for now, ETH’s weakness could be a leading indicator of a sentiment shift. Traders should be cautious, as the strength seen in Bitcoin may not be reflective of the entire market’s health.


Key Takeaways
In summary, the market presents a conflicted picture. Bitcoin’s stability is bullish, but Ethereum’s underperformance is a significant bearish divergence. The key levels to watch are support at $110,000 and resistance at $115,000 for Bitcoin, and support at $4,200 and resistance at $4,500 for Ethereum. A break of these levels could determine the market’s next major move.
For continuous, real-time analysis of these developing market structures, visit www.chart-blitz.com.
True trading advantage comes from decoding these conflicting signals. To learn the professional-grade framework for seeing the market’s real intentions, explore our exclusive models on www.chart-blitz.com.
Sources:
- https://www.coindesk.com/markets/2025/09/03/
- https://www.bloomberg.com/crypto
- https://www.reuters.com/technology/cryptocurrency/
Unlocking Technical Analysis: Power Moves with Diagrams
4-Hour Timeframe for Bitcoin
4-Hour Timeframe for Ethereum