The speculator’s chief enemies are always boring from within. It is inseparable from human nature to hope and to fear
William Delbert Gann – 1949
While Bitcoin’s price action has entered a period of quiet consolidation, a critical technical indicator on Ethereum’s chart is suggesting that the market’s apparent calm may be deceptive. This divergence between the market leader and its largest altcoin presents a crucial conflict for traders to decode.
Top Stories at a Glance
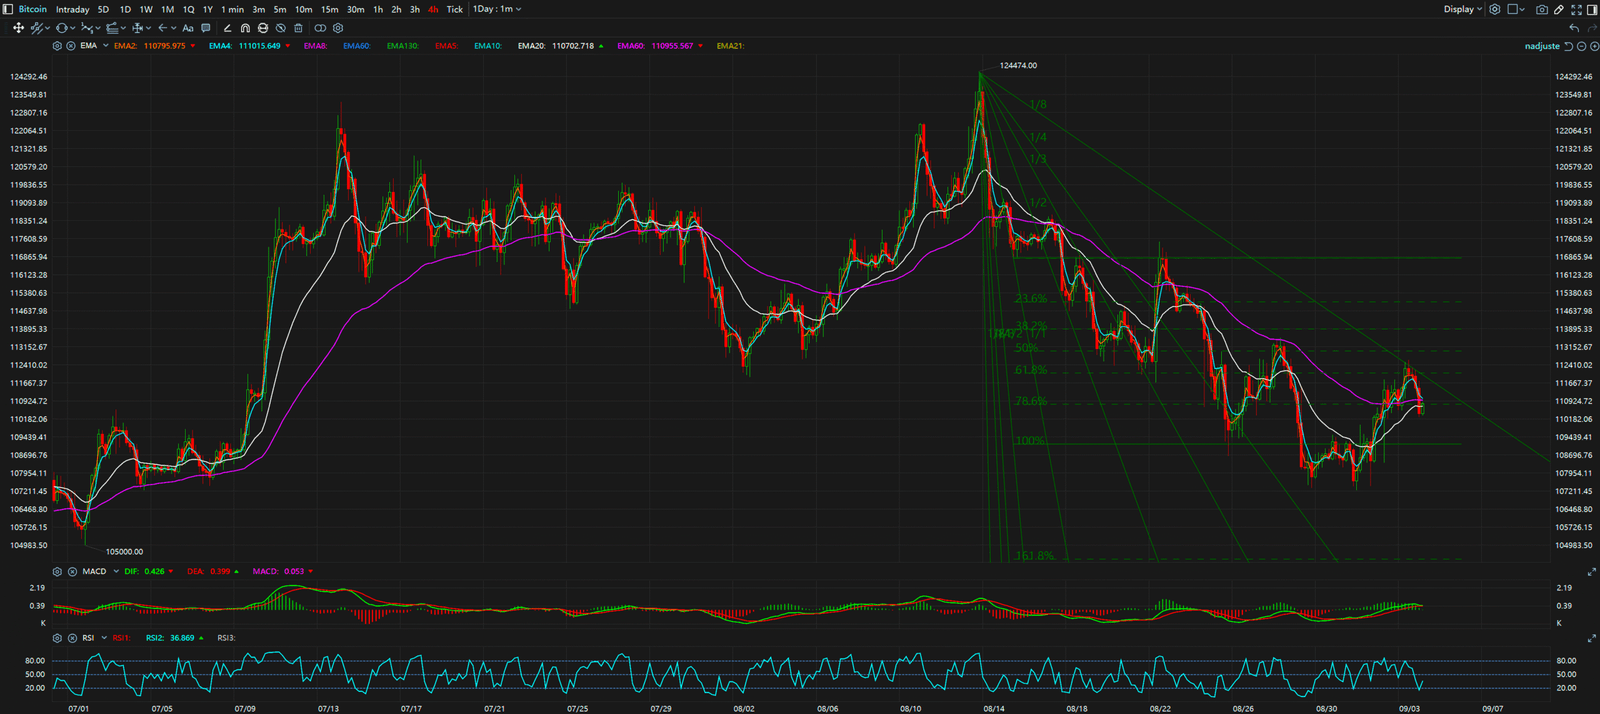
The Obvious Story: Bitcoin’s Consolidation Creates Uncertainty Bitcoin is currently maintaining a sideways market structure, hovering around the $110,985 mark with a minor 24-hour dip of -0.18%. This lack of clear direction from the market leader is causing many traders to pause, creating a sense of broad market uncertainty. In this context, Ethereum’s weaker 7-day performance compared to Bitcoin’s might suggest that altcoins are simply following the leader into a period of stagnation.
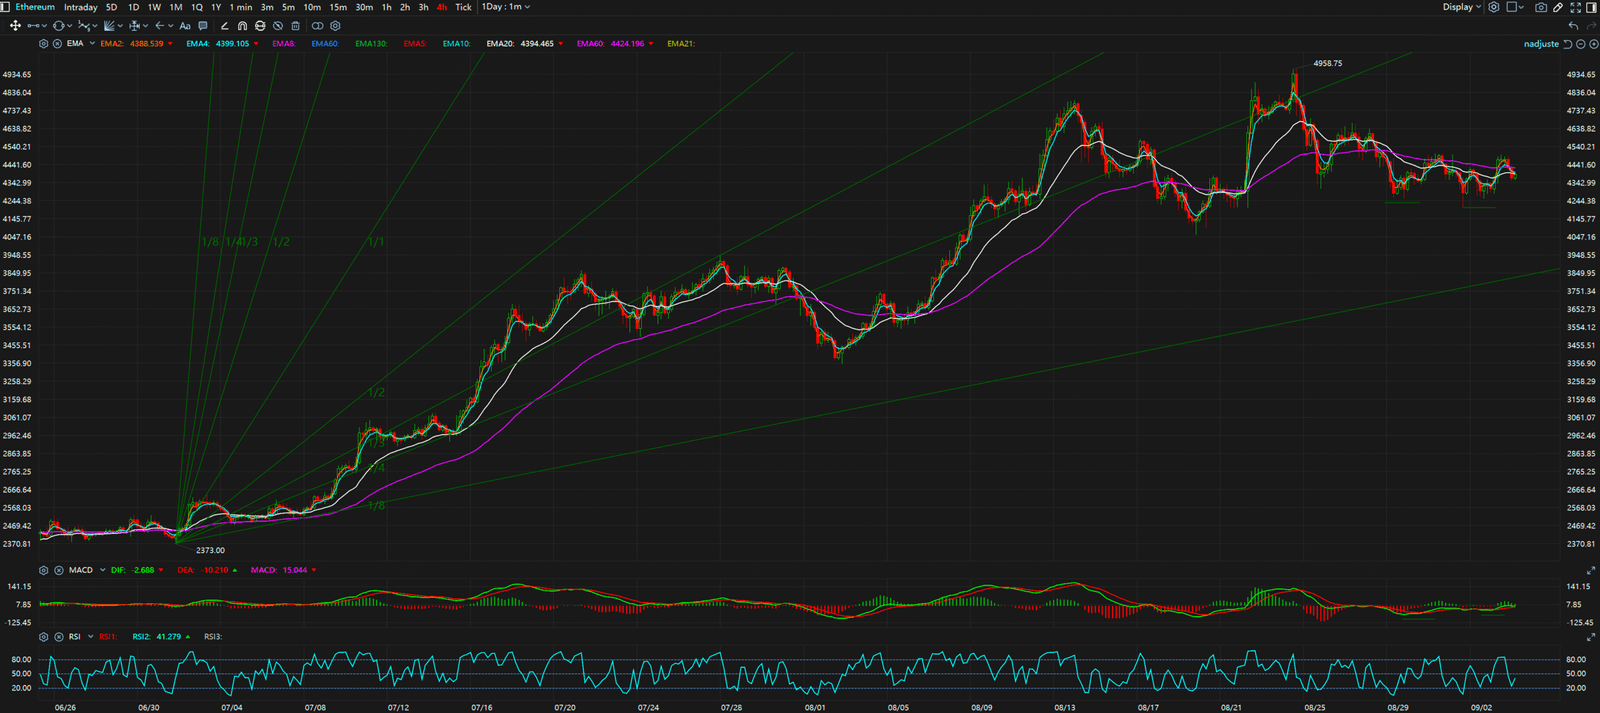
The Hidden Signal: Ethereum’s Bullish Divergence However, a closer look at Ethereum’s 4-hour chart reveals a classic MACD Bullish Divergence. While the price of ETH recently printed a lower low, the MACD histogram—a key momentum indicator—has formed a higher low. This is a textbook sign of weakening downward momentum and often precedes a significant price reversal to the upside. It suggests that “smart money” may be accumulating ETH in anticipation of a breakout.
Synthesis & Implication: This conflict—Bitcoin’s apparent weakness versus Ethereum’s hidden strength—implies that the market’s next major move might not be dictated by Bitcoin. Traders who are solely focused on BTC’s price action may be caught off guard by a potential surge in ETH and other altcoins. This bullish divergence in Ethereum could be the leading indicator for the next wave of market-wide momentum.


Key Takeaways
In summary, the market is at a critical juncture defined by conflicting signals. While Bitcoin appears to be losing steam, Ethereum is flashing a potential bottoming signal. The key levels to watch are: for Bitcoin, support at $110,000 and resistance at $115,000. For Ethereum, the crucial support lies at $4,300, with a breakout above the $4,500 resistance level potentially confirming the bullish reversal.
For continuous, real-time analysis of these developing market structures, visit www.chart-blitz.com.
True trading advantage comes from decoding these conflicting signals. To learn the professional-grade framework for seeing the market’s real intentions, explore our exclusive models on www.chart-blitz.com.
Sources:
Unlocking Technical Analysis: Power Moves with Diagrams
4-Hour Timeframe for Bitcoin
4-Hour Timeframe for Ethereum