The speculator’s chief enemies are always boring from within. It is inseparable from human nature to hope and to fear
William Delbert Gann – 1949
Chainlink (LINK) has ignited the market with a blockbuster announcement of a partnership with a global logistics giant. This fundamental catalyst, centered on Real-World Asset (RWA) application, has propelled LINK’s price to break out of a long-term consolidation pattern. But amidst the euphoria, the real question is: is this a sustainable, true breakout, or another fleeting “fakeout”? The answer lies hidden within the structures of different timeframes.
The Catalyst & Fundamental View (The Rear-view Mirror) The partnership with a logistics titan brings Chainlink’s technology from the crypto-native world into the core of global trade. The significance of this news transcends short-term price action; it demonstrates Chainlink’s core value as the bridge between blockchains and real-world data. The market has interpreted this as a purely bullish signal, believing LINK’s valuation ceiling has been shattered. This explains why the price was able to easily, and with immense volume, break through a long-suppressed bottleneck. But while fundamentals explain why it should rise, technical analysis tells us how the rally will likely unfold.
The Predictive Lens: A Multi-Timeframe Technical Deep Dive
Multi-Timeframe Technical Deep Dive (The Predictive Lens) To forecast the future path, we must understand the structural significance of this breakout.
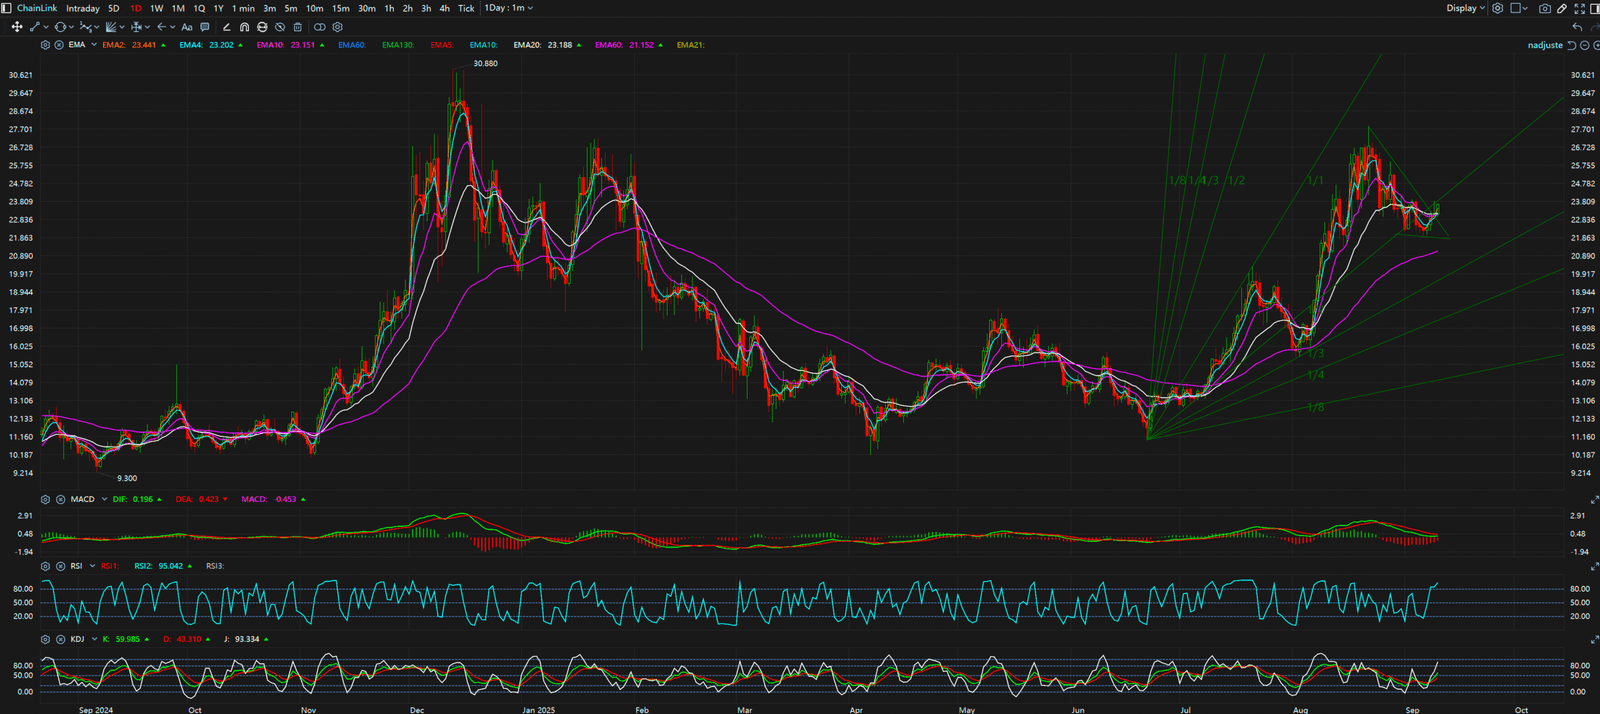
- Daily Chart: This is the most crucial chart. Before the announcement, LINK was trapped within a massive symmetrical triangle, forming a “Lower Highs & Higher Lows” consolidation pattern. The recent price action was not just a simple pump; it was a decisive breakout above the upper trendline of this months-long pattern. This structural shift signifies the market’s transition from an “indecisive” sideways phase to a potential new “Higher Highs & Higher Lows” uptrend.
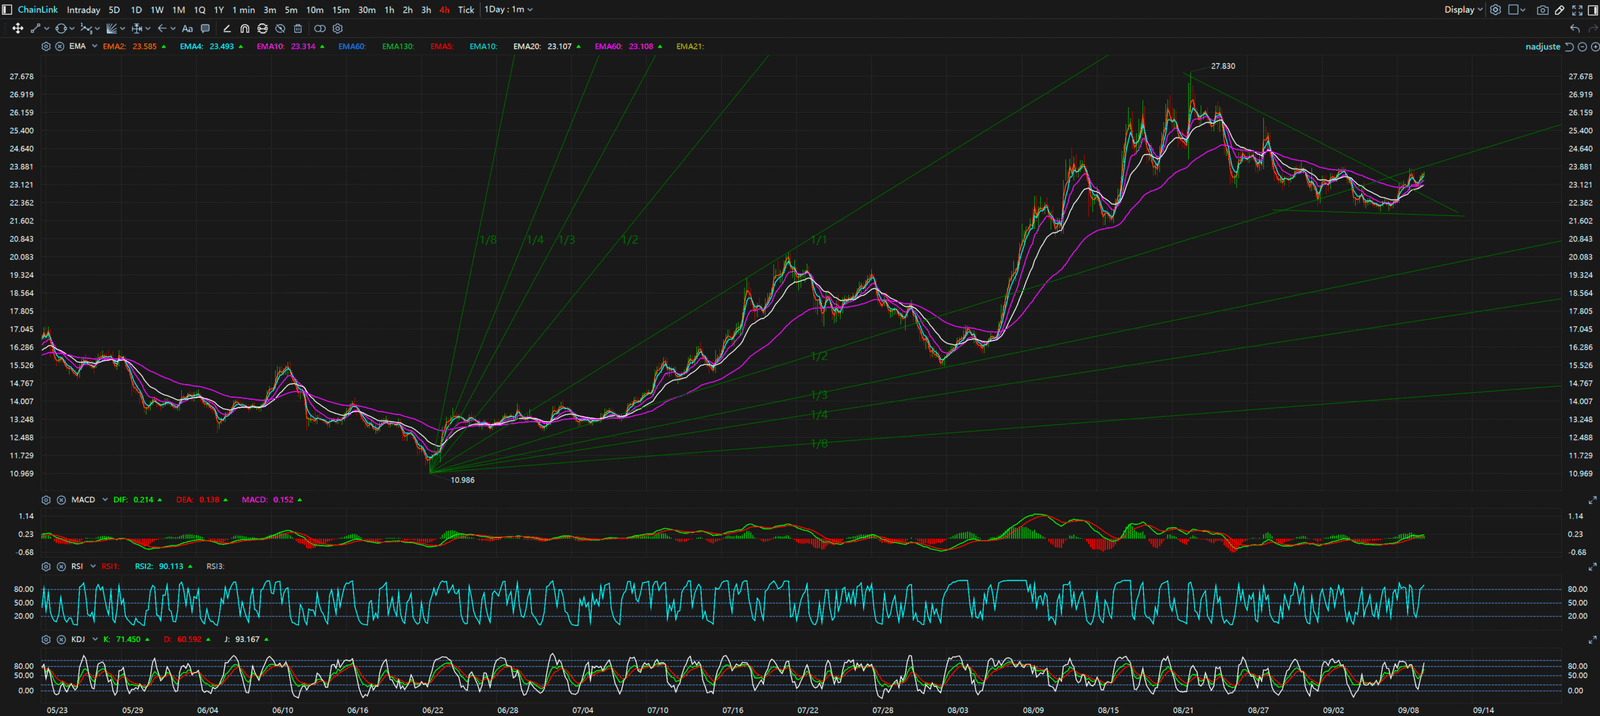
- 4-Hour Chart: The mid-term chart clearly displays the volume explosion during the breakout, confirming its validity. After the breakout, the price did not continue in a straight line but began to consolidate, which is healthy market behavior.
- 30-Minute Chart: The short-term chart reveals the market’s micro-dynamics. Following the sharp ascent, the 30-minute chart has started to form a “Lower Highs & Lower Lows” pullback. This is typical profit-taking and, more importantly, the market’s attempt to find a new equilibrium.
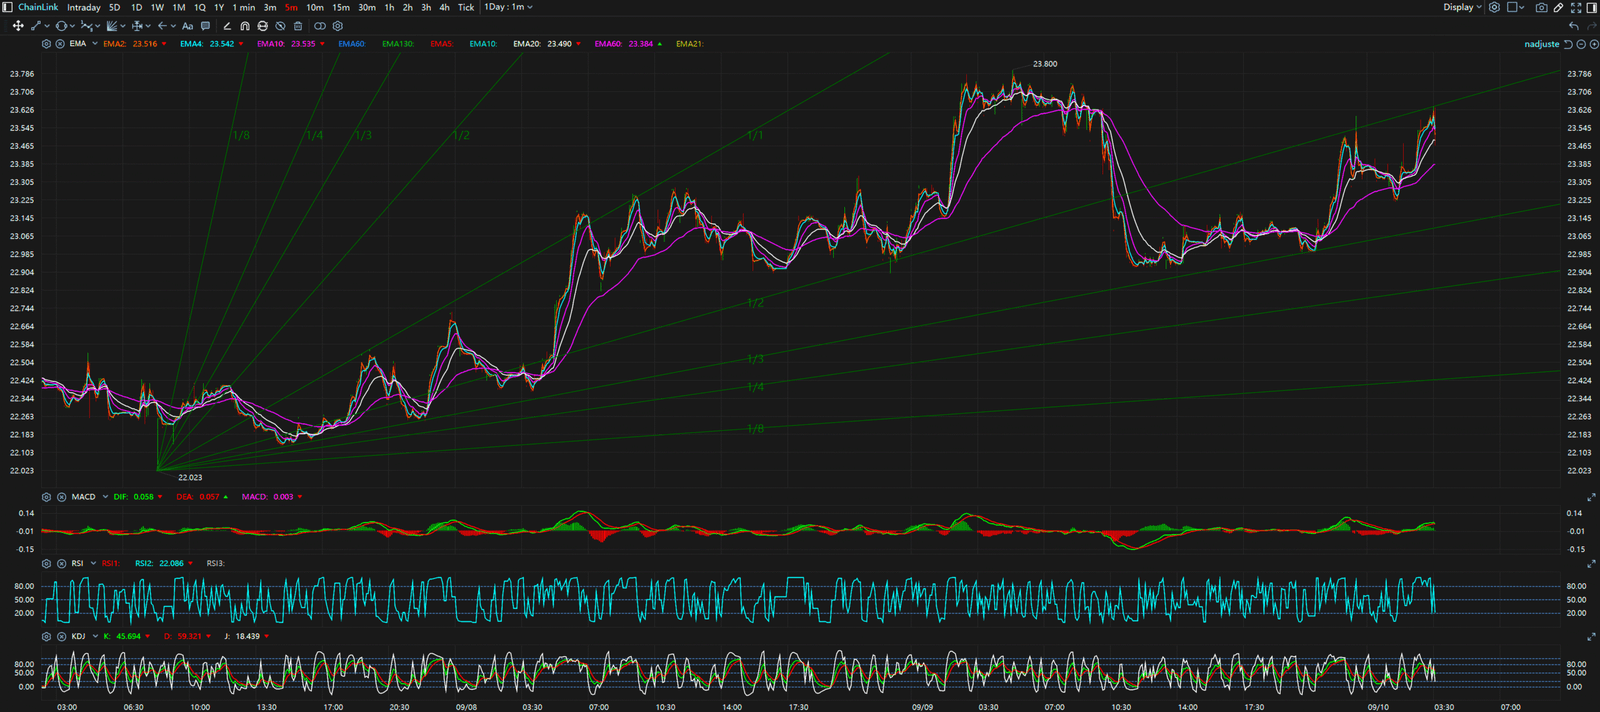
- 5-Minute Chart: On the 5-minute chart, we can observe that each dip is accompanied by diminishing volume, suggesting that selling pressure is weakening.
Synthesis and The Professional’s Viewpoint
When we piece all the timeframes together, a clear roadmap emerges. The “structural breakout” on the daily chart is our strategic direction, telling us to be bullish. The “short-term pullback” on the 30-minute chart is our tactical entry opportunity.
Where is this pullback headed? Most likely, to the very trendline that was just broken on the daily chart. This process is known as a “retest of support.” The price returns to test the old resistance level to see if it can successfully flip into new support. If the price finds footing at this level and turns back up, it confirms the breakout’s validity and offers traders an excellent entry point with a much better risk/reward ratio than chasing the top.


Key Takeaways
In conclusion, Chainlink’s fundamentals provided the directional bias, but the technical charts provide the operational playbook. The current short-term pullback is not a crisis; it is a tactical opportunity.
- Key Support Level: $18.50 (The former triangle resistance, now the critical retest zone).
- Key Resistance Levels: $22.00 (The recent high created by the news), $25.00 (The next psychological target).
A successful retest and hold of $18.50 would pave the way for a challenge of $22.00 and potentially $25.00. Conversely, a failure to hold $18.50 could signal a “fakeout,” requiring a reassessment of the entire structure.
For continuous, real-time analysis of these developing market structures, visit www.chart-blitz.com.
True trading advantage comes from decoding these conflicting signals. To learn the professional-grade framework for seeing the market’s real intentions, explore our exclusive models on www.chart-blitz.com.
Sources:
- https://blog.chain.link/chainlink-partners-with-logistics-major-for-supply-chain-data-verification/
- https://www.coindesk.com/business/2025/09/10/chainlink-link-surges-on-real-world-asset-adoption-news/
- https://cointelegraph.com/news/chainlink-ccip-tapped-by-enterprise-giant-for-global-trade
Unlocking Technical Analysis: Power Moves with Diagrams !
Daily Timeframe for Chainlink (LINK)
4-Hour Timeframe for Chainlink (LINK)
5-Minutes Timeframe for Chainlink (LINK)