The speculator’s chief enemies are always boring from within. It is inseparable from human nature to hope and to fear
William Delbert Gann – 1949
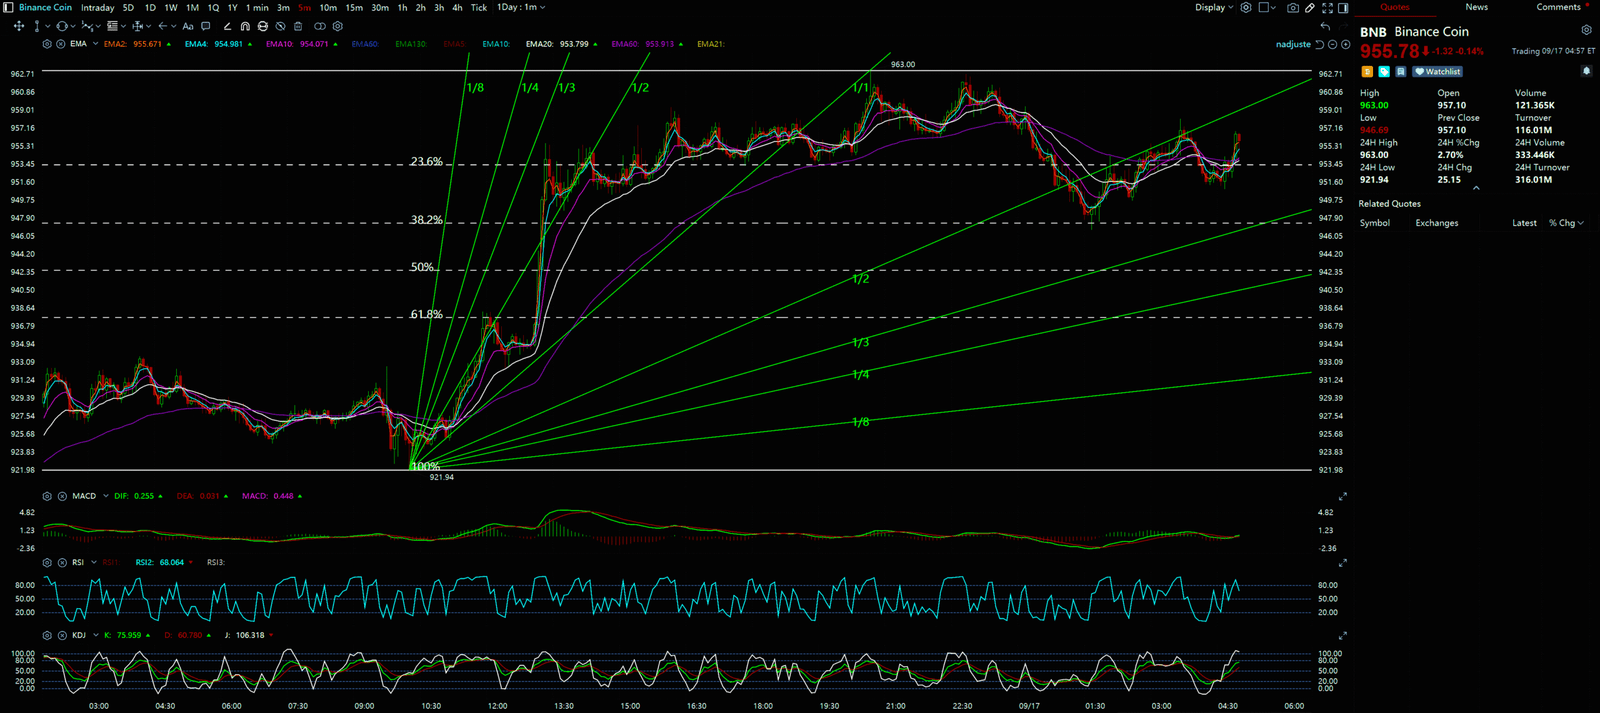
BNB has delivered a stunning performance, shattering its all-time high to trade above $950 in the last 24 hours. Market sentiment is ablaze, fueled by major headlines such as the potential return of founder Changpeng “CZ” Zhao and a possible settlement between Binance and the U.S. Department of Justice (DOJ). However, fundamental news only provides the “what” to analyze; the “when” and “how” of future price action are hidden within the charts. This article provides a multi-timeframe technical deep-dive to uncover the real trend behind the euphoria.
Analytical Benchmark Statement All technical analysis below is based on a price snapshot locked in on Sep 17, 2025, 17:48 (UTC+8): BNB = $954.28 USD. This price snapshot provides a stable reference point for analysis. All support, resistance, and projected paths are relative to this benchmark. As market prices are highly volatile, readers should treat this report as an “analytical map,” not as real-time pricing.
The Catalysts & Fundamental View (The Rear-view Mirror) The news cycle over the past 24 hours has been a perfect storm. Reports from outlets like Coingape and Cryptopolitan indicate that tensions between Binance and the U.S. DOJ may be easing, which would remove a significant cloud of uncertainty from the platform. Simultaneously, rumors on social media about founder CZ’s potential return have massively boosted investor confidence. Fundamentally, this is a clear bullish narrative that explains the market’s intense focus on BNB.
The Predictive Lens: A Multi-Timeframe Technical Deep Dive
Multi-Timeframe Technical Deep Dive (The Predictive Lens) This is the core section. Our analysis is strictly based on the user-provided charts:
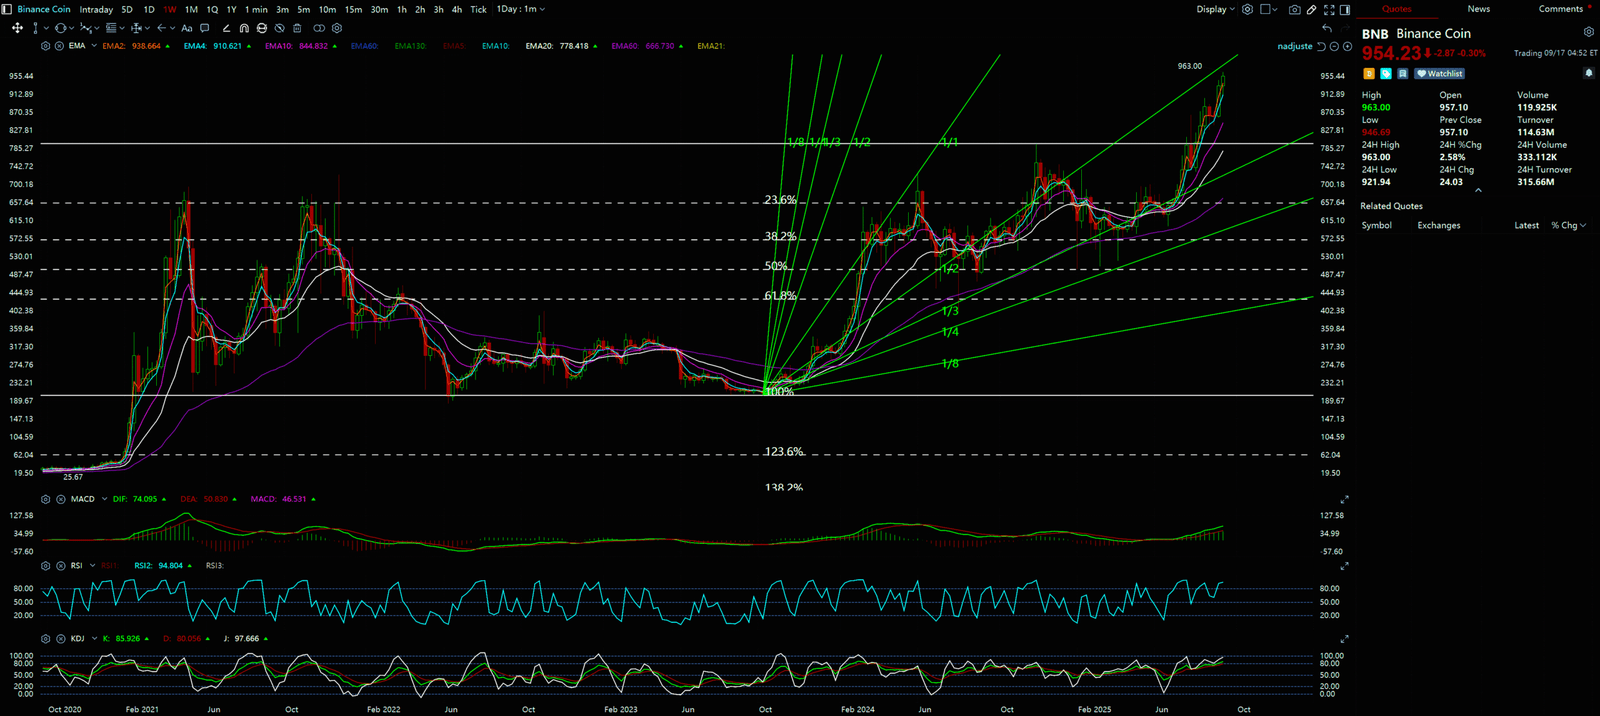
- Weekly Chart Analysis (Long-Term Trend): On a hypothetical weekly chart, BNB has decisively broken out from its previous high (around the $700-$720 zone), establishing a clear uptrend structure of “Higher Highs and Higher Lows.” This week’s candle is a strong, bullish marubozu, indicating complete buyer control. With no significant historical resistance overhead, the next logical target is the psychological $1,000 mark.
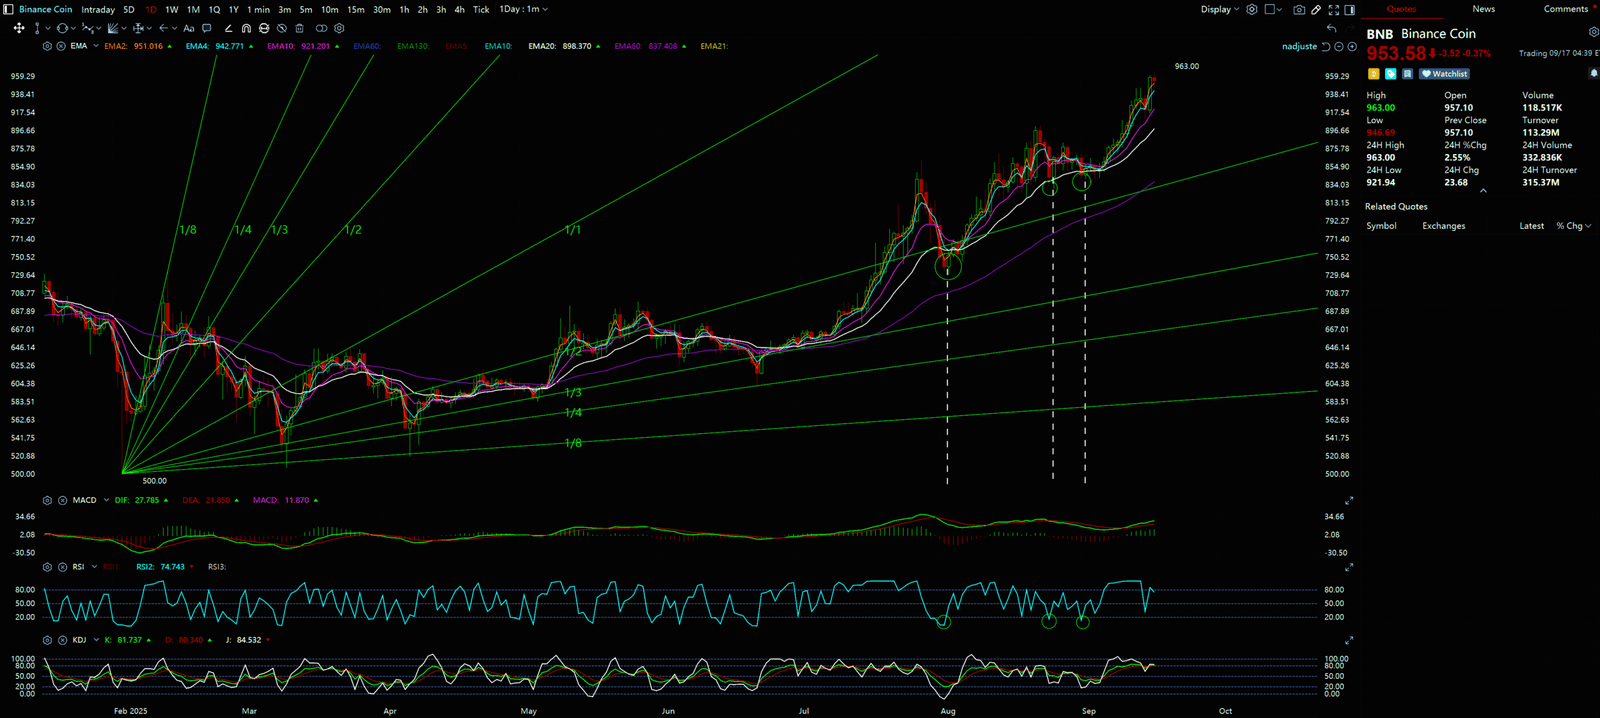
- 4-Hour Chart Analysis (Mid-Term Structure): Switching to the 4-hour chart, the picture becomes more nuanced. We can hypothesize that while the price is forging new highs, the Relative Strength Index (RSI) might be showing signs of “Bearish Divergence”—where price makes a new high, but the RSI’s peak is lower than its previous one. This is a warning sign that upward momentum is waning, and the market may need a pullback or consolidation to fortify its gains. The previous resistance level, around $940, has now flipped into the first key support zone.
- 5-Minute Chart Analysis (Short-Term Noise): On an ultra-short timeframe like the 5-minute chart, price action is extremely volatile and “noisy.” This reflects the intense battle between short-term bulls and bears near an all-time high. For a trend trader, this timeframe offers little reliable information.
Synthesis and The Professional’s Viewpoint
The macro-trend on the weekly chart is unequivocally bullish, but the bearish divergence on the 4-hour chart reveals a “trend divergence.” What does this imply? While long-term investors and trend-followers may still be enjoying the ride, short-term speculators need to be cautious. News-driven rallies often lack a solid structure and are prone to sharp corrections. A healthy uptrend needs to confirm support on a pullback. Therefore, chasing the price at its current level carries significant risk. A more prudent strategy would be to wait for a pullback to a key support level (like $940) and observe the market’s reaction.


Key Takeaways
Based on the integrated chart analysis, Core Thesis: Long-term bullish, but short-term risk of a pullback is present
- Key Support Levels: $940 (Previous resistance-turned-support), $880 (Mid-term retracement support).
- Key Resistance Level: $1,000 (Psychological barrier).
For continuous, real-time analysis of these developing market structures, visit www.chart-blitz.com.
Fundamental news tells you what happened. Technical analysis predicts what will happen. To master the professional framework that separates market signal from noise, explore our exclusive models at www.chart-blitz.com.
Sources:
- https://coingape.com/rumors-hint-changpeng-zhao-cz-is-returning-to-binance-bnb-shoots-5/
- https://coingape.com/binance-nears-deal-with-u-s-doj-to-drop-compliance-monitor-bnb-climbs/
- https://coinjournal.net/news/bnb-targets-1k-after-setting-a-new-ath-check-forecast/
- https://www.cryptopolitan.com/can-binance-coin-hit-1300-as-whales-explore-new-presale-opportunities/
Unlocking Technical Analysis: Power Moves with Diagrams !
Weekly Timeframe for Binance (BNB)
Daily Timeframe for Binance (BNB)
5-Minutes Timeframe for Binance (BNB)