The speculator’s chief enemies are always boring from within. It is inseparable from human nature to hope and to fear
William Delbert Gann – 1949
TRON (TRX) has recently regained the spotlight within the crypto community, with discussions revolving around its network efficiency and ecosystem developments. However, while fundamental news provides the “what” for public discourse, only rigorous technical analysis can reveal the “how” and “when” of capital flow. This article dissects TRON’s market structure across multiple timeframes to answer one core question: Is this the calm before a major breakout, or the beginning of a significant downturn?
Analysis Benchmark Statement
- All subsequent technical analysis is based on a price snapshot locked in on Sep 26, 2025, 17:22 (UTC+8): TRX = 0.3339 USD.
- This price snapshot provides a stable reference point for analysis. All support, resistance, and projected paths are relative to this benchmark. Market prices are volatile; readers should treat this report as an “analytical map,” not a real-time quote.
Catalysts & Fundamental View (The Rear-view Mirror) Over the past 24 hours, news surrounding TRON has focused on:
- Ongoing promotion of DeFi projects by the TRON DAO.
- Renewed emphasis on TRX’s low transaction fees on social media.
- Some analyses pointing out the price stagnation of TRX despite generally optimistic market sentiment.
While this news maintains market interest in TRON, it fails to provide a strong directional catalyst. It acts more as “background music” to the existing market trend rather than a game-changing event. The real story is written on the charts.
The Predictive Lens: A Multi-Timeframe Technical Deep Dive
Multi-Timeframe Technical Deep Dive (The Predictive Lens) The core of this analysis stems from the “trend divergence” between the weekly and daily charts, often a precursor to significant market shifts.
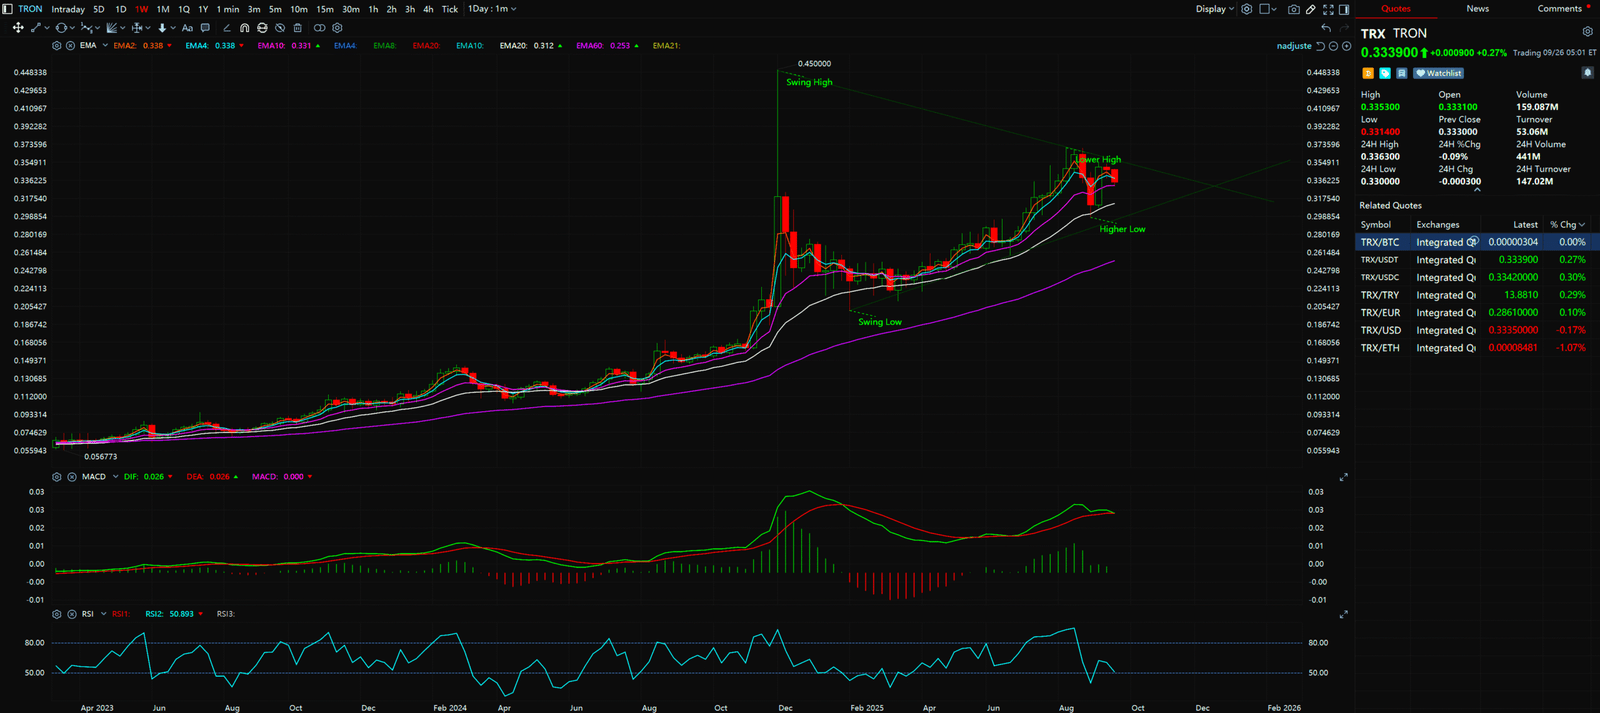
- The Weekly Chart (Macro View): As seen in the provided weekly chart, a large, multi-month symmetrical triangle pattern is clearly visible. After hitting a high of around 0.45 USD in late 2024, the price formed a “lower high” (approx. 0.37 USD). Concurrently, the bottom support has risen from around 0.201 USD to a recent “higher low” (approx. 0.2977 USD). This is a classic “lower highs, higher lows” consolidation pattern. Although the MACD indicator is above the zero line (indicating long-term strength), the MACD line has started to turn down, approaching the signal line. This is a clear sign of weakening bullish momentum, suggesting the long-term trend may be nearing exhaustion or facing a deep correction.
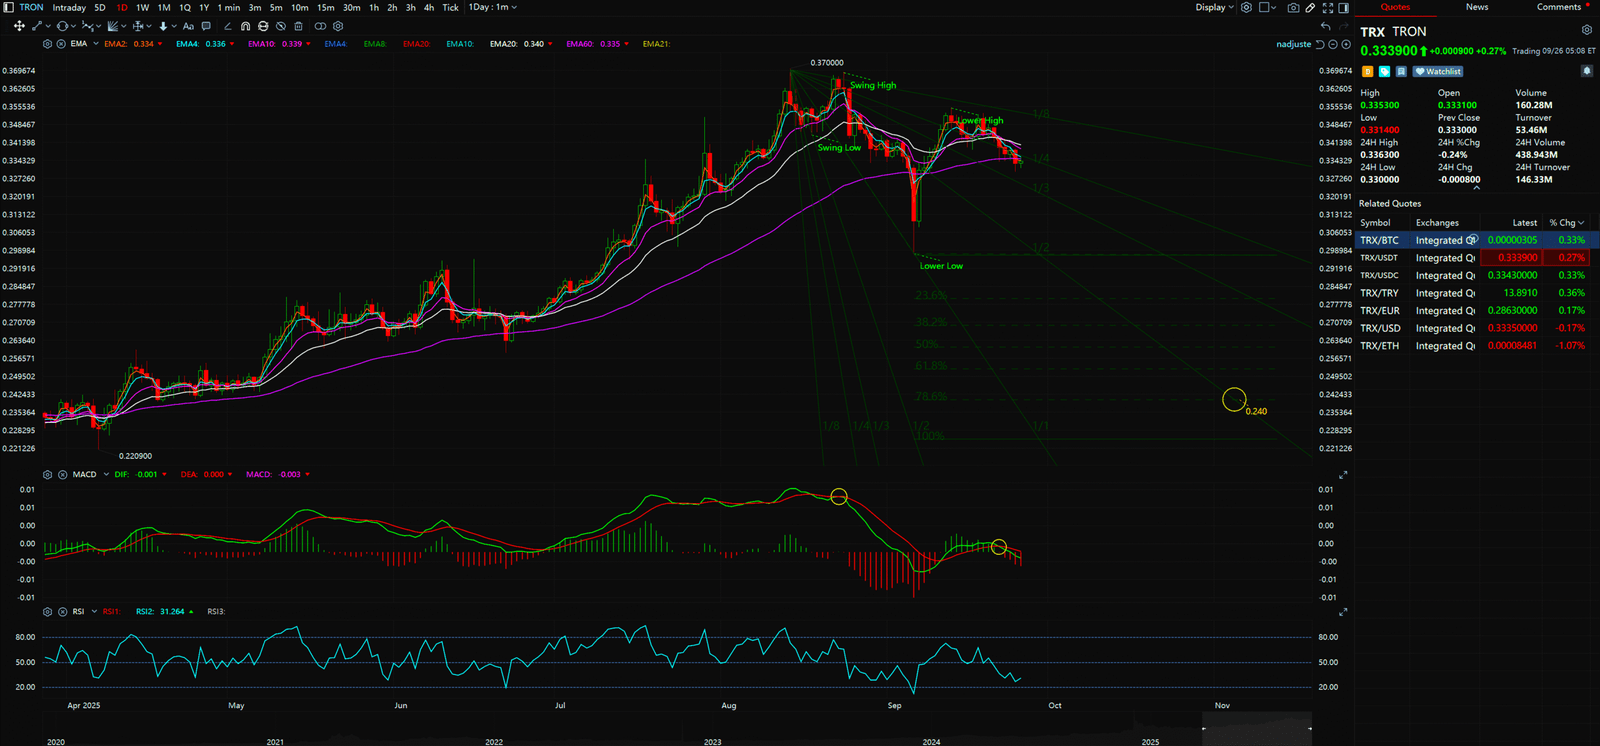
- The Daily Chart (Short-Term Tactics): Switching to the daily chart, the picture is entirely different. A clear downtrend structure is in play: the price has formed “lower highs” (0.3688 -> 0.3549 USD) and “lower lows” (0.3443 -> 0.2977 USD). This confirms that bears are in control of the short-term market. The MACD indicator has crossed below the zero line into negative territory, reinforcing the bearish outlook. The RSI is hovering around 31, approaching oversold territory but still with room to fall.
Synthesis Analysis & Unique Insight
The macro consolidation on the weekly chart and the short-term decline on the daily chart present a stark contrast. This “trend divergence” reveals the market’s internal conflict: long-term holders may still be watching and accumulating, but short-term traders and momentum funds are exiting.
Reasonable judgment — That the “mid-to-long-term trend is at the end of a major rise, but there might be significant short-term downward pressure”—is highly consistent with the chart evidence. The bearish structure on the daily chart is the most immediate signal to watch. If the price fails to hold the recent low (approx. 0.2977 USD), the next critical support zone will be the $0.24 to $0.25 range you identified. This level not only corresponds to previous market structure support but also aligns with the 61.8% to 78.6% Fibonacci retracement levels shown on the daily chart, making it a powerful potential reversal zone.


Key Takeaways
Summary / Key Price Levels:
- Core Narrative: TRON is caught in a battle between long-term consolidation and a short-term downtrend.
- Key Resistance: 0.3550 USD (Previous daily high), 0.3700 USD (Weekly downtrend line).
- Key Support: 0.2977 USD (Recent low), 0.2400 – 0.2500 USD (Crucial Support Zone).
For continuous, real-time analysis of these developing market structures, visit www.chart-blitz.com.
Fundamental news tells you what happened. Technical analysis predicts what will happen. To master the professional framework that separates market signal from noise, explore our exclusive models at www.chart-blitz.com.
Sources:
- https://app.santiment.net/assets/tron
- https://defillama.com/chain/Tron
- https://app.santiment.net/assets/tron
Unlocking Technical Analysis: Power Moves with Diagrams !
Weekly Timeframe for TRON (TRX)
Daily Timeframe for TRON (TRX)