The speculator’s chief enemies are always boring from within. It is inseparable from human nature to hope and to fear
William Delbert Gann – 1949
Recently, Solana (SOL) has re-emerged as a market focus, with its price volatility rising in sync with discussions around new protocols and institutional interest. However, fundamental news merely provides the “subject” for analysis; the real timing for buys and sells, and the future path, are hidden within the structure of the price charts. This article will deeply analyze SOL’s multi-timeframe charts to unveil the true market trend behind the news hype.
Analysis Benchmark Statement All technical analysis below is based on a price snapshot locked in on September 29, 2025, 14:02 (UTC+8): SOL = 209.29 USD. This price snapshot provides a stable reference point for the analysis. All support, resistance, and projected paths are relative to this benchmark. Market prices are highly volatile; readers should treat this report as an “analytical map,” not a real-time quote.
Catalysts and Fundamental View (The Rear-view Mirror) Over the past 24 hours, market sentiment has been influenced by multiple news items. On one hand, the launch of new DeFi protocols within the Solana ecosystem is seen as a positive signal for network fundamental value growth. On the other, rumors of institutional adoption have further fueled optimistic expectations. However, this news is essentially a “rear-view mirror.” It explains past price action but has limited predictive power. It is the “fuel” for the market, but the “steering wheel” remains firmly in the hands of technical structure.
The Predictive Lens: A Multi-Timeframe Technical Deep Dive
Multi-Timeframe Technical Deep Dive (The Predictive Lens) To accurately determine SOL’s future path, one must interpret charts across different time dimensions.
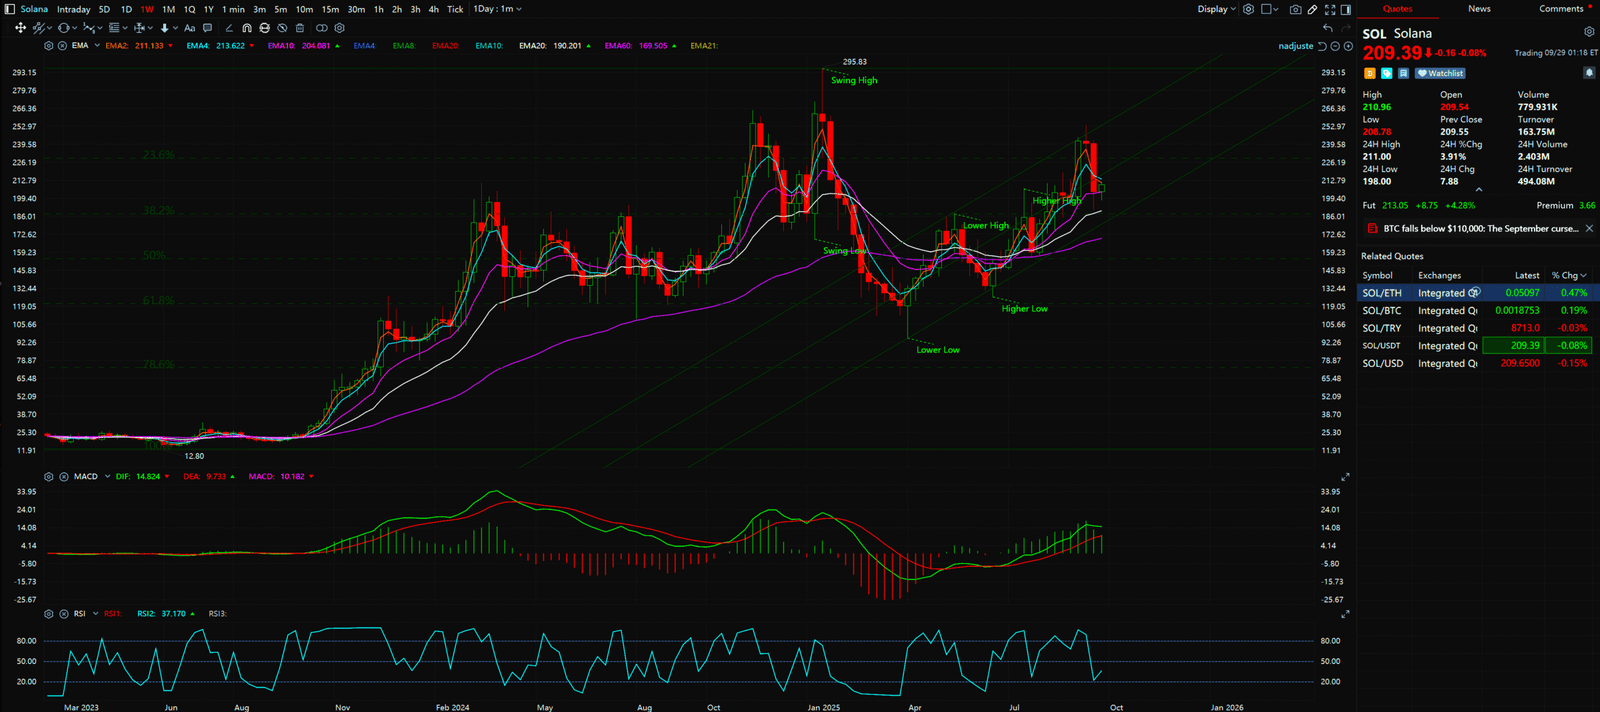
- Weekly Chart – Macro Uptrend Established: From the user-provided weekly chart, a critical trend reversal is clearly visible. The price previously experienced a typical downtrend, forming a structure of Lower Highs ($295.83 -> $187.71) and Lower Lows ($168.88 -> $95.26). However, this downtrend failed to continue. After finding solid support around $95.26, the market structure fundamentally shifted. The recent price action has formed a clear bullish structure of Higher Highs ($187.71 -> ~$259) and Higher Lows ($126 -> $156.83). More importantly, the MACD indicator’s lines (MACD and Signal) have powerfully crossed above the zero line and are diverging, a textbook signal of a strong bull market, indicating that SOL is in the beginning or middle of a macro uptrend.
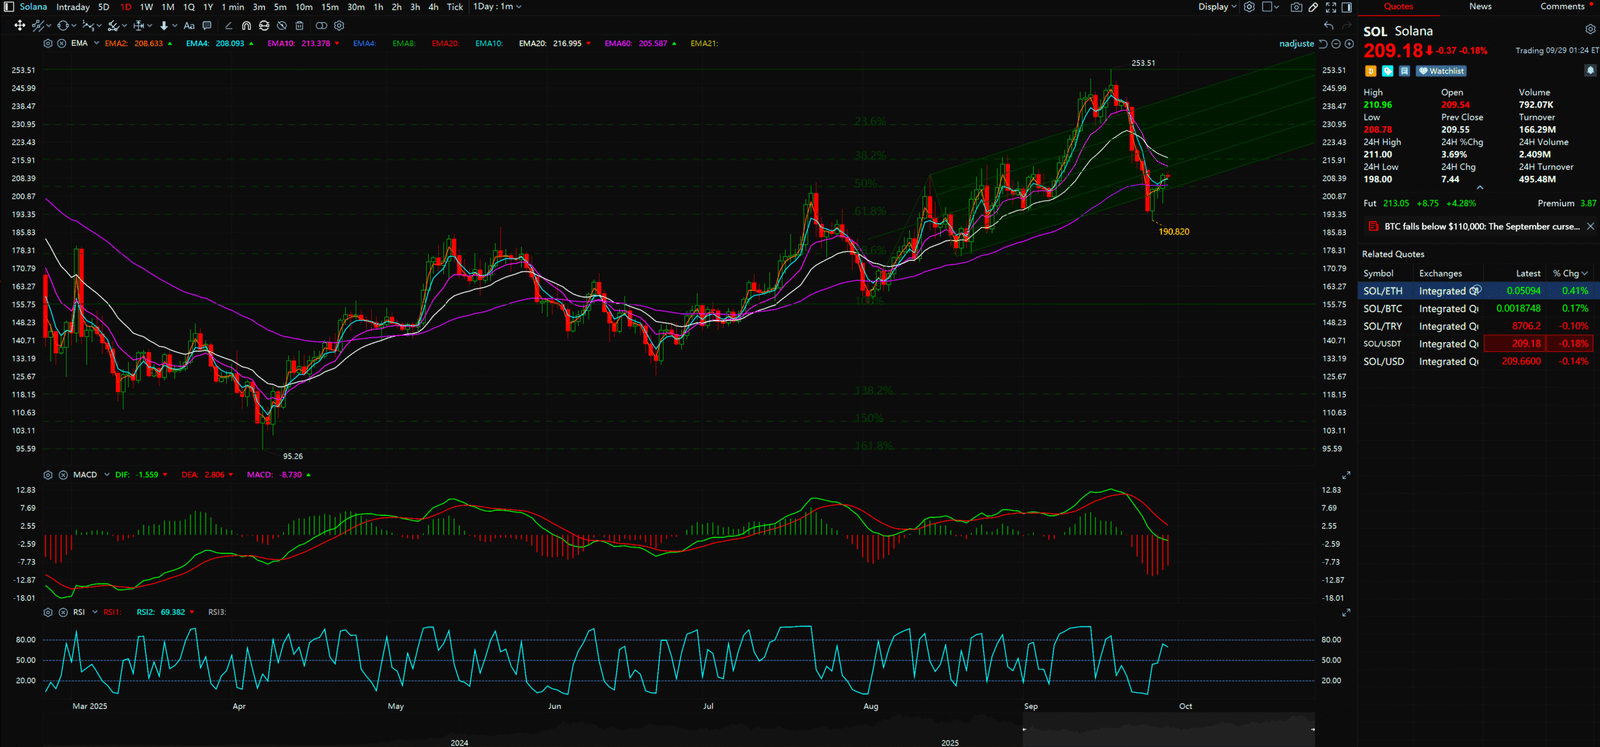
- Daily Chart – Short-Term Consolidation and Potential Pullback: Switching to the daily chart, the story becomes more nuanced. The chart displays a sideways or slightly converging trend pattern of Higher Highs ($213.02 -> $253.51) and Lower Lows ($199.32 -> $190.82). This “trend divergence” between the bullish weekly and the ranging daily is a classic sign that the market is preparing for its next major move. It implies that within the strong macro rally, there is short-term pullback pressure or a need for consolidation to digest previous gains.
Synthesis Analysis & Unique Insight
The strong bullish structure of the weekly chart is our “compass,” pointing the long-term direction. The daily chart’s consolidation is the “road condition,” reminding us of potential bumps ahead. This combination suggests that any short-term dip or consolidation should be viewed as a “healthy pullback” within a macro uptrend, not a trend reversal.
Reasonable judgement: The $190 – $193.35 zone you identified below the short-term pressure is not just a key Fibonacci retracement level but also coincides with the previous low area on the daily chart, forming a powerful “Confluence Zone” of support. A bounce from this area would be a strong confirmation of the continuation of the macro uptrend.


Key Takeaways
Summary / Key Price Levels:
- Key Resistance: $253.51 (Daily previous high), $259.80 (Recent weekly high)
- Key Support: $190.00 – $193.35 (Key pullback zone), $156.83 (Previous weekly higher low)
For continuous, real-time analysis of these developing market structures, visit www.chart-blitz.com.
Fundamental news tells you what happened. Technical analysis predicts what will happen. To master the professional framework that separates market signal from noise, explore our exclusive models at www.chart-blitz.com.
Sources:
- https://finance.yahoo.com/news/solana-dogecoin-others-lead-gains-060111366.html
- https://www.forbes.com/digital-assets/assets/solana-sol/
- https://coinmarketcap.com/currencies/solana/
Unlocking Technical Analysis: Power Moves with Diagrams !
Weekly Timeframe for Solana (SOL)
Daily Timeframe for Solana (SOL)