The speculator’s chief enemies are always boring from within. It is inseparable from human nature to hope and to fear
William Delbert Gann – 1949
The market is buzzing with intense speculation surrounding a potential spot Exchange-Traded Fund (ETF) for XRP (Ripple), driving sentiment to euphoric highs. However, fundamental news only provides the “what” to analyze. True trading decisions must revert to the price charts, as only technical analysis can reveal “how” and “when” the market will price in this information.
Analysis Benchmark Statement: All subsequent technical analysis is based on a price snapshot locked on Oct 1, 2025, 16:08 (UTC+8): XRP = 2.825 USD. This price snapshot provides a stable reference for the analysis. All support, resistance, and projected paths are relative to this benchmark. As market prices are volatile, readers should treat this report as an “analytical map,” not a real-time quote.b.
Catalysts & Fundamental View (The Rear-view Mirror): Over the past 24 hours, the spotlight has been firmly on the “XRP ETF.” One analyst rated its approval odds at 100%, a sentiment that has become the primary fuel for XRP’s heightened attention. Simultaneously, however, macro concerns about a potential U.S. government shutdown have cast a shadow over the broader market. This conflicting information highlights the importance of using technical analysis to filter “signal” from “noise.”
The Predictive Lens: A Multi-Timeframe Technical Deep Dive
Multi-Timeframe Technical Deep Dive (The Predictive Lens) To accurately determine XRP’s future path, one must interpret charts across different time dimensions.
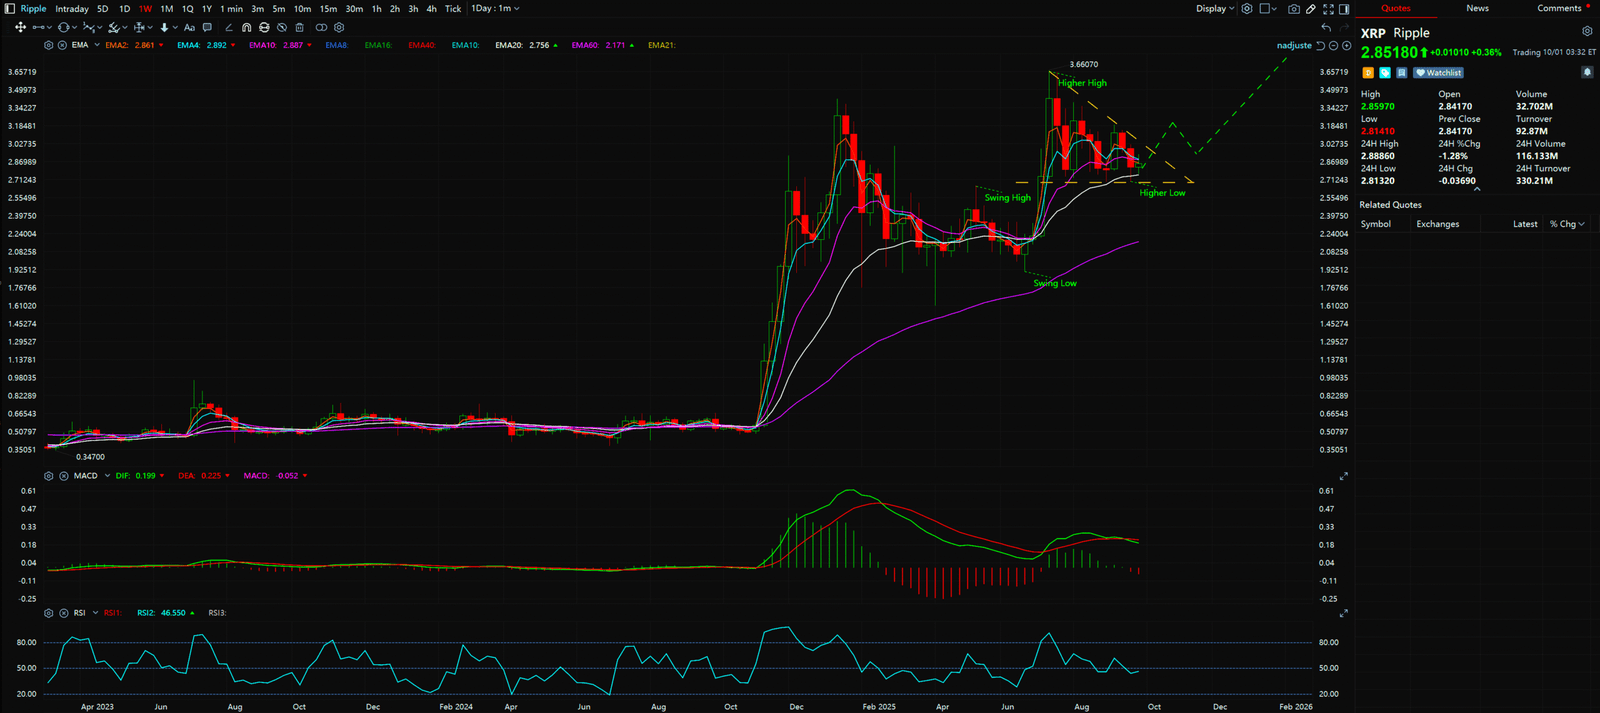
- Weekly Chart Analysis (Long-Term Structure): The weekly chart clearly displays a textbook uptrend structure, characterized by “Higher Highs” (from $2.65 to $3.66) and “Higher Lows” (from $1.908 to $2.697). More critically, the price is consolidating within a massive “Horizontal Triangle” pattern. This formation is defined by a horizontal support line around $2.697 and a down trendline connecting the highs of $3.66 and $3.18. According to Elliott Wave Theory, such a pattern often manifests as a fourth corrective wave, implying a powerful fifth impulse wave is brewing.
- Indicator Validation (MACD): The MACD (12,26,9) indicator on the weekly chart provides strong confirmation of this bullish structure. Although the MACD line (fast line) has temporarily dipped below the Signal line (slow line), both lines remain firmly above the zero axis. This signal does not indicate a trend reversal but rather a “healthy pullback” or “energy consolidation” phase typical of a mid-bull market.
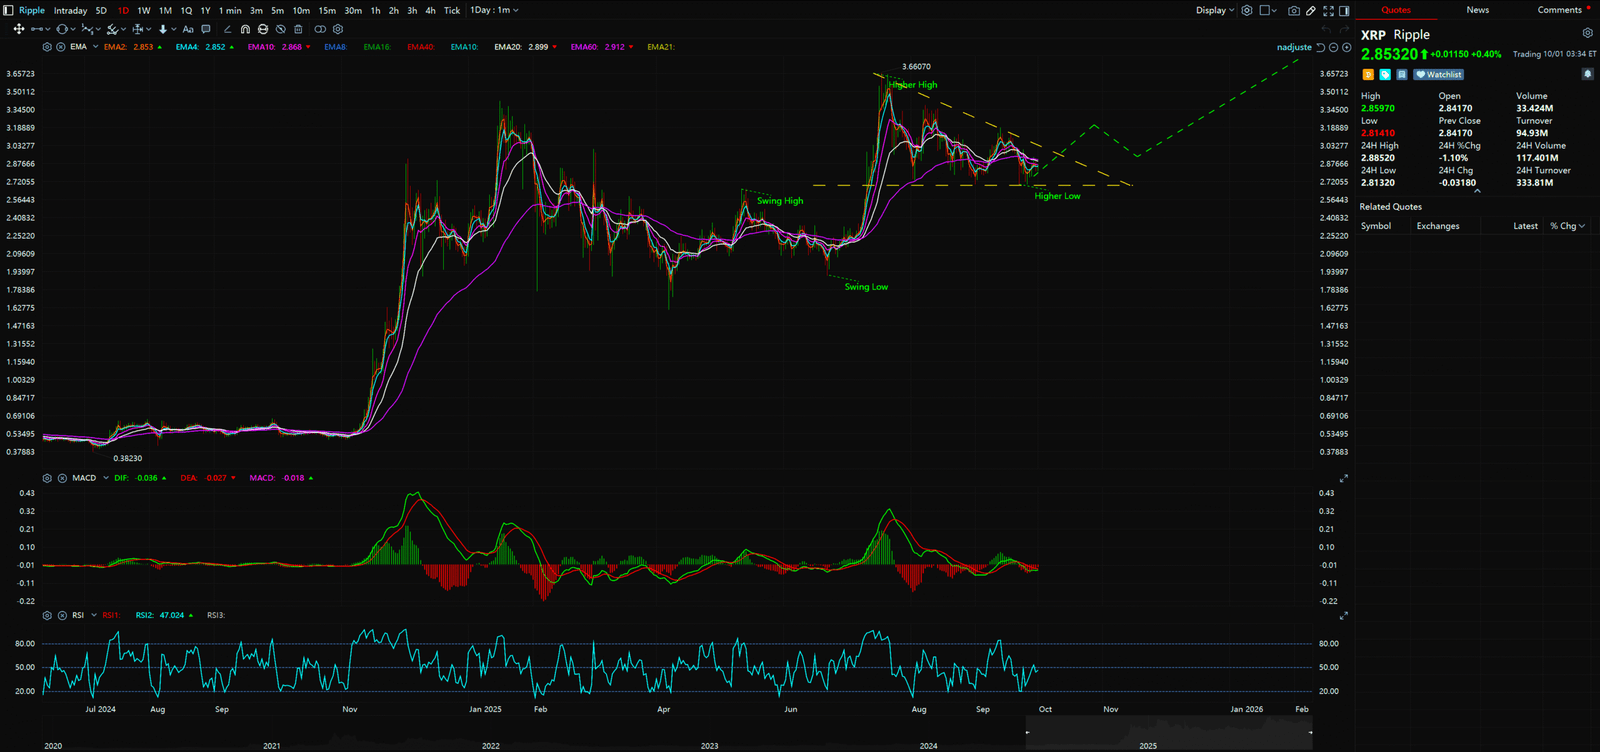
- Daily Chart Analysis (Mid-Term Confirmation): Switching to the daily chart, the same “Higher High, Higher Low” market structure is observed, perfectly aligning with the macro trend on the weekly chart. This cross-timeframe trend alignment significantly strengthens the probability of an eventual upward breakout.
Synthesis Analysis & Unique Insight
The story on the charts is crystal clear: XRP is in a state of “compression.” The Horizontal Triangle on the weekly chart is like a coiled spring, awaiting a release of pressure. The fundamental ETF news is the potential “spark” to ignite this spring.
Based on all the above factors, especially the insight about “waiting for a pullback after the breakout.” This is a robust strategy to filter out “false breakouts.” Combining the chart patterns, the reasonable judgment can be made: In the short term (1-2 weeks), the price will likely continue to consolidate within the triangle, moving along the down trendline. The decisive moment will be a high-volume breakout above the horizontal resistance at $2.949. Once that breakout occurs, the first pullback to confirm that level has flipped to support would present the most ideal entry point.


Key Takeaways
Summary / Key Price Levels:
- Major Resistance: $3.66 (Top of the horizontal triangle)
- Minor Support: ~$2.7795 (Current position of the down trendline)
- Major Support: $2.50 – $2.56 (Based on the 61.8% Fibonacci retracement, an extremely strong potential accumulation area)
For continuous, real-time analysis of these developing market structures, visit www.chart-blitz.com.
Fundamental news tells you what happened. Technical analysis predicts what will happen. To master the professional framework that separates market signal from noise, explore our exclusive models at www.chart-blitz.com.
Sources:
- https://insidebitcoins.com/news/xrp-price-prediction-as-bloomberg-analyst-puts-xrp-etf-approval-odds-at-100-grayscale-leads-pack
- https://finance.yahoo.com/news/bitcoin-ethereum-xrp-dogecoin-dip-112409071.html
- https://www.fxstreet.com/cryptocurrencies/news/top-3-price-prediction-bitcoin-ethereum-ripple-btc-eyes-fresh-upside-while-eth-and-xrp-consolidate-202510010331
- https://www.msn.com/en-za/money/economy/market-news-today-crypto-asset-ethereum-xrp-and-magax-could-rally-in-q4/ar-AA1NBAUv
Unlocking Technical Analysis: Power Moves with Diagrams !
Weekly Timeframe for Ripple (XRP)
Daily Timeframe for Ripple (XRP)