To make a success you must have knowledge and know how to apply it
William Delbert Gann – 1949
Listen up, you wage-slaving kids dreaming of a penthouse. If you still think reading the news and listening to suits on CNBC is going to set you free, you are destined to be a Sheep forever. Today, I’m going to break your brain and pull you out of the Matrix. Intel (INTC) isn’t a stock; it’s an IQ test. While the world mocks it as a “tech dinosaur,” the real hunters are sharpening their knives to carve up this fat cow. This analysis is based on data as of this Saturday, January 17, 2026, 11:30 AM ET. We are using the freshest, hottest market data available. By the time you read this, the Wall Street whales might be popping champagne, and if you don’t wake up now, you’ll be left eating their crumbs. Mark this timestamp, because this could be the watershed moment for your wealth.
Chapter 1: The Official Script — The “Feed” Wall Street Serves You
Fine. Since you guys love pretending to be “rational” and obsessed with Fundamentals, let’s play that game. Let’s taste the “Official Feed” Wall Street serves the masses. This data is a placebo to soothe your anxiety and make you feel like you’ve “done your homework.”
1. The Macro Mirage The start of 2026 looks calm on the surface. The Fed, after the chaos of 2024-2025, is holding rates at a so-called “neutral” level. The AI craze has moved from the “Wild West” of 2023 into the “Application Phase.” Capital is rotating from pure Hype into “Value Pockets.” This is why you see money flowing from those AI meme stocks that went up 100x back into “Legacy Tech.”
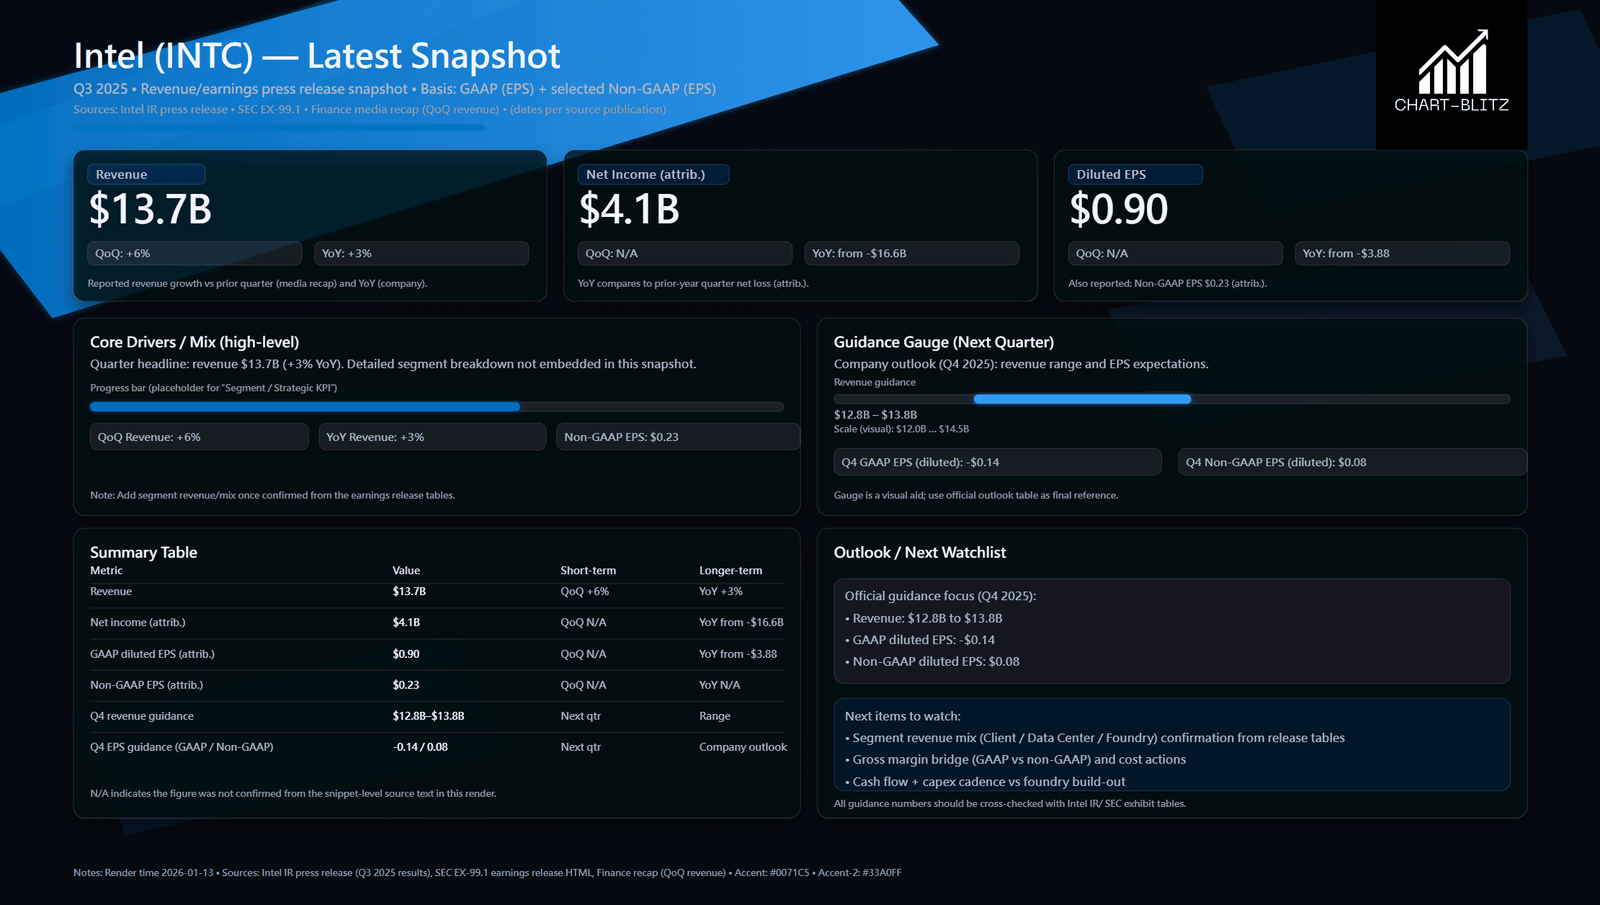
2. The “Number Games” in Earnings Look at Intel’s fresh Q3 2025 Earnings Snapshot.
- Revenue: $13.7 Billion USD. Up 3% YoY, Up 6% QoQ.
- Net Income: $4.1 Billion.
- EPS: GAAP $0.90, Non-GAAP $0.23.
- Guidance: Q4 2025 expected Revenue $12.8B – $13.8B.
If you’re a traditional value investor, you see this and say: “Hey! Not bad! Intel finally stopped the bleeding! Positive YoY! PE looks attractive!” Analysts will write 50-page reports telling you Intel’s IDM 2.0 strategy is finally working, 18A yields are up, and the Foundry business is winning clients. They’ll tell you the CHIPS Act subsidies are finally hitting the balance sheet.
3. The “Official Narrative” of Industry Status In the Official Script, Intel is undergoing a “Great Renaissance.” They’ll tell you that with the ubiquity of AI PCs, the Client Computing Group (CCG) is recovering. They’ll say Data Center (DCAI) took a beating from NVIDIA and AMD but has “found a floor.” Media calls this “The Elephant Turning Around” and tells you to have patience, to invest for the “Long Term.”
4. The Valuation Trap Looking at fundamentals, Intel’s Market Cap hovers around $200B. For a company with $50B+ annual revenue, the Price-to-Sales (P/S) ratio is dirt cheap. Analysts scream: “Golden Value Opportunity! High Margin of Safety!” They draw pretty pie charts showing you the 5-year CAGR.
But… If you believe all that, congratulations, you are a certified Sheep 🐑. You think you’re analyzing a company? Wrong! You are becoming exit liquidity for the whales! Fundamentals are lagging! By the time the earnings report is out, the price has already moved 9,000 miles! You think $13.7B revenue is good news? What if the market priced in $14B? What if that $4.1B net income came from selling assets or tax credits? The biggest problem with Fundamental Analysis is that it is SLOW. While you are studying the Balance Sheet, Smart Money has already executed a Swing Trade, made 30%, and left! Young bloods, your youth is precious. You don’t have time to date a company, and you certainly don’t have time to wait for its “Renaissance.” You need Efficiency. You need Velocity. You need Now.
Chapter 2: The Awakening — Tear Up the Script, The Chart is God
But here’s how smart money actually thinks…
Shut up. Stop. Close the news. Close every news tab on your screen. Open your TradingView. Charts don’t lie. Charts are the footprints of billions of dollars of real money. Every candle, every line is crystallized greed and fear. Fundamentals can be faked, CEOs can lie, but Price Action is absolutely honest.
Why do we trust Technical Analysis (TA)? Because of Capital Efficiency. If you trust fundamentals and buy Intel, you might hold the bag for two years, survive endless shakeouts, and make 15%. If you trust TA, you enter at “Confirmed Breakout” and exit at “Trend Exhaustion.” You make the same 15%, but maybe in two weeks. Time Cost = Opportunity Cost. For us Gen-Z speculators, small capital isn’t the problem. The problem is locking capital in dead assets. We want the Sniper Shot—one shot, one kill, take the money and run.
Now, switch modes. Put on your tactical goggles. We are entering 【The Cold-Blooded Sniper】 mode. Here is Intel’s Alpha Map. Follow it. Don’t ask why.
Chapter 3: Decoding the Alpha Map (Technical Analysis Core)
1. Monthly Chart: The Floor of Gods
Monthly Chart – (INTC) Intel
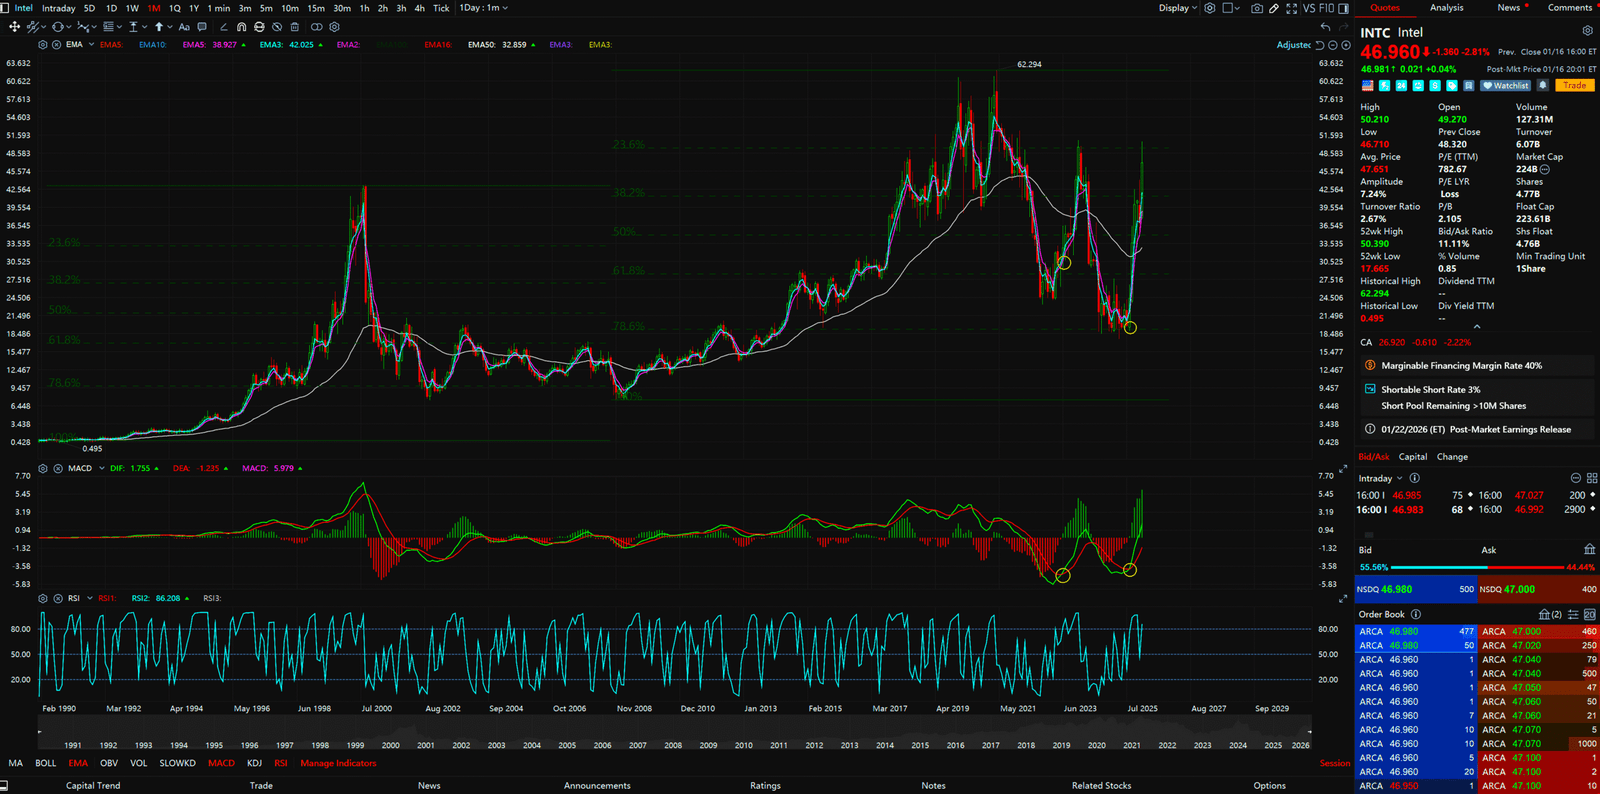
【Focus】: Fibonacci Retracement 78.6%
Look at the Monthly Chart. Don’t blink. You see Intel crashing from historical highs of $60+ over the last few years. Many caught the knife at $40 and died. Caught at $30 and died. Why? Because they don’t know Fibonacci.
- Sniper Logic: In a Macro Cycle, when a legitimate large-cap tech stock retraces to the Fibonacci 78.6% level, it is often the “Last Line of Defense.” This is not a coincidence; this is the iron law of Algo Trading.
- Status Decode: The chart clearly shows Intel’s price precisely touched the 78.6% retracement level and showed a massive Rejection (wick down, close up). What does that wick mean? It means Smart Money had billions in Buy Limit Orders waiting right there.
- Conclusion: The Monthly-level bottom is Confirmed. The downtrend is over. This isn’t a “bounce”; it’s a “Reversal.” 78.6% is God’s gift to you—the whale’s cost basis. If your entry is near this level, you are mathematically invincible.
2. Weekly Chart: Poseidon’s Pitchfork
Weekly Chart – (INTC) Intel
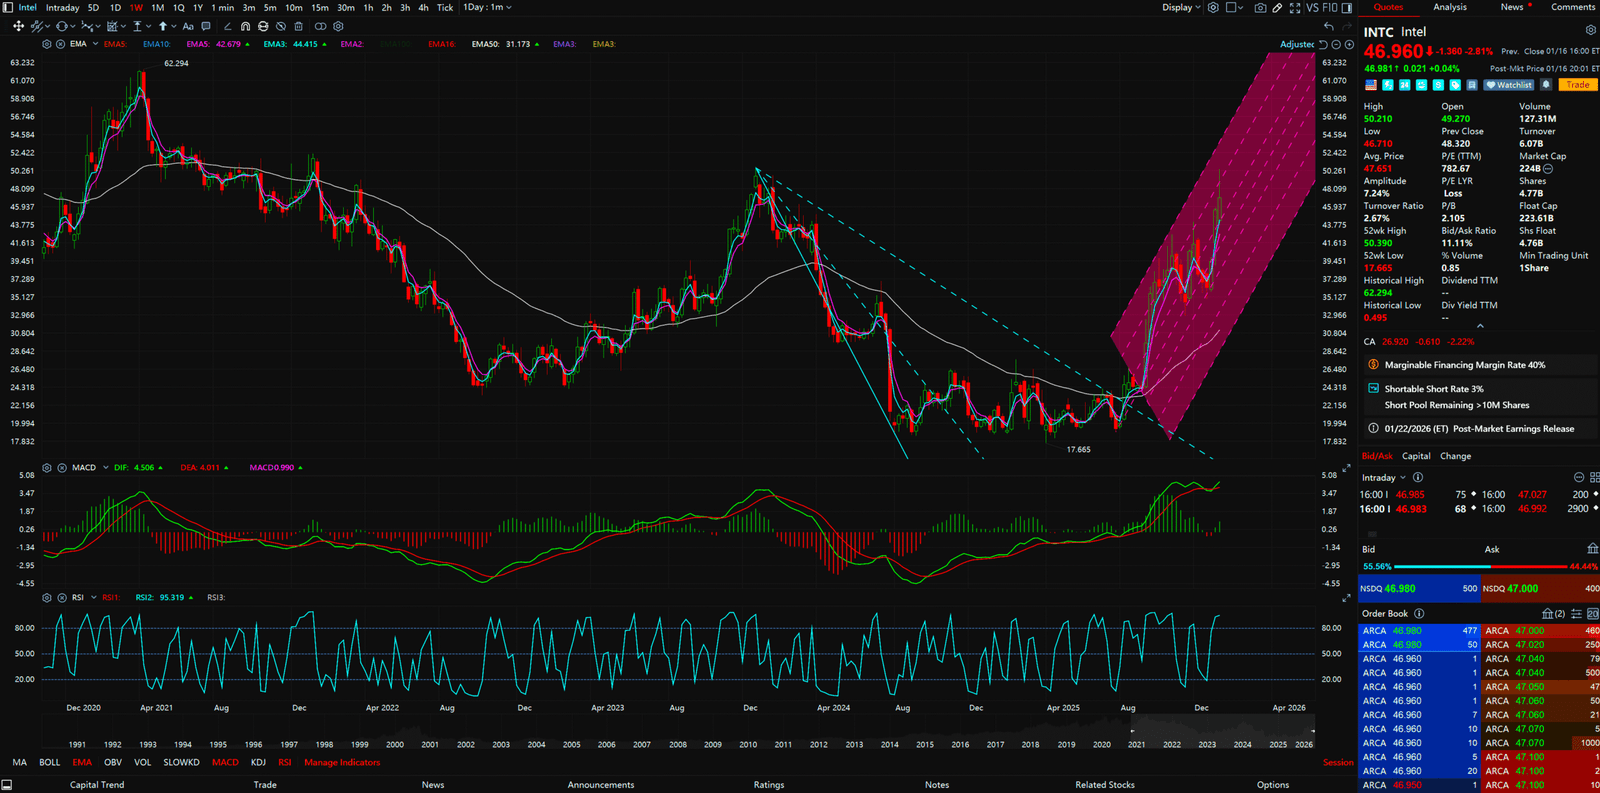
【Focus】: Pitchfork Channel
Switch to Weekly. If Monthly is too slow, Weekly tells you the next 6 months. Look at that upward channel. We have drawn a standard Andrew’s Pitchfork.
- Sniper Logic: Prices don’t move in straight lines; they oscillate within a channel. The Pitchfork’s Median Line is a magnet; the outer lines are electric fences.
- Status Decode: Intel is currently climbing perfectly along the lower half of the Pitchfork. Every touch of the lower rail finds support; every approach to the median line sees profit-taking. This is an extremely healthy, orderly Uptrend.
- Alpha Signal: As long as the price stays within the Pitchfork, we expect it to continue rising in the foreseeable future. The target? The upper rail. This isn’t a prediction; it’s geometry. If it breaks the lower rail, we stop-loss immediately (Capital Efficiency!), but right now, the Momentum is strong. The rocket still has plenty of fuel 🚀.
3. Daily Chart: The Trader’s Discipline
Daily Chart – (INTC) Intel
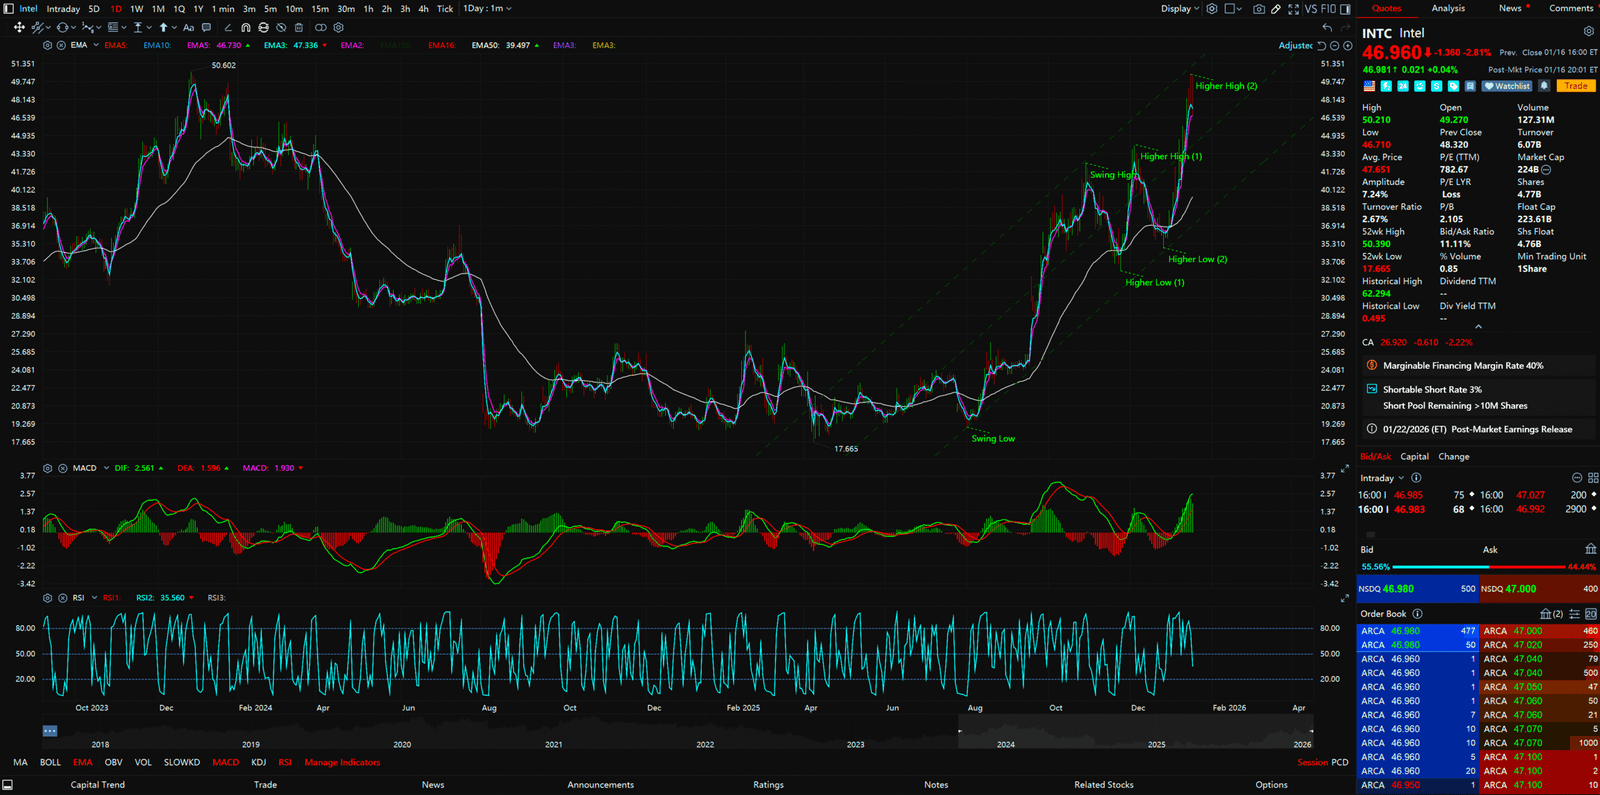
【Focus】: Market Structure (HH/HL) & Short-term Pullback
Finally, the Daily Chart. This decides if you click “Buy” today.
- Pattern Analysis: Classic Dow Theory uptrend. Higher Highs (HH), Higher Lows (HL). This is the definition of a Bull Market.
- Status Decode: Notice the chart. Intel just created its 2nd Higher High. RSI might be entering Overbought territory.
- Warning: Although the macro direction is up, as a cold-blooded sniper, we DO NOT chase at a Higher High (FOMO). That is what Sheep do.
- Tactical Execution: It is reasonable to expect a short-term, slight pullback in Intel’s price. This is normal profit-taking.
- Action Plan: Don’t rush in now. WAIT! Wait for the pullback to test the previous Higher Low or a Support Level. As long as the Structure isn’t broken (price doesn’t fall below the previous HL), the pullback is your Buy the Dip opportunity.
Mantra: Buy at HL, Sell at HH. Simple. Brutal. Effective.
Chapter 4: Conclusion
What is the conclusion? Intel is not a chip company; it is a Technical Setup.
- Monthly: 78.6% Iron Floor hit. Long-term safe.
- Weekly: Pitchfork Channel guiding the way up.
- Daily: Short-term overheated. Wait for the pullback, then strike.
Stop reading garbage news. Stop worrying about who the CEO is. Stare at the chart. When the Daily chart finishes its pullback and shows a reversal signal (like a Bullish Engulfing), PULL THE TRIGGER. This is Speculation. This is Alpha. Don’t be a Sheep. Be a Navigator. Welcome to the Awakening.
【Disclaimer】 The content herein is for educational purposes and reflects the author’s personal opinion only; it is not investment advice. All financial investments, including cryptocurrencies and stocks, carry significant risk, and you could lose your entire capital. To support this site, this article may contain affiliate links. While we strive for accuracy, we cannot guarantee all information is complete or error-free. Please conduct your own research and be fully responsible for your own investment decisions.
Source: