When you make a trade, you should have a clear target of where you expect to get out
William Delbert Gann – 1949
Lost in the Noise vs. Finding the Truth! Bitcoin’s (BTC) recent price action has left many investors bewildered, if not downright fearful. Open any news app, and you are bombarded with schizophrenic headlines: on one side, mainstream financial media screams about ETF outflows and rising macro risk-off sentiment, painting a picture of impending doom; on the other, on-chain analysts point to “smart money” accumulation and increasing whale balances.
For you—the individual investor trying to navigate this storm without getting wrecked—the question is burning: Is this a golden “buy the dip” opportunity where you should be greedy while others are fearful? Or is this the prelude to a capitulation event?
At Chart-Blitz, as former bank traders, we are not here to feed you ambiguous commentary or tell you to blindly follow “insider tips.” We are here to apply cold, hard institutional trading logic to dissect why “bottom fishing” is the fastest way to bankruptcy for retail traders. We will deep-dive into the following technical charts to explain why the 61.8% Fibonacci level might be a carefully engineered trap, and how to use chart “confirmation” to trade the real trend, rather than becoming the market’s exit liquidity.
【Analysis Baseline Statement】
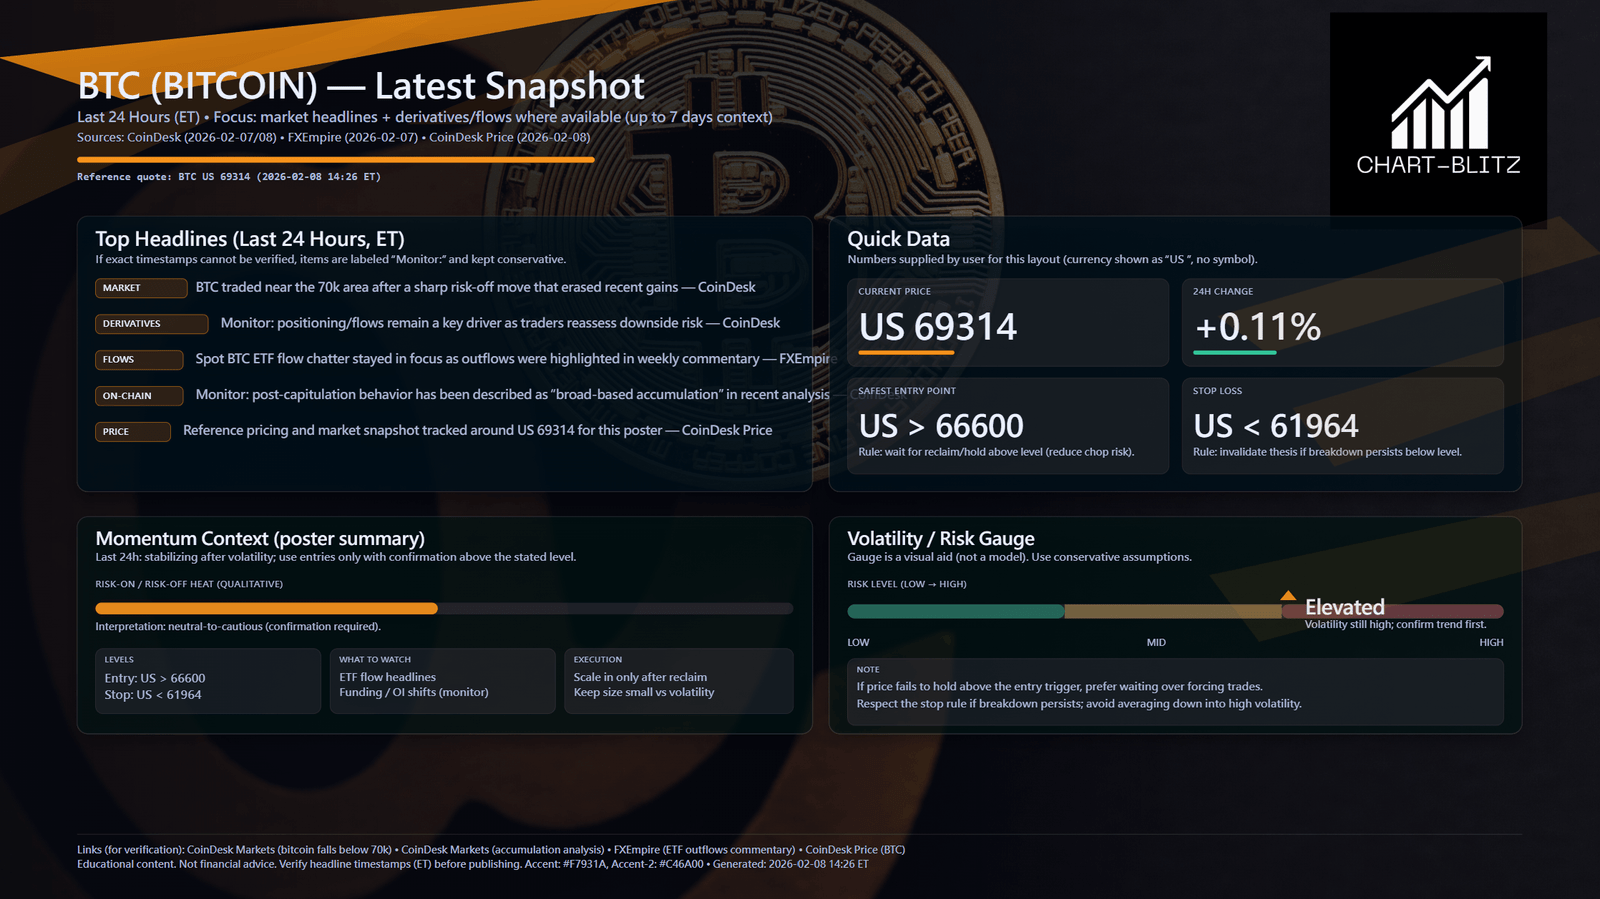
All technical analysis below is based on the price snapshot locked on 2026-02-08, 14:26 (ET): BTC = US 69,314. This snapshot provides a stable reference point. All support, resistance, and projected paths are relative to this baseline. Market prices change instantly; please view this report as an “analytical map,” not a real-time quote. By the time you read this, prices may have moved, but the underlying logic and key levels remain valid.
Chapter 1: Ripping Off the Mask of News: Why Fundamentals are a “Rearview Mirror”
Before diving into the charts, let’s quickly scan the fundamental battlefield to understand the context of market sentiment.
Over the last 24 hours, the market has sent conflicting signals. Reports from CoinDesk and FXEmpire highlight a sharp risk-off move, erasing recent gains as BTC trades near the 70k area. Crucially, Spot BTC ETFs have seen significant outflows. In the eyes of institutions, ETF outflows represent Wall Street “de-risking”—a tangible bearish signal.
Conversely, on-chain monitoring describes post-capitulation behavior as “broad-based accumulation.” This implies some capital is buying the dip.
This “fundamental divergence” is fatal for retail traders. News tells you what happened (ETF selling vs. On-chain buying), but it doesn’t tell you how to trade. If you sell on ETF news and buy on on-chain data, you get chopped out on both sides. This is where technical analysis reigns supreme—price action never lies, as it reflects the aggregate outcome of all market participants (whether ETF algos or on-chain whales).
Chapter 2: Weekly Chart: Structural Weakness & The Fibonacci Lure
The following part is the core of our analysis. Forget the superficial indicators you’ve learned; follow our perspective to decode the market structure provided in the charts
Weekly Chart: Structural Weakness & The Fibonacci Lure
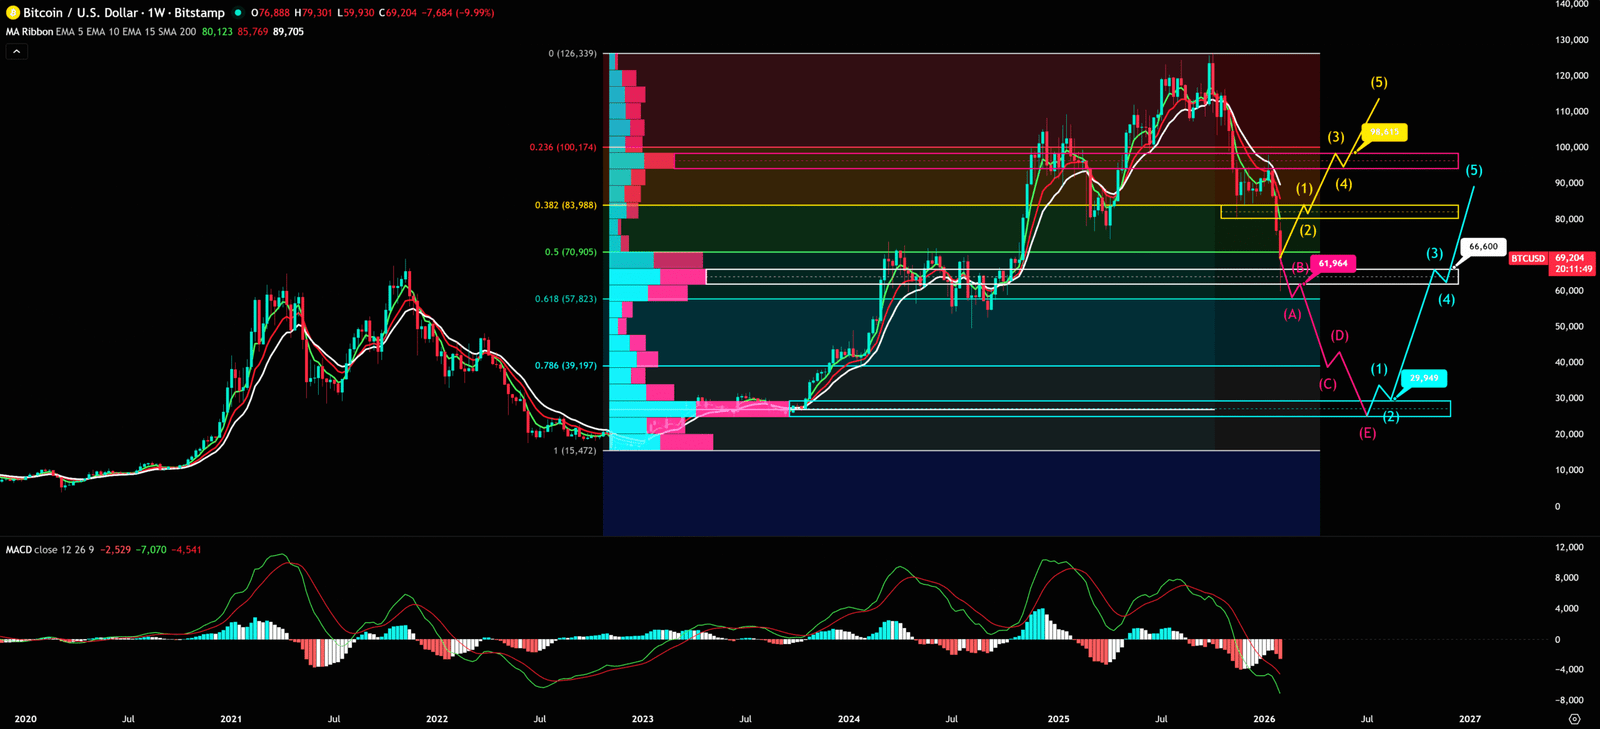
The Weekly Chart reveals a textbook “Lower Highs, Lower Lows” downtrend since the October 2025 peak (US 126,199). This is the most basic, yet most powerful bearish structure.
The current market focus—and the biggest trap—is that price is approaching the US 60,000 psychological level. Based on the long-term rally from the late 2022 bottom (US 13,600) to the 2025 peak, US 60,000 aligns perfectly with the 61.8% Fibonacci Retracement.
- The Retail Trap: “It’s dropped so much and hit the 61.8% golden ratio. Textbooks say this is strong support. I must All-in and buy the bottom!”
- The Institutional Reality: Bankers don’t trade “magic numbers”; they trade “volume distribution.”
- MACD Momentum: The Weekly MACD remains submerged below the zero line with the histogram widening downwards. This indicates extreme bearish momentum. It’s like a truck speeding downhill; you don’t jump in front of it just because you see a “61.8km” sign on the road.
- VPFR Supply Overhang: The Volume Profile Fixed Range (VPFR) shows a massive node of volume traded around US 64,302. This means there are a lot of “bag holders” trapped at 64k. As long as price remains below 64,302, these holders create immense selling pressure—every time price rallies near this level, they sell to break even.
- Verdict: On a weekly scale, unless 64k is reclaimed, the so-called 61.8% support is merely a potential “catching a falling knife” scenario.
Weekly Timeframe for BTC (Bitcoin)
Chapter 3: Daily Chart: The Volume Profile Warning & Trend Destruction
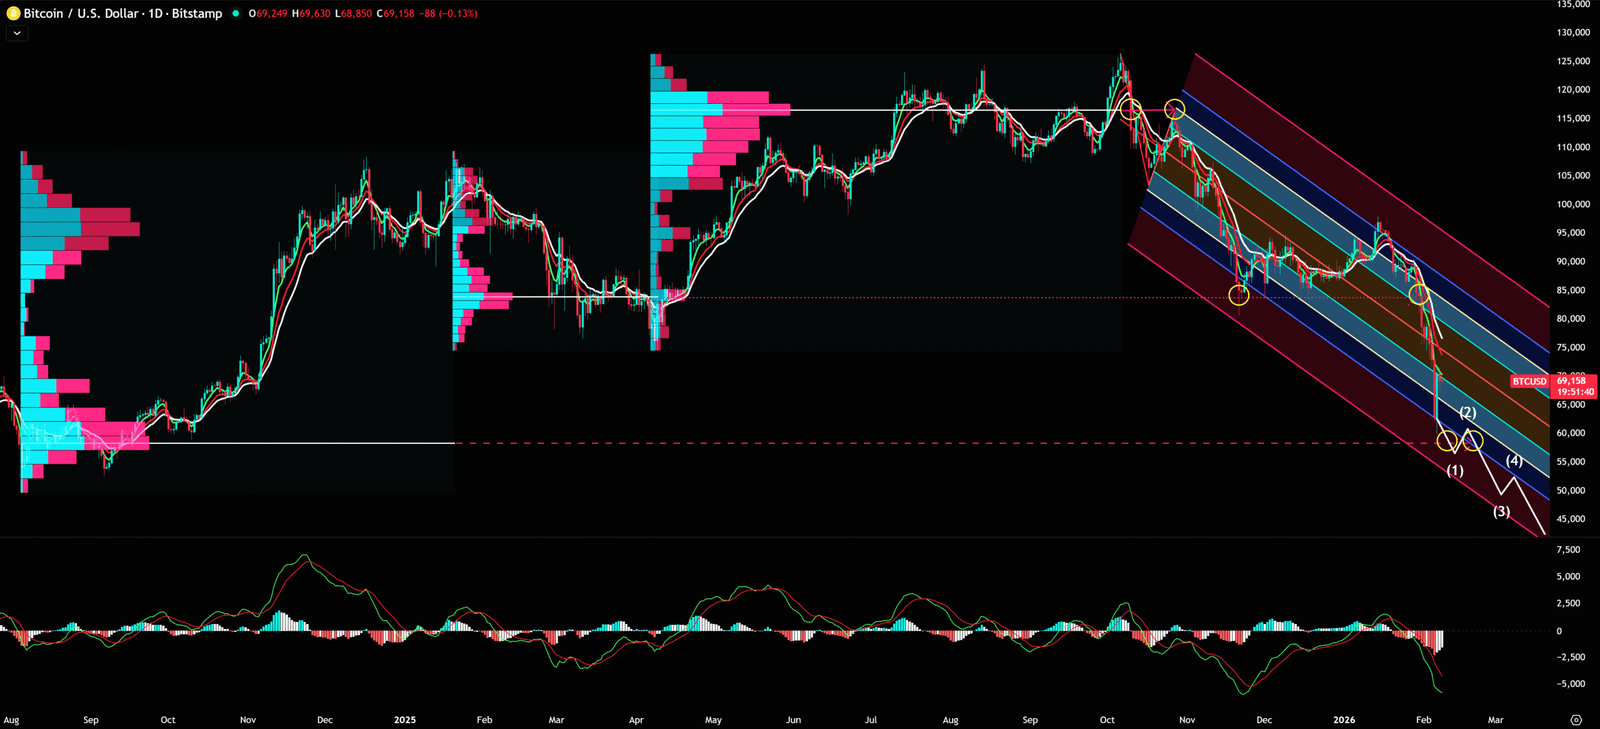
The Daily Chart paints a grimmer picture. We must look at a “crime scene” that has already occurred: BTC officially broke down below the major US 84,000 VPFR support shelf on January 31, 2026.
This is a devastating technical signal. In institutional trading, breaking a High Volume Node signifies a “Regime Shift.” US 84,000 was once strong support; it has now flipped into an iron wall of resistance.
Price (currently 69k) is drifting in a “no-man’s land,” heading toward the next lower VPFR support node. With the Daily MACD also underwater, momentum favors the bears. While a short-term “Dead Cat Bounce” is possible, without structural repair, rallies are for exiting, not entering.


Daily Timeframe for BTC (Bitcoin)
Chapter 4: Synthesis & Unique Insight: The Banker’s Art of Confirmation
Here lies the critical difference between a banker and a retail trader, and the most important lesson for you today: Retail tries to PREDICT the bottom; Bankers wait to CONFIRM the reversal.
Retail asks: “Is 60k the bottom?” Bankers ask: “Has price shown me evidence of a reversal?” An old adage in technical analysis states: “Until confirmed, do not buy.”
BTC is currently at a binary decision point on the Daily Chart. We don’t need to guess; we just watch two specific levels. These are our defined “Triggers”:
1. The Danger Zone (Stop Loss / Short): US < 61,964 This is the line in the sand and the bottom of the next support cluster.
- Logic: A daily close below US 61,964 validates the loss of the 60k handle, and the downtrend will accelerate.
- Retail Mistake: Holding onto losing positions below this level, hoping “it must bounce.”
- Institutional Action: Strict stop-loss execution or initiating short positions. For holders, this is an invalidation level—hope is not a strategy.
2. The Safe Entry (Long): US > 66,600 This is the institutional threshold for re-entry. Even though the current price (69,314) is above this, volatility is high.
- Logic: Only if price holds above US 66,600 and demonstrates a “3-Candle Confirmation”—three consecutive bullish candles holding above the level—can we consider the trend reversed.
- Why 3 Candles? Because single candles are often “Fakeouts.” Institutions manage large capital; they prefer to buy slightly higher with trend confirmation than to gamble on a bottom.
- Retail Mistake: FOMO buying on the first green candle, only to get wrecked the next day.
Key Takeaways
Summary / Key Levels: Stop guessing. Let the market dictate. Here is my operational plan:
⛔ Critical Support (Stop Loss / The Line of Death): < US 61,964
- This is the final line of defense. If the Daily candle closes below US 61,964, the downtrend accelerates into a vacuum. (Invalidation level; execute mercilessly)
- Action: If you are holding, this is your hard Stop Loss. Do not hope. Do not pray. If this breaks, the floor is gone.
🛡️ The Safe Entry (The Banker’s Trigger): > US 66,600
- Want to go Long? Not yet. Sit on your hands. Unless BTC can break US 66,600 with a strong bullish candle and hold above it for 3 consecutive days.
- Logic: Only a reclaim of this level proves that the overhead “bag holders” have been absorbed. That is the only high-probability entry.
Our goal is not to provide a crystal ball, but to offer a clear, logical, and actionable framework by simplifying professional analysis.
Conclusion: Hunter or Prey?
The chart structure shows an alignment of bearish trends on both Weekly and Daily frames. While the 60k Fibonacci level exists, entering without confirmation is a high-risk gamble. We are currently in “Defense” mode, not “Offense”. Instead of gambling, wait ! Remember, Cash is a position too.
Unlocking Technical Analysis: Power Moves with Diagrams !
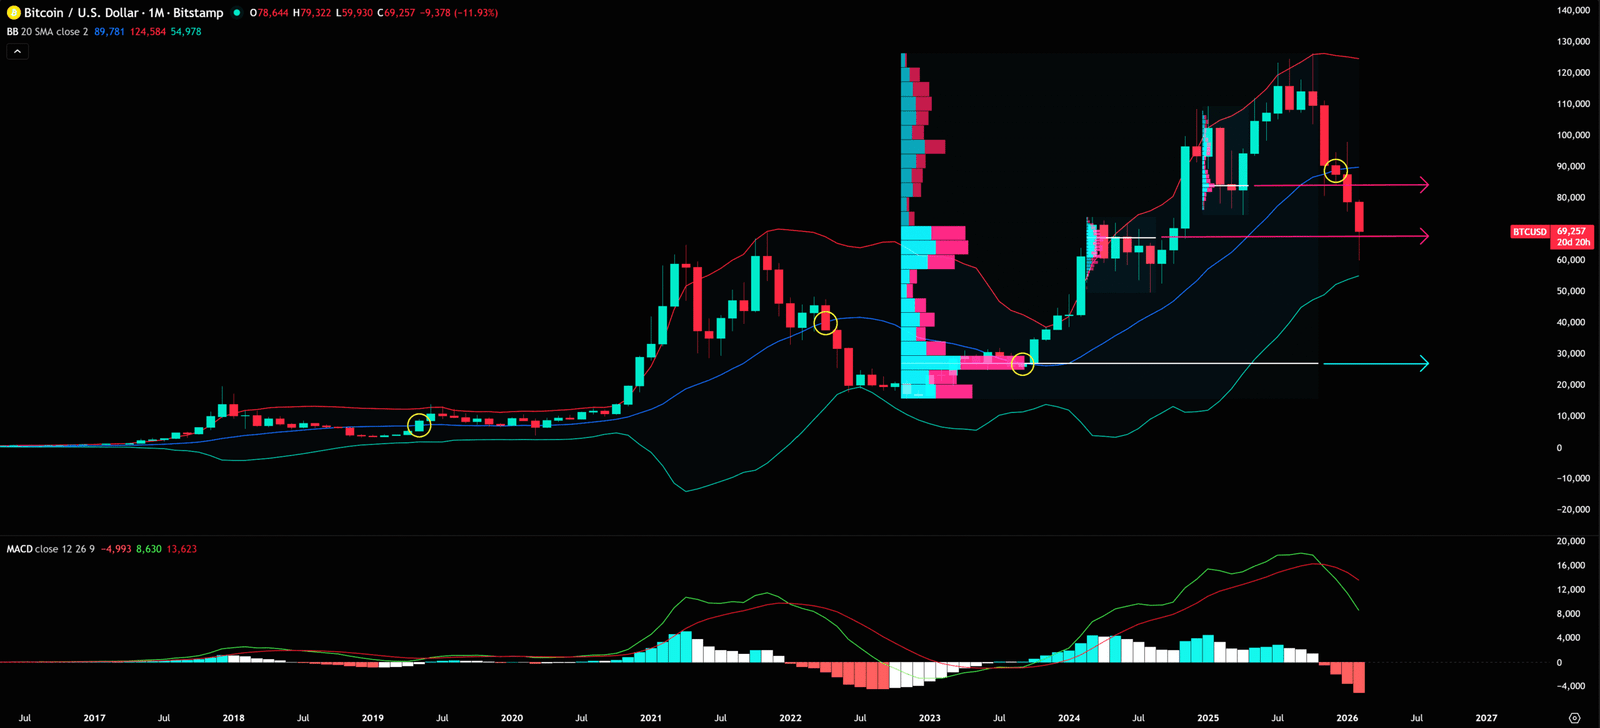
Monthly Timeframe for BTC (Bitcoin)
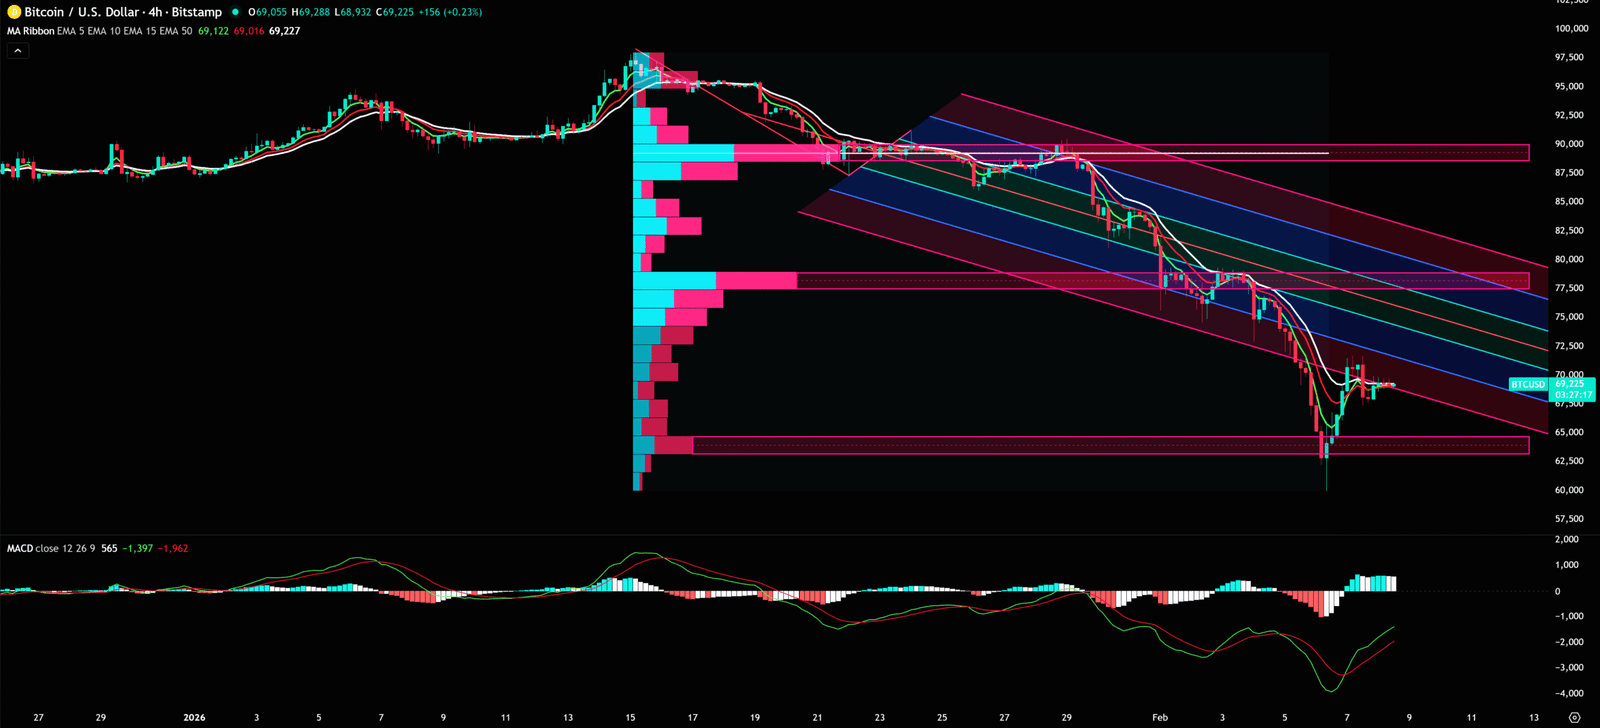
4-Hour Timeframe for BTC (Bitcoin)
Charts don’t lie, but you have to learn their language.
Want to see our full, interactive chart breakdown? If you want to learn how to draw Fibonacci Retracement Ratio yourself, identify S/R Flips, and stop trading blind. Please browse the following『Further Reading』links. Fundamental news tells you what happened. Technical analysis predicts what will happen. To master the professional framework that separates market signal from noise, explore our exclusive models at www.chart-blitz.com.
Further Reading:
- https://www.chart-blitz.com/macd-mastery-decode-market-swings-like-a-pro-dont-miss-out/
- https://www.chart-blitz.com/volume-profile-vpfr-find-the-real-battle-zones-on-the-chart/
- https://www.chart-blitz.com/fibonacci-retracement-the-magic-numbers-behind-every-support-resistance/
- https://www.chart-blitz.com/bollinger-bands-the-ultimate-signal-for-breakouts-volatility/
- https://www.chart-blitz.com/auto-pitchfork-draw-trend-reversals-like-a-pro-no-experience-needed/
【Disclaimer】 The content herein is for educational purposes and reflects the author’s personal opinion only; it is not investment advice. All financial investments, including cryptocurrencies, carry significant risk, and you could lose your entire capital. To support this site, this article may contain affiliate links. While we strive for accuracy, we cannot guarantee all information is complete or error-free. Please conduct your own research and be fully responsible for your own investment decisions.