When you make a trade, you should have a clear target of where you expect to get out
William Delbert Gann – 1949
News is the “Sleeping Pill” for Retail In the last 24 hours, if you opened any crypto news outlet, you’d be bombarded with headlines about the “Hegota Upgrade Roadmap” and “Improved Risk Appetite.” For a market novice, these headlines act like a shot of adrenaline: “Wow! Tech upgrades, good sentiment… ETH must be mooning! I need to buy NOW!”
However, as an ex-bank trader who has survived the shark tank for 20 years, I see the exact opposite picture. When the news screams “BUY,” it’s often because the whales are preparing to “SELL” to you. Today, I’m cutting through the vague nonsense. I will use cold, brutal technical data (VPFR + Fibonacci) to expose the “Liquidity Hunt” hidden behind this “good news” and tell you exactly why $1,995 is the perfect “Bull Trap” in the eyes of smart money.
【Analysis Baseline Statement】
All technical analysis below is based on the price snapshot locked on 2026-02-14, 02:35 (EST): ETH = 1,995.00 USD. This snapshot provides a stable reference point for analysis. All support, resistance, and projected paths are relative to this benchmark. Market prices change instantly; please view this report as an “analytical map,” not a real-time quote.

Chapter 1: Catalyst & Fundamental View: Reading Between the Lines
Media outlets (like CoinMarketCap, The Block) are hyping up the “Hegota” upgrade, creating a “Fundamentally Bullish” atmosphere.
- Novice Mindset: “Upgrade = Better Tech = Price Up.” Linear, naive thinking.
- Banker Mindset: Pay close attention to the devil in the details from CoinDesk — “Traders remained sensitive to liquidation pockets.” Translated into plain English: “Whales are eyeing your stop-loss levels to take profit.” In the institutional world, news is a tool to create liquidity. When good news pushes the price up, retail chases, allowing whales to dump their “heavy bags” at higher prices. The current “bounce” is likely a carefully orchestrated “False Breakout,” designed to test overhead resistance and squeeze retail shorts.
Chapter 2: Multi-Timeframe Technical Deep Dive: Charts Don’t Lie
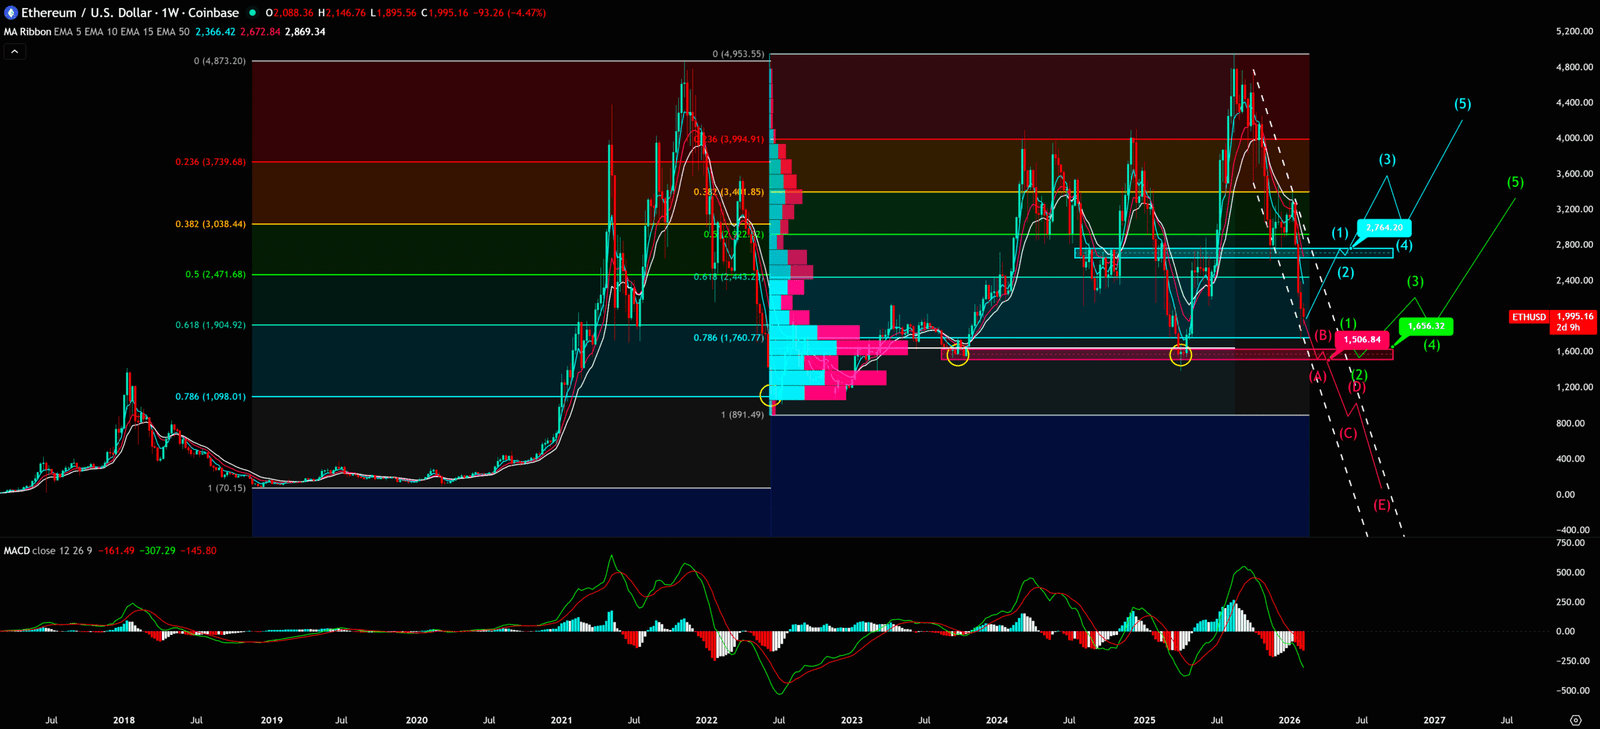
Weekly Chart: A Textbook “Weak” Structure Zoom in on the current weekly chart. This is absolutely not what a bull market looks like.
- Structural Breakdown: ETH is exhibiting a classic “Lower Highs, Lower Lows” pattern. Every rally peaks lower than the last, and every drop breaks a new low. This is the definition of a bear market.
- The Last Stand (Fib 0.786): Using the long-term rally from 2022 to 2025 as a baseline, I’ve drawn the Fibonacci Retracement. The current price of $1,995 is inching dangerously close to the 0.786 retracement level (approx. $1,742 – $1,760 zone). Why is 0.786 critical? In trading desks, we call this the “Last Line of Defense.” Once 0.786 breaks, the entire long-term uptrend is considered “invalidated,” and price often freefalls to the 100% retracement (the starting point).
- The Volume Gap: Combined with the Volume Profile (VPFR), we see a massive cluster of historical volume near $1,647.53. This is the bulls’ last fortress. If this fails, below lies a massive “Vacuum Zone” where price can drop like a stone with zero resistance
Weekly Timeframe for ETH (Ethereum)


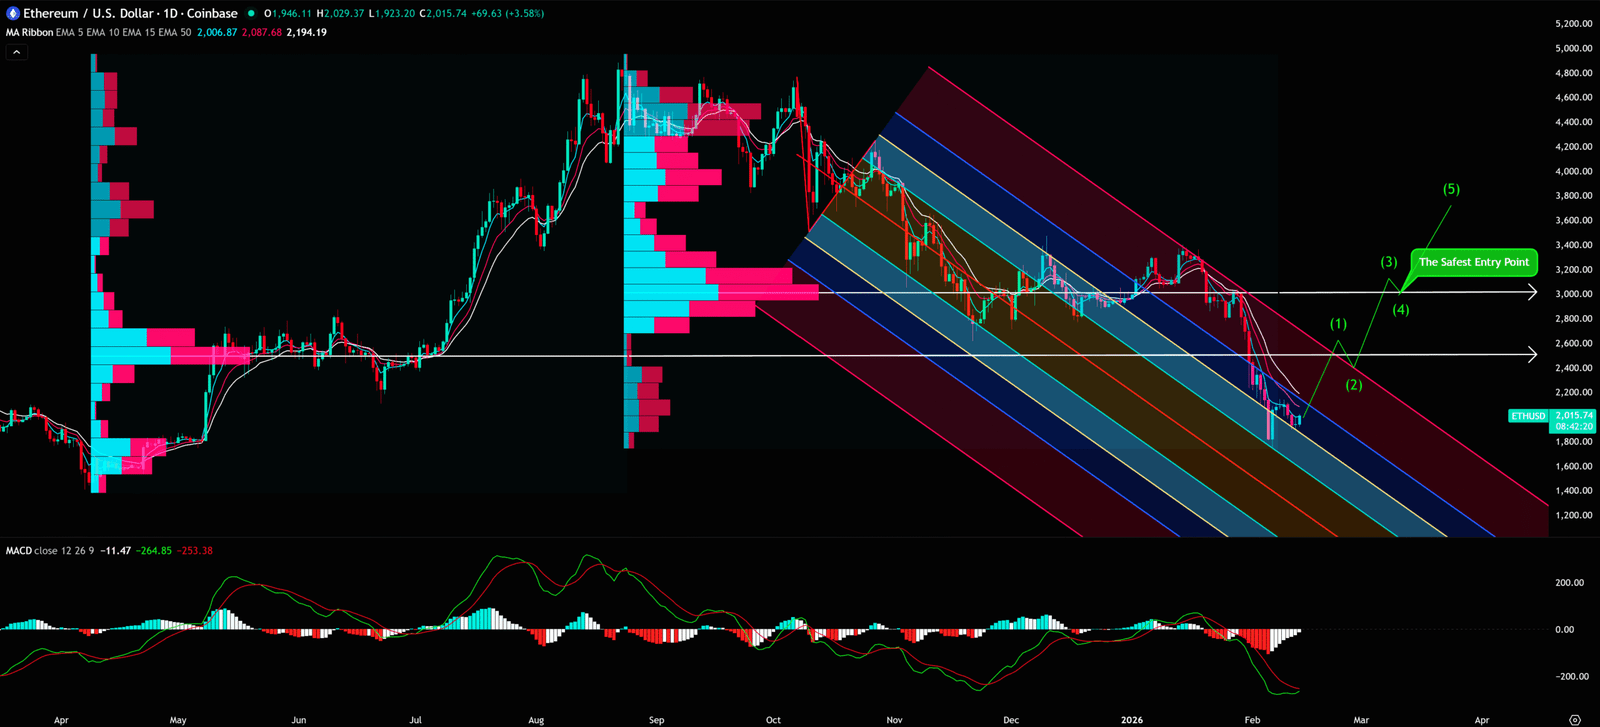
Daily Chart: The Two “Trapped Zones” You Can’t See Many lose money because they only look at the current price, ignoring the “heavy bags” (trapped buyers) above. Using VPFR, we identified two fatal “traps” left behind by whale distribution:
- Trapped Zone 1 (Lost $3,027 – Heavy Resistance): Back in Nov 2025, ETH broke below the major volume node at $3,027.65. Many retail traders bought the dip there and are now trapped. Their only wish is to “break even.” So, as soon as price approaches $3,000, these people will sell frantically to escape, creating massive resistance.
- Trapped Zone 2 (Lost $2,499 – Fresh Supply Zone): More recently in early Feb 2026, another key support at $2,499.29 was lost. According to the “Support and Resistance Reversal Principle,” a broken floor becomes a concrete ceiling. Conclusion: Any bounce that fails to reclaim $2,499 is simply another opportunity for whales to short.
Daily Timeframe for ETH (Ethereum)
Chapter 3: Synthesis & Unique Insights: The Banker’s Guide to “Buying High to Buy Safe”
Both Weekly and Daily charts show high “Trend Alignment” — Direction: DOWN. The most common rookie mistake is “Greed for Cheap Prices.” You think $1,995 is cheap? Whales might be eyeing $1,500 or lower. The biggest difference between a banker and a retail trader is: We don’t guess the bottom; we wait for confirmation. We would rather buy higher after the trend is confirmed than try to catch a falling knife. Because “Certainty” is worth more than “Price.”
- Key Support (The Vacuum): $1,506.84
- WARNING: If the Daily candle closes below this level, execute stop-losses immediately. Do not fantasize. Do not “wait and see.” Once this level breaks, support is non-existent, and Panic Selling could evaporate 30-50% of value instantly.
- Key Resistance (The Banker’s “Safe Entry”): $2,764.20
- Actionable Strategy:
- Holders (Bag Holders): Strictly adhere to the $1,506.84 stop-loss. Live to fight another day. Better to preserve capital than to hold a losing position for years.
- Non-Holders (FOMO Buyers): WAIT! WAIT! AND WAIT!
- As the old adage goes: “No confirmation, no trade.”
- The safest entry is NOT now. Wait for the price to break out and stabilize above $2,764.20 (confirmed by at least 3 bullish candles).
- The Mindset: Why wait for $2,764? Because reclaiming this level means the overhead supply at $2,499 has been absorbed, and whales are back in control. You pay a $700 premium, but you are buying “Trend Insurance,” avoiding the gamble at $1,995
- Actionable Strategy:
Key Takeaways
Summary / Key Levels: Stop guessing. Let the market dictate. Here is my operational plan:
⛔ Critical Support (Stop Loss / The Line of Death): < US 1506.84
- This is the final line of defense. If the Daily candle closes below US 1506.84, the downtrend accelerates into a vacuum. (Invalidation level; execute mercilessly)
- Action: If you are holding, this is your hard Stop Loss. Do not hope. Do not pray. If this breaks, the floor is gone.
🛡️ The Safe Entry (The Banker’s Trigger): > US 2764.2
- Want to go Long? Not yet. Sit on your hands. Unless BTC can break US 2764.2 with a strong bullish candle and hold above it for 3 consecutive days.
- Logic: Only a reclaim of this level proves that the overhead “bag holders” have been absorbed. That is the only high-probability entry.
Our goal is not to provide a crystal ball, but to offer a clear, logical, and actionable framework by simplifying professional analysis.
Conclusion: Hunter or Prey?
The chart structure shows an alignment of bearish trends on both Weekly and Daily frames. While the US 1760 Fibonacci level exists, entering without confirmation is a high-risk gamble. We are currently in “Defense” mode, not “Offense”. Instead of gambling, wait !
Remember, Cash is a position too.
Unlocking Technical Analysis: Power Moves with Diagrams !
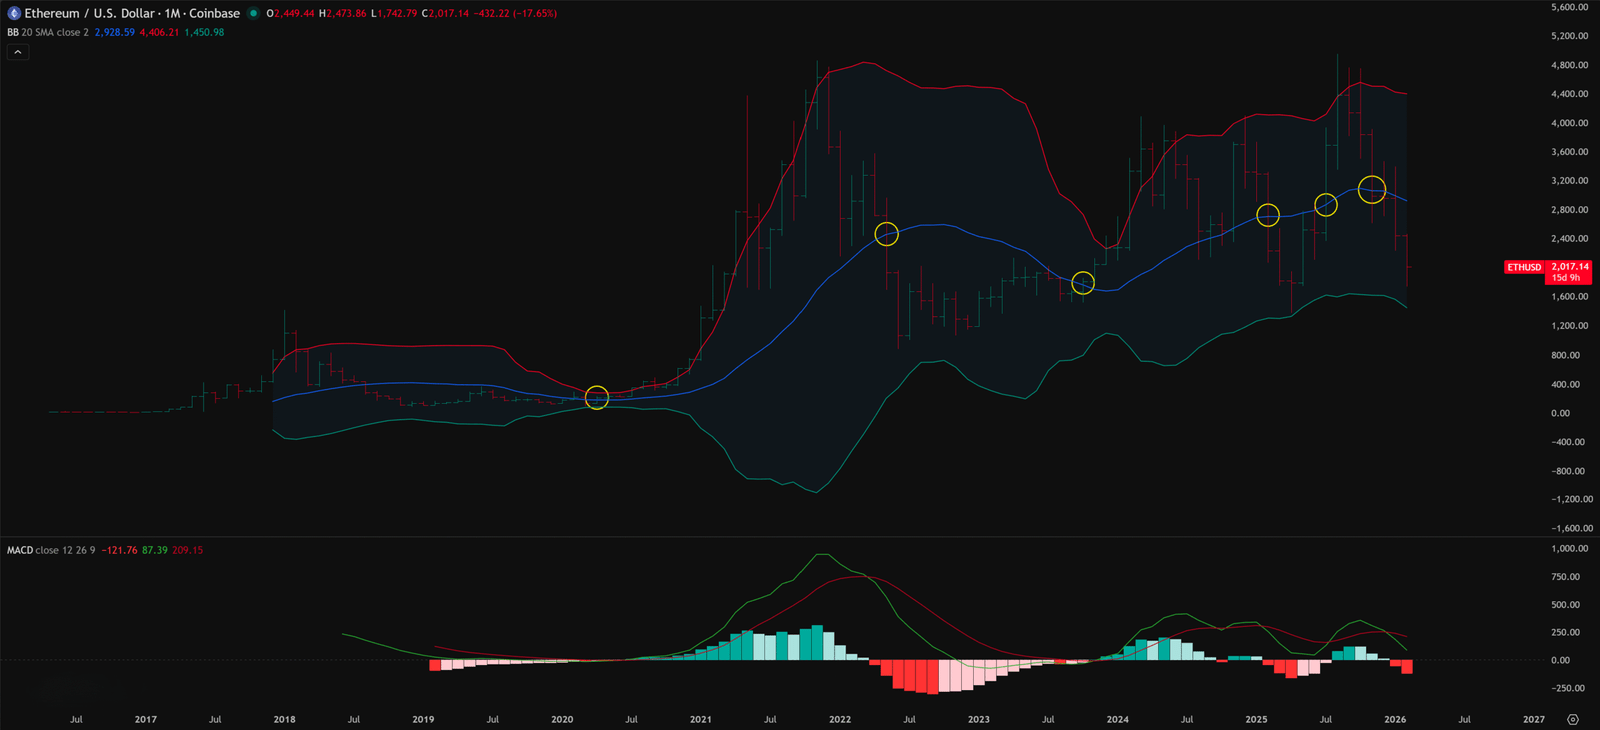
Monthly Timeframe for ETH (Ethereum)
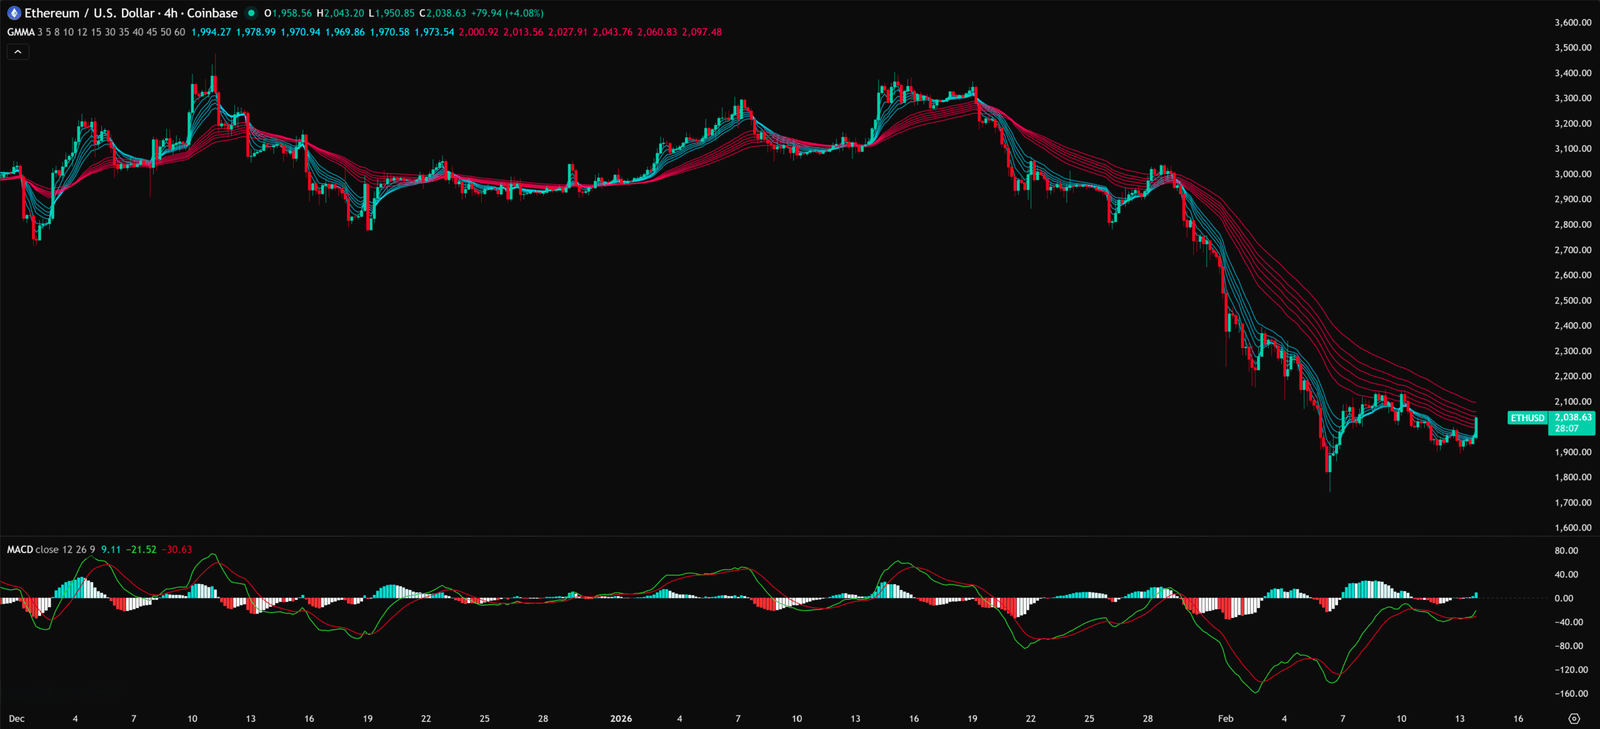
4-Hour Timeframe for ETH (Ethereum)
Charts don’t lie, but you have to learn their language.
Want to see our full, interactive chart breakdown? If you want to learn how to draw Fibonacci Retracement Ratio yourself, identify S/R Flips, and stop trading blind. Please browse the following『Further Reading』links. Fundamental news tells you what happened. Technical analysis predicts what will happen. To master the professional framework that separates market signal from noise, explore our exclusive models at www.chart-blitz.com.
Further Reading:
- https://www.chart-blitz.com/macd-mastery-decode-market-swings-like-a-pro-dont-miss-out/
- https://www.chart-blitz.com/volume-profile-vpfr-find-the-real-battle-zones-on-the-chart/
- https://www.chart-blitz.com/fibonacci-retracement-the-magic-numbers-behind-every-support-resistance/
- https://www.chart-blitz.com/bollinger-bands-the-ultimate-signal-for-breakouts-volatility/
- https://www.chart-blitz.com/auto-pitchfork-draw-trend-reversals-like-a-pro-no-experience-needed/
- https://www.chart-blitz.com/gmma-unveiled-read-the-whales-moves-and-stop-being-the-exit-liquidity/
【Disclaimer】 The content herein is for educational purposes and reflects the author’s personal opinion only; it is not investment advice. All financial investments, including cryptocurrencies, carry significant risk, and you could lose your entire capital. To support this site, this article may contain affiliate links. While we strive for accuracy, we cannot guarantee all information is complete or error-free. Please conduct your own research and be fully responsible for your own investment decisions.