Okay, all you sharp traders, Crypto OGs, and friends looking to crush it in the markets! Tired of indicators so complicated they make your eyes glaze over? Today, we’re breaking down a killer tool that’s super intuitive and tells you the direction at a glance – the Supertrend indicator! Think of it like the “traffic light” for your trading world, helping you know when to Go (green light, bullish) and when to Stop (red light, bearish)!
What the heck is Supertrend? Why’s it so popular?
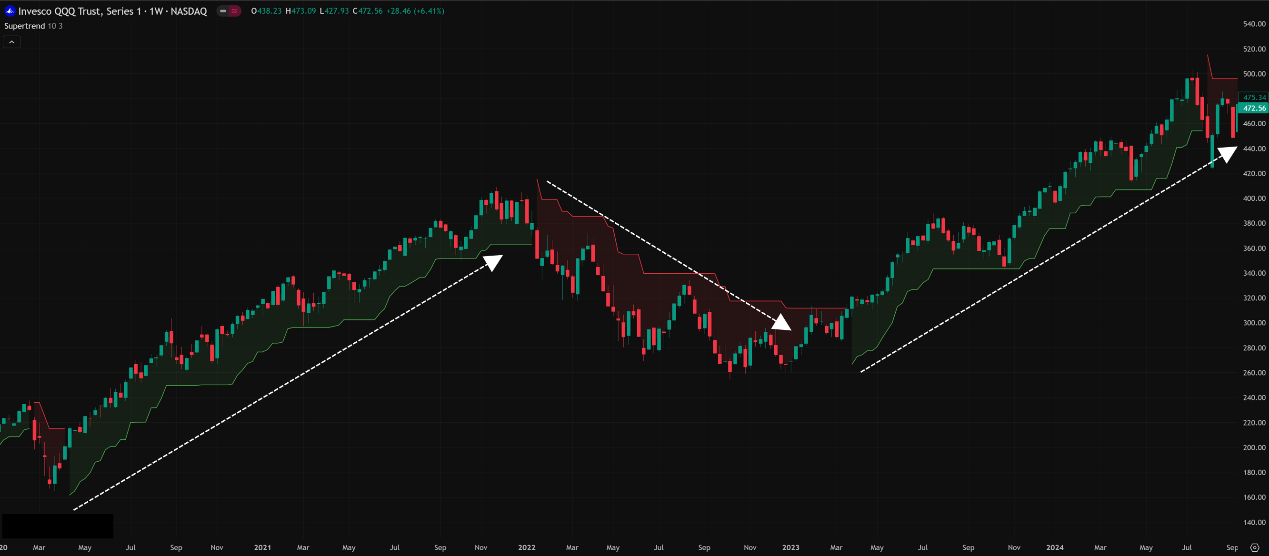
Supertrend is a trend-following indicator. Its best feature is its extreme simplicity: on your chart, it draws just one line that flips between green (usually below the price) and red (usually above the price).
- Green Line: Means we’re currently in an uptrend.
- Red Line: Means we’re currently in a downtrend.
- Color Flip: That’s your potential trend change signal!
「Supertrend: Intuitive Traffic Light Trend Indicator」
Its core value comes from:
- Clear Directional Signals: Red/green distinction is obvious.
- Dynamic Stop-Loss Reference: The line itself can serve as a trailing stop-loss reference that moves with the trend.
- Incorporates Volatility: This isn’t just a simple moving average. Its calculation includes ATR (Average True Range), meaning its stop/reversal level automatically adjusts based on market volatility. High volatility? The line moves further away. Low volatility? It stays closer. Pretty smart!
Supertrend’s Origin Story & Design: Why Does It Work?
Supertrend was created by French technical analyst Olivier Seban. His design concept was straightforward: create an easy-to-use tool that combines market volatility to identify trends and set stops.
How’s it calculated? (Don’t worry, just get the concept)
Supertrend is essentially based on upper and lower bands calculated using ATR:
- Calculate a “base midline” (usually (High + Low) / 2).
- Calculate the ATR (Average True Range).
- Upper Band = Base Midline + (Multiplier * ATR)
- Lower Band = Base Midline – (Multiplier * ATR)
The logic goes like this:
- If the price closes above the previous Upper Band, it potentially signals a shift to an uptrend (plots a green line, referencing the lower band, but only moves up or flat).
- If the price closes below the previous Lower Band, it potentially signals a shift to a downtrend (plots a red line, referencing the upper band, but only moves down or flat).
- As long as the trend continues, the line trails the price (but never moves down in an uptrend or up in a downtrend), acting as dynamic support/resistance.
Supertrend Basic Plays (Quick Start for Newbies):
- Read the Signals (Signal Interpretation):
- Supertrend flips from Red to Green → Potential Buy Signal.
- Supertrend flips from Green to Red → Potential Sell/Short Signal.
- Rule of Thumb: Green light go, red light stop.
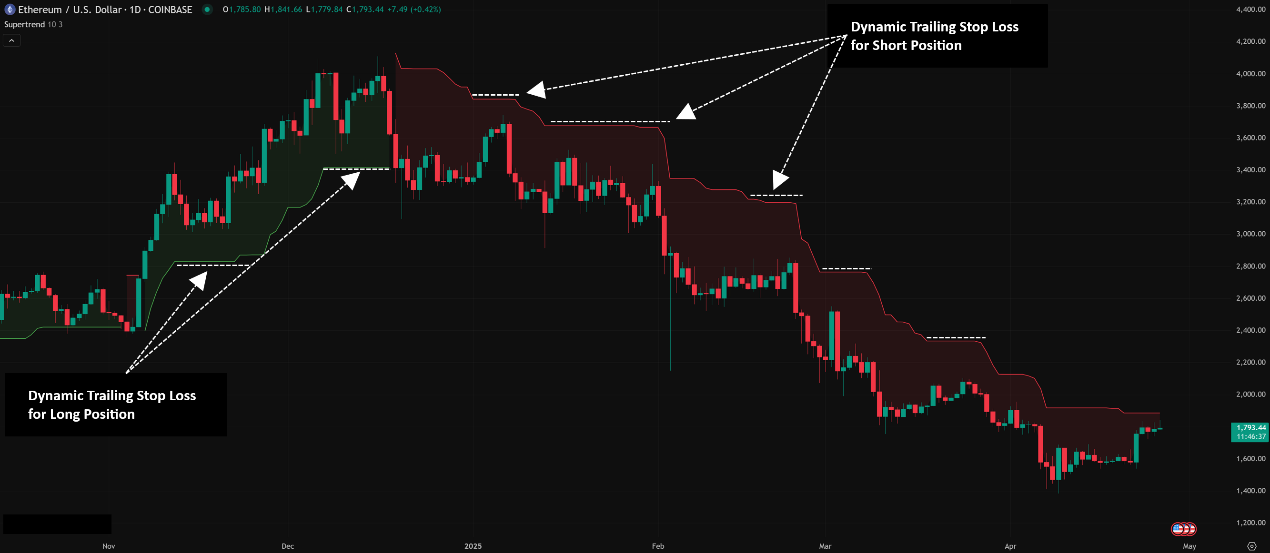
- Dynamic Trailing Stop Loss:
- After going Long (Buy), you can set your stop-loss slightly below the green Supertrend line. As the green line moves up, your stop moves up too, locking in profits.
- After going Short (Sell), you can set your stop-loss slightly above the red Supertrend line. As the red line moves down, your stop moves down too.
「Supertrend as a Dynamic Trailing Stop Loss」
Supertrend Advanced Plays & Parameter Breakdown (Pro Training Ground):
Supertrend looks simple, but the devil’s in the details, especially the parameters! Traders in different markets and with different styles use different settings.
Core Parameters:
- ATR Period / Length: How many candles are used to calculate ATR. The default is usually 10.
- Shorter Period (e.g., 5, 7): ATR reacts faster, more sensitive to recent volatility. Supertrend line might be closer to price, signals potentially earlier, but also more false signals (whipsaws).
- Longer Period (e.g., 14, 20): ATR is smoother, less sensitive to short-term noise. Supertrend line might be further from price, signals later, but filters more false signals, better for catching longer trends.
- Multiplier / Factor: How many multiples of ATR are used for the band width. The default is usually 3.
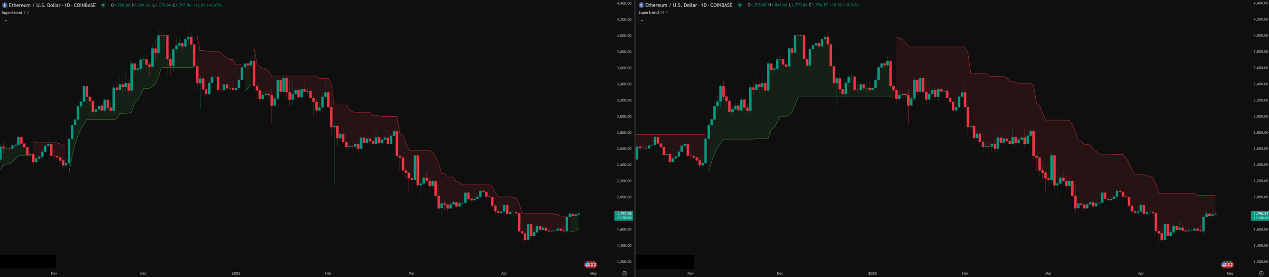
- Smaller Factor (e.g., 1.5, 2): Narrower bands, Supertrend line closer to price. Signals are extremely sensitive, flip quickly, but you’ll get so many false signals it’ll make your head spin, especially in ranges.
- Larger Factor (e.g., 4, 5): Wider bands, Supertrend line further from price. Signals are very slow, needing a big price move to flip. Avoids lots of chop, good for catching very long major trends, but might miss a large part of the move, or the stop distance is too wide.
「Parameter Impact: Sensitive (Left) vs. Smoother/Slower (Right)」
Global Trader Parameter Analysis & “Hottest” Combo Breakdown:
There’s no absolute standard for Supertrend parameters; it really depends on the market and personal style.
- US/EU Stock / Index Traders (Relatively Stable Markets):
- Might lean towards the default (10, 3) or slightly tweak the ATR period (e.g., 12, 3 / 14, 3) to fit specific stock characteristics. Goal: Catch mid-to-long term swings.
- Forex Traders:
- Volatility varies widely between pairs. For high-volatility pairs (e.g., GBP/JPY), might use longer ATR periods or larger factors (e.g., 14, 3 or 10, 4) to filter noise. For low-volatility pairs (e.g., EUR/CHF), might stick to default or slightly tighter (e.g., 10, 2.5).
- Crypto Traders (High Volatility Markets):
- This is where it gets tricky! Crypto’s 24/7 wild swings mean the default (10, 3) on lower timeframes (e.g., 15M, 1H) can whipsaw you like crazy.
- Many crypto traders tend to:
- Lengthen the ATR Period: E.g., use 14, 20, or even longer to smooth the ATR reading and avoid getting faked out by sudden wicks.
- AND/OR Increase the Multiplier: E.g., use 3.5, 4, or even 5 to push the line further away, requiring a stronger counter-move to flip the signal.
- Goal: Better to enter/exit a bit later than to get chopped up by false signals.
Which “Unique” Parameter Combo is Hottest Right Now & How to Use It?
First, let’s be clear: There is absolutely NO parameter combo that kills it in all markets and timeframes! What’s “hottest” is relative and changes with market conditions.
However, if we have to pick a unique variation beyond the default (10, 3) that’s gained traction in some markets (especially slightly more volatile ones like certain Forex pairs or for Crypto swing trading) for being relatively balanced, reducing some noise without being too laggy, many experiment with settings like (12, 2) or (20, 2).
Breaking Down the Logic of (12, 2) / (20, 2):
- ATR Period (12 or 20): Longer than the default 10, meaning the ATR calculation is smoother, reflecting the “average” volatility over a longer period rather than overreacting to the last day or two’s spike. Helps filter short-term noise.
- Multiplier (2): Smaller than the default 3, meaning the bands are relatively narrower, and the Supertrend line will be slightly closer to the price than (10, 3).
- The Effect: The aim is to:
- Use the longer ATR period to stabilize the line, reducing premature flips caused by noise.
- Use the smaller multiplier to keep the line relatively responsive, hoping to catch trend reversals earlier than combos like (10, 3) or (10, 4), or provide a tighter trailing stop.
- It attempts to find a new balance point between “noise filtering” and “reaction speed.”
How to Use Combos like (12, 2) / (20, 2) Effectively?
- Timeframes: These combos often perform relatively better on common Swing Trading timeframes like H1, H4, Daily. On very short timeframes (e.g., 15M or below), a multiplier of 2 might still be too sensitive.
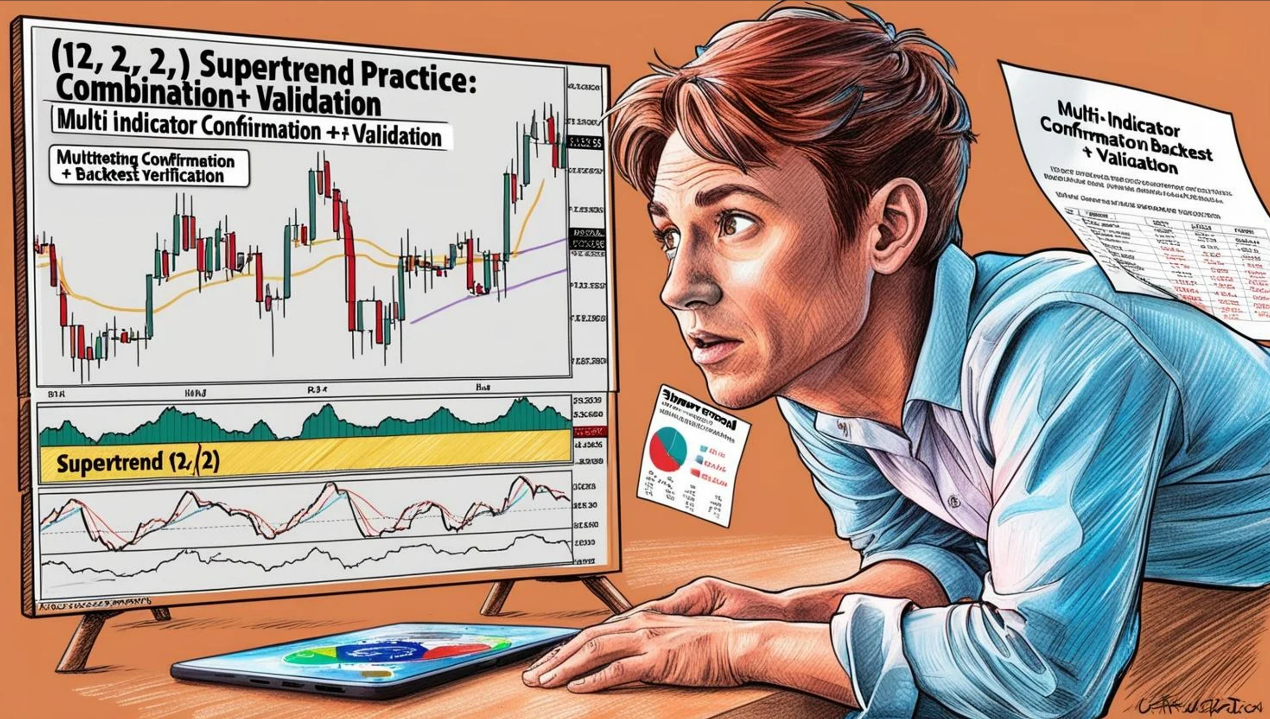
- Don’t Use It Alone! Confirmation is KEY:
- A Supertrend (12, 2) or (20, 2) flip is just an initial alert, absolutely NOT an immediate entry signal!
- Combine with Trend Indicators: E.g., only consider a Supertrend (12, 2) green flip buy signal if the price is above the 50 EMA / 200 EMA.
- Combine with Oscillators: E.g., Supertrend flips green + RSI crosses up from oversold, or MACD has a bullish crossover.
- Combine with Price Action/Patterns: Supertrend flips green + price breaks a key resistance level or forms a bottoming pattern (e.g., double bottom).
- Volume Confirmation!
- Main Uses:
- Trend Confirmation Assistant: Helps gauge if short-term momentum aligns with the major trend.
- Dynamic Trailing Stop: The stop provided by (12, 2) / (20, 2) will be tighter than (10, 3), potentially locking in more profit but also making it easier to get shaken out by volatility. Decide based on your risk tolerance.
- Backtesting is Non-Negotiable! You absolutely MUST backtest extensively on the asset and timeframe you trade to see if this parameter combo actually performs better for you than the default or others!
「Supertrend in Action: Combine & Verify」
Does the Default (10, 3) Still Work?
Yes! Absolutely. (10, 3) remains the most widely used and recognized setting. Its balance is time-tested. For many markets and mid-to-long-term strategies, it’s an excellent starting point. Often, the issue isn’t the parameters themselves, but whether the user understands the indicator’s limitations and uses it correctly with other tools.
What are the “Best” Parameter Combos Across All Timeframes?
Like we said multiple times: There isn’t one!
But here are some common starting points for you to reference and test yourself:
- Ultra Short-Term (Scalping – M1, M5) – Extremely High Risk, Not Advised Using Supertrend Alone: Might require very short ATR (e.g., 5) with a tiny Factor (e.g., 1 or 1.5). But you’ll likely drown in false signals.
- Intraday Trading (Day Trading – M15, H1): (10, 2), (10, 3), (12, 2), (14, 2). Need flexibility to adjust or switch based on live market volatility.
- Swing Trading (H4, Daily): (10, 3), (12, 2), (14, 3), (20, 2), (20, 3). This range has the most options; (10, 3) and (20, 2) are very popular.
- Long Term Investing (Weekly): (10, 3), (12, 3), (20, 3), (20, 5). Need to catch major trends; noise filtering is the priority.
Bottom Line: Supertrend is Your Trend Navigator, Not Autopilot!
Supertrend’s simplicity and volatility-adjusted design make it a favorite for many traders. It’s an excellent:
- Trend visualization tool.
- Dynamic stop-loss management tool.
But its weaknesses are also clear:
- Lagging Nature: Won’t give you signals at the exact top or bottom.
- Range-Bound Kryptonite (Whipsaws in Ranges): It will flip signals like crazy in sideways markets, baiting you in just to stop you out. Identifying ranges and sidelining Supertrend (or reducing its weight) is key!
- Using it Alone = Suicide Mission: You must, absolutely, definitely combine it with other analysis tools for confirmation! (Price action, patterns, other indicators, multiple timeframe analysis…)
- No Magic Settings, Backtest is Truth: Spend time finding the parameters that work best for you.
「Supertrend: Trend Navigator, Not Autopilot」
Hope this deep dive into Supertrend, including the parameter breakdown, helps you future market stars! Now, go load it onto your charting platform and get a feel for its red/green rhythm!
Next Steps:
- Add Supertrend (10, 3) to your usual H1/H4/Daily charts.
- Try the (12, 2) or (20, 2) settings we discussed and compare the differences.
- Observe how Supertrend “fakes you out” in consolidating markets.
- Practice combining Supertrend flip signals with confirmation from at least one other indicator or price action signal.
- Most Importantly: Backtest! Backtest! Backtest!
May you all catch the right trend and stack those profits!💰🚀