Alright, all you data-diving Alpha hunters, Crypto cycle surfers, and folks looking for a more pro angle on market overbought/oversold levels! Today, we’re decrypting an oscillator that looks similar to RSI/Stochastics but plays a whole different game, focusing more on “statistical significance” – the CCI (Commodity Channel Index)! Don’t let the name fool you into thinking it’s just for commodities; this indicator has tons of fans in stocks, forex, and crypto too! It doesn’t just look at simple highs and lows; it measures how far the price has deviated from its “normal range”!
What the heck is CCI? What’s the Core Difference from RSI/Stoch?
CCI was developed by Donald Lambert in 1980. Unlike RSI comparing up/down strength or Stochastics looking at the close vs. range, CCI’s core function is to measure how far the current price has deviated from its “statistical average price” over a period, in terms of “standard deviations” (more accurately, mean absolute deviation)!
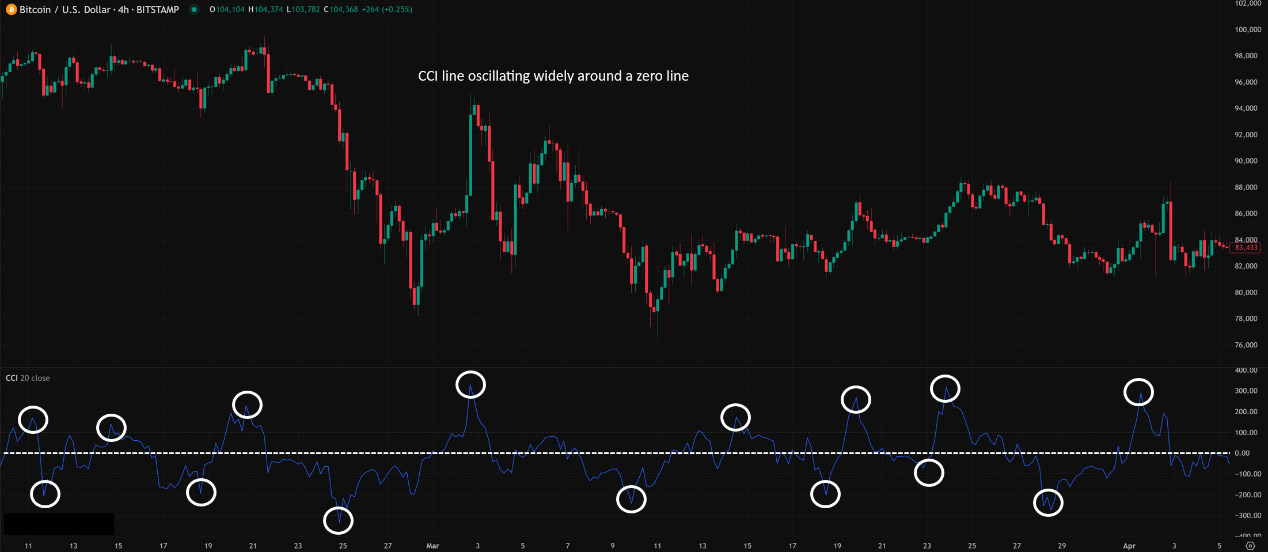
It usually appears as a single line oscillating around a Zero Line, and theoretically, it has no upper or lower bounds (though it often stays between +300 and -300). You’ll see two key horizontal lines:
- +100 Level: CCI above +100 indicates the price is significantly above its statistical average, potentially entering a strong momentum zone / potential overbought warning area.
- -100 Level: CCI below -100 indicates the price is significantly below its statistical average, potentially entering a weak momentum zone / potential oversold warning area.
「CCI Structure: Measuring Price ‘Deviation’ from Statistical Average」
Core Differences from RSI/Stoch:
- Different Calculation Basis: RSI/Stoch are based on price’s relative strength or position (bounded 0-100). CCI is based on price’s relationship to its own “statistical average + deviation range” (theoretically unbounded).
- Different OB/OS Meaning: RSI/Stoch hitting 70/80 or 30/20 is often directly interpreted as OB/OS. CCI hitting +100/-100 traditionally signifies trend initiation or strong trend momentum, not necessarily an immediate reversal! (This is crucial!)
CCI’s Origin Story & Design: Clues from Price Deviating from Normality
Donald Lambert originally designed CCI to identify seasonal or cyclical turns in commodity futures markets. He wanted a way to determine if the price had moved too far from its “normal” fluctuation range, signaling the potential start of a new trend or the end of an old one.
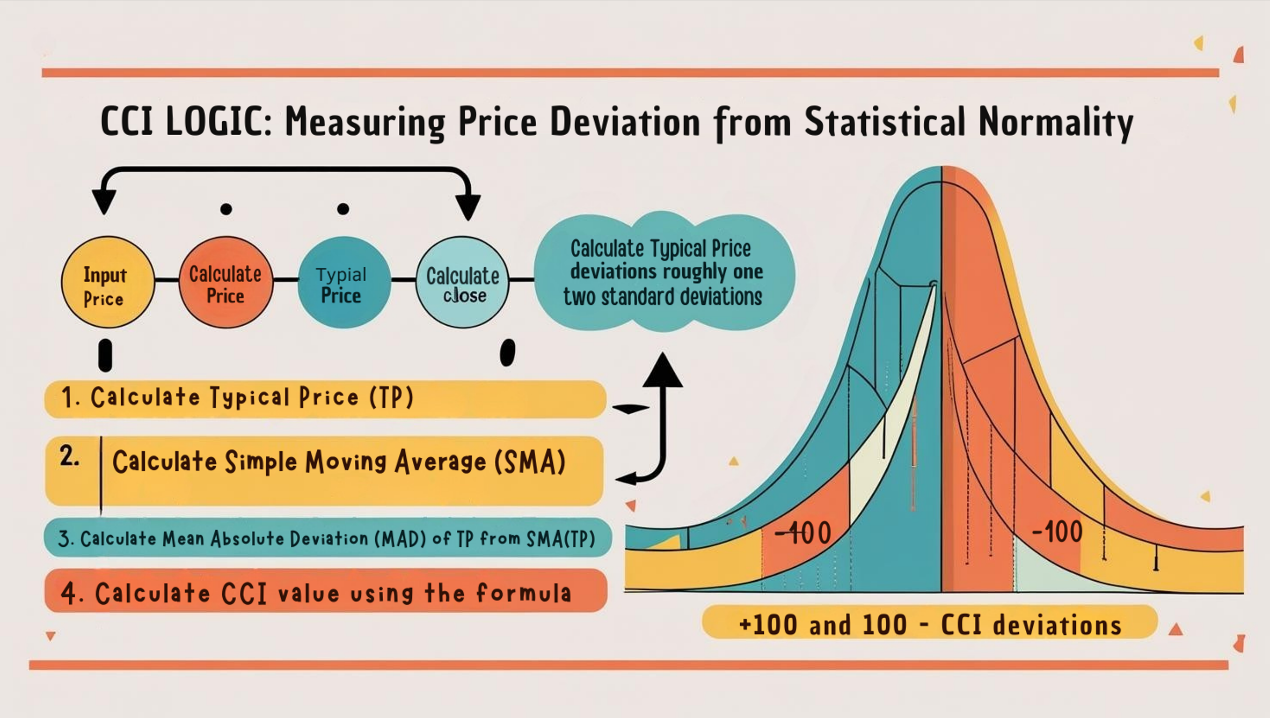
Core Calculation Concept (Feel the Stat Vibe):
- Calculate Typical Price (TP): (High + Low + Close) / 3. Using TP instead of just the close better represents the day’s “center” price.
- Calculate Simple Moving Average (SMA) of TP: SMA(TP, N), where N is the period (e.g., 20). This is our “statistical average price.”
- Calculate Mean Absolute Deviation (MAD): Measures the average difference between each period’s TP and the SMA(TP) over the last N periods. This represents the “normal range” of fluctuation around the average.
- Calculate CCI: (Current TP – SMA(TP)) / (0.015 * MAD)
- Numerator is the difference between current price and the average.
- Denominator is the average deviation adjusted by a constant (0.015). Lambert chose this constant so that roughly 70-80% of CCI values fall between +100 and -100.
- So, the CCI value essentially tells you: How many multiples of the “normal fluctuation range” is the current price away from its average price?
「CCI Logic: Measuring Price Deviation from Statistical Normality」
CCI Basic Plays (Beginner’s Standard Routines):
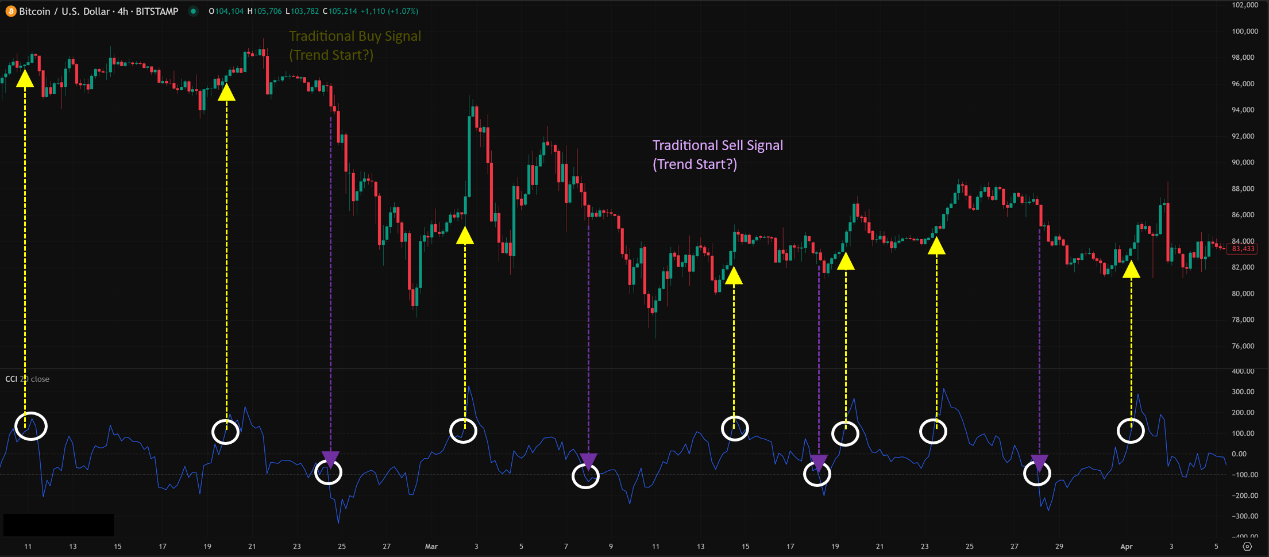
- Crossing +/- 100 Levels (Traditional Trend Initiation/Strength Signal):
- CCI crosses ABOVE +100 from below: Traditionally seen as a signal that an uptrend is starting/strengthening, potential buy consideration.
- CCI crosses BELOW -100 from above: Traditionally seen as a signal that a downtrend is starting, potential sell/short consideration.
- Note: This was Lambert’s original commodity trading usage, assuming breaks of +100/-100 caught the beginning of new trends. However, this approach can be lagging and may lead to chasing highs/lows in many markets (especially stocks/crypto).
「CCI Traditional Use: +/- 100 Breakouts」
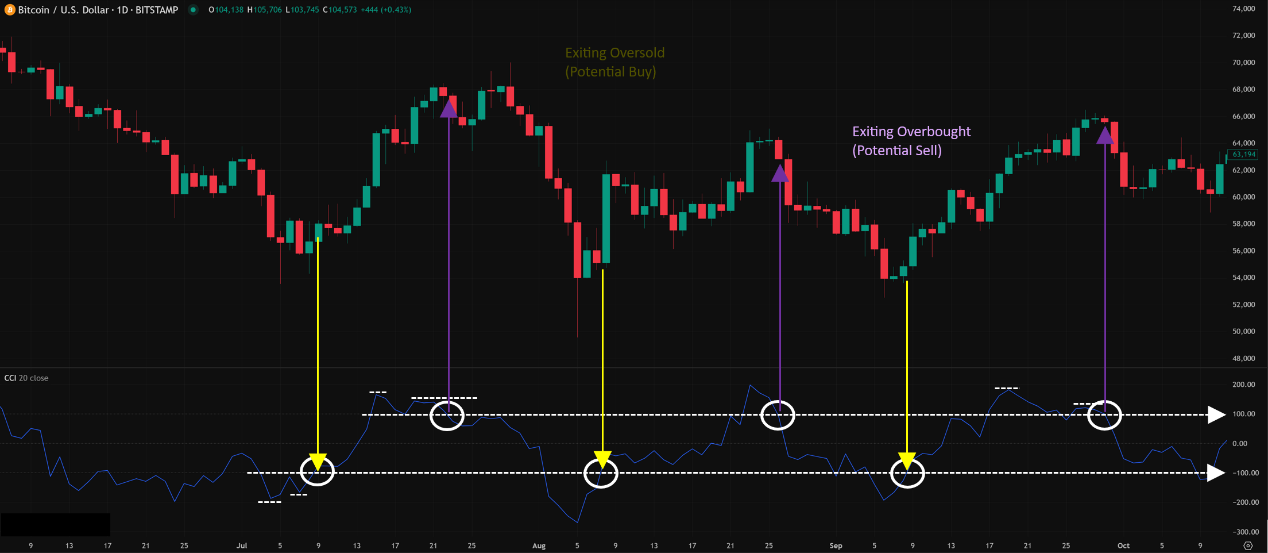
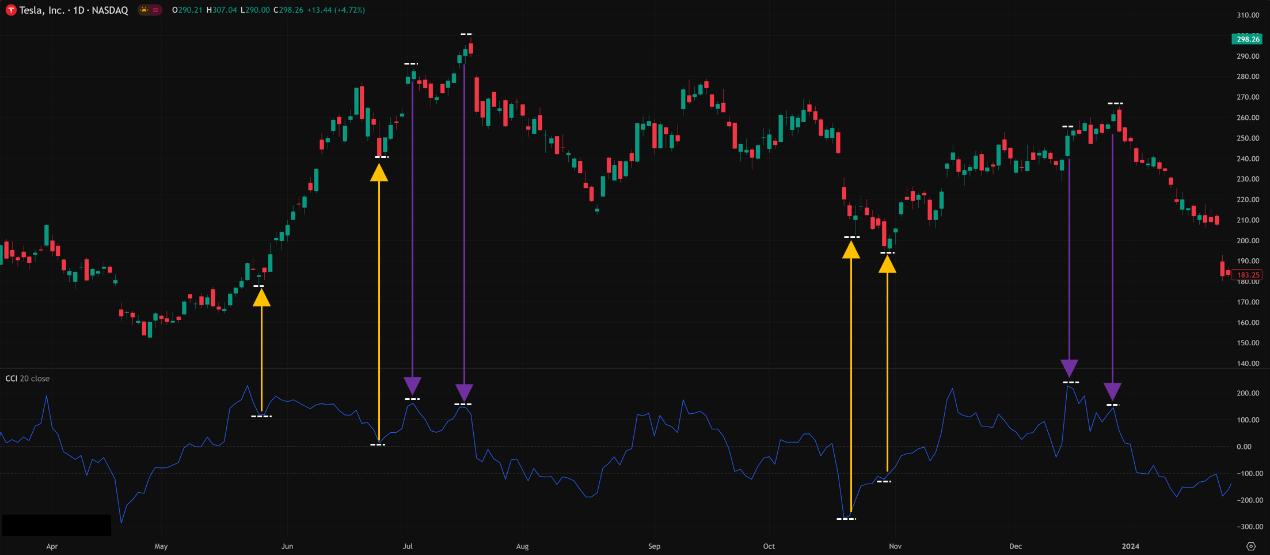
2. Using +/- 100 as OB/OS Zones (Modern Reversal Use – Needs Confirmation!):
-
- CCI > +100: Market potentially overbought, watch for pullback opportunities.
- CCI < -100: Market potentially oversold, watch for bounce opportunities.
- More Reliable Use: Wait for the CCI line to cross back BELOW +100 from the >+100 zone as a potential sell signal; wait for it to cross back ABOVE -100 from the <-100 zone as a potential buy signal. Confirmation step is crucial! Especially look for confirming divergence!
「CCI Modern Use: +/- 100 as OB/OS Zones (Needs Confirmation)」
3. Zero Line Cross (Auxiliary Reference):
-
- CCI crosses above 0 → Price moves above its statistical average, slightly bullish bias.
- CCI crosses below 0 → Price moves below its statistical average, slightly bearish bias.
- Usually considered a weaker, lagging signal, used for minor confirmation.
CCI Advanced Plays (Pro Level – Unleashing Statistical Power):
CCI’s strength lies in its statistical foundation and unbounded nature.
- Divergence (CCI’s Superpower!):
-
- Like RSI/MACD, divergence on CCI is a very reliable leading signal!
- Regular Bullish Divergence: Price LL, CCI HL → Potential bottom.
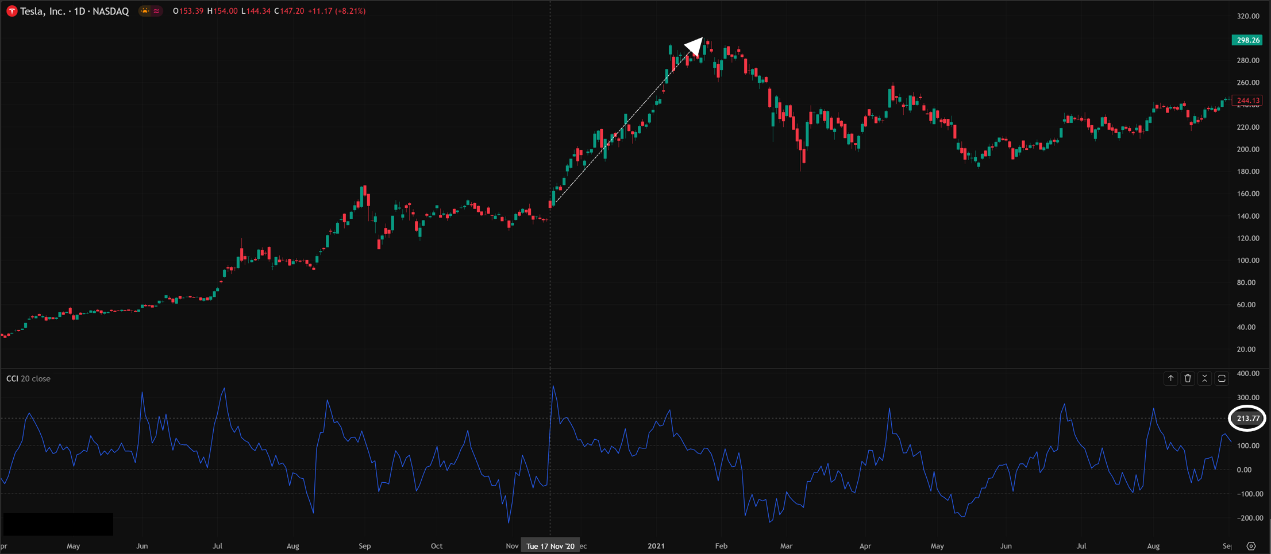
- Regular Bearish Divergence: Price HH, CCI LH → Potential top.
- Hidden Divergence: Also applies, used to confirm trend continuation.
- Why might CCI divergence be stronger? Because it measures deviation, when price makes a new high/low but the degree of deviation from the average actually weakens, it more strongly suggests underlying momentum failure.
「CCI’s Ace: Regular Divergence (Leading Reversal Signal)」
2. Extreme Readings >+200 / <-200 (Trend Confirmation!):
-
- This is where CCI differs greatly from RSI/Stoch! When CCI reaches extreme levels (e.g., >+200 or <-200), it often DOES NOT signal an imminent reversal, but rather confirms the current trend is extremely strong!
- How to Use:
- CCI breaks above +200 → Strong uptrend likely to continue.
- CCI breaks below -200 → Strong downtrend likely to continue.
- In these scenarios, DO NOT fade the trend! Instead, consider adding to positions with the trend.
「CCI Extreme Values (+/-200): Usually Means Trend Continuation!」
3. CCI Trendline Breaks / Pattern Breaks:
-
- Like other oscillators, you can draw trendlines or identify patterns (M-tops / W-bottoms) on the CCI line itself. Breaks on CCI sometimes lead price breaks.
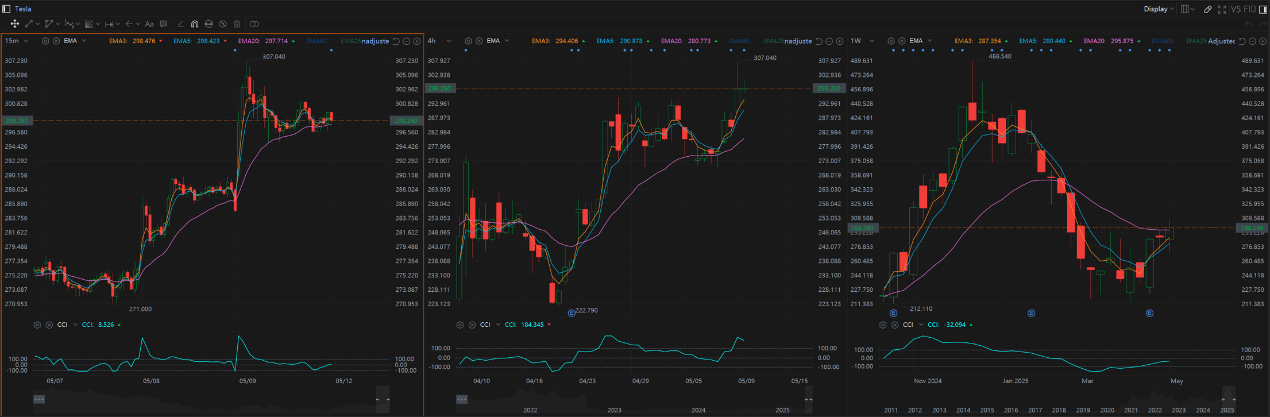
4. Multi-Timeframe Analysis:
-
- Use Weekly CCI for long-term OB/OS states and major divergences.
- Use Daily CCI for intermediate trends and +/- 100 breaks/cross-backs.
- Use H4/H1 CCI for more precise entry timing (e.g., wait for Daily CCI <-100, then H4 CCI crosses back above -100).
CCI Parameter/Timeframe Breakdown (What’s the Perfect Fit?):
Core Parameter: Period (N)
- Default Parameter: 20! This was recommended by Donald Lambert and is the standard default on most platforms. It was deemed effective for catching roughly 20-day cycles in commodity markets.
- Impact of Changing N:
- Shorter N (e.g., 5, 9, 14):
- CCI reacts faster, line is more volatile, hits +/- 100 or even +/- 200 more frequently.
- Use Case: Short-term traders might use shorter periods (e.g., 14) for faster signals and divergence. Some even use 5 or 6 for scalping.
- Risk: Increased noise, more false signals. Traditional +/- 100 trend initiation signals become mostly invalid.
- Longer N (e.g., 50, 100):
- CCI is smoother, reacts slower, line oscillates less wildly.
- Use Case: Long-term traders use this to identify major long-term cycles and large-scale divergences. E.g., using CCI(50) on a Weekly chart for long-term OB/OS perspective.
- Risk: Extreme lag, misses short-term opportunities.
- Shorter N (e.g., 5, 9, 14):
Parameter Settings Analysis & “Hottest” Combo Discussion:
- Is Period 20 Best? It’s the most standard, well-balanced choice, suitable for many markets and timeframes (especially Daily).
- Any More “Unique” / “Hottest” Combos?
- Combo 1 (Faster Reaction – Common for Shorter Term): CCI(14)
- Many traders find 20 too slow, especially in volatile Crypto or for shorter-term trading. Period 14 offers faster reaction and is a very popular alternative.
- Usage: Similar to period 20, but signals appear earlier (potentially more false signals too). Divergence and +/- 100 cross-backs remain key.
- Combo 2 (Hyper Speed – Scalper Special?): CCI(5) / CCI(6)
- Very aggressive settings, line becomes extremely sensitive and volatile.
- Usage: Might only be used for extreme readings (e.g., +/- 200 or 300) combined with reversal patterns for scalping, or for ultra-short-term momentum confirmation. Extremely high risk, not for newbies!
- Combo 3 (Longer Cycle – Catching Big Waves): CCI(50)
- Mainly used on Daily / Weekly charts to capture major trends/cycles lasting months or longer. Signals will be rare but significant.
- Combo 1 (Faster Reaction – Common for Shorter Term): CCI(14)
- Conclusion: The “hottest” / most effective combos might be:
- Standard Crew: Stick with 20, suitable for most situations, especially Daily charts.
2. Agile Crew: Use 14 on H1/H4/Daily for faster reactions.
3. Long-Term Crew: Use 50 on Weekly charts for the big picture.
-
- The Key: Understand the market rhythm associated with different N periods! No single N fits all.
「CCI Parameter N: Matching Your Market Rhythm」

Timeframe Analysis:
- Ultra Short-Term (M1, M5, M15):
- Using short N (e.g., 5, 14) makes CCI extremely active, very noisy. +/- 100 might be crossed constantly. Might primarily look at extreme readings (>+200/<-200) or very brief divergences. Reliability questionable.
- Intraday / Short Swing (H1, H4):
- CCI starts to shine. Use period (14) or (20).
- Usage: Focus on capturing divergence signals and confirming +/- 100 cross-backs. E.g., H4 shows bullish divergence, wait for H1 CCI to cross back above -100.
- Swing / Long-Term (Daily, Weekly):
- CCI’s most reliable application area!
- Usage:
- Use (20) or (50) to identify major trend momentum (via extreme readings) and large-scale divergences.
- Weekly CCI crossing back through +/- 100 is a long-term signal worth noting.
「CCI Timeframes: Longer = More Macro Signals」
Summary: Which Unique Parameter Combo + Timeframe is Hottest & Most Effective? How to Use It?
- Parameters: 20 (Standard) and 14 (Slightly Faster) are the most common and time-tested choices. 50 (Long-term) has specific uses. Extreme short periods (5/6) are for experts/risk-lovers only.
- Timeframe: Daily/Weekly/H4 are the core application zones. H1 is usable, M15 or lower use with caution.
- Hottest / Most Effective Usage = Master “Divergence” + Understand the Real Meaning of “+/- 100/200”:
- Divergence is the Strongest Weapon! Both regular and hidden CCI divergences are important leading signals.
- +/- 100 isn’t Simple OB/OS! Breaking out might signal trend start (traditional); crossing back might confirm reversal (modern). Context matters!
- +/- 200 (or higher) Usually Means Trend Confirmation! Don’t fade it!
- Multi-Timeframe Analysis greatly improves CCI signal reliability.
- ALWAYS Combine with Price Action, S/R, Trendlines, etc.! CCI provides deviation and momentum info.
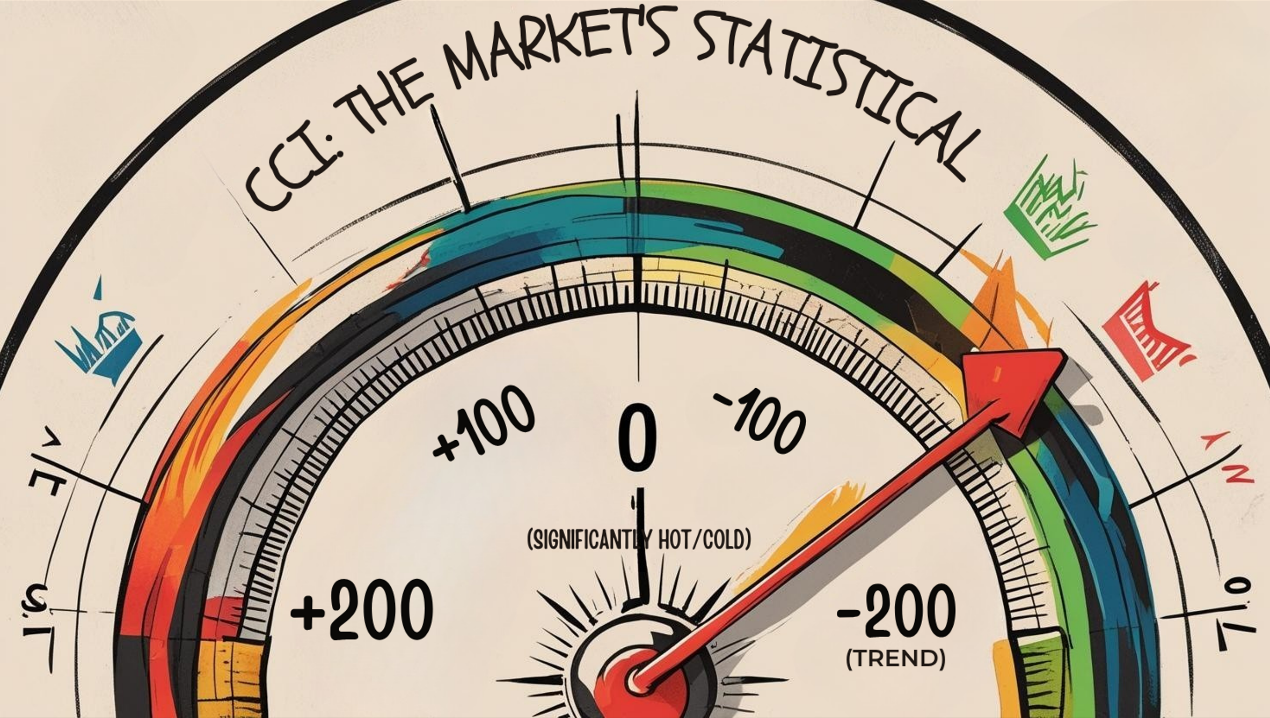
CCI: The Market’s “Statistical Thermometer,” Measuring Price’s Relative Heat
CCI offers a unique perspective by measuring price deviation from its statistical norm. Its strengths:
- Statistical Foundation, clear concept.
- Divergence signals are very powerful.
- Extreme readings (>+/-200) effectively identify strong trends.
- Theoretically unbounded, better reflects extreme moves.
Weaknesses:
- +/- 100 meaning can be confusing (trend vs. reversal).
- Line can be relatively volatile (especially short N).
- Lag still exists.
「CCI: The Market’s Statistical Thermometer」
CCI is an oscillator well worth studying in depth, especially its divergence and extreme reading applications. It can add a different dimension of confirmation to your trading system.
Next Steps:
- Add CCI (using default 20 period) to your H4, Daily, Weekly charts.
- Add another CCI(14) for comparison to feel the speed difference.
- Focus on practicing identifying CCI divergences and observing the subsequent price reaction.
- Observe market behavior when CCI reaches +/- 100 and +/- 200.
- Try using CCI crossing back through +/- 100 as a confirmation for your other strategies.
- Backtest! Verify which period N and usage method works best for your style.
Hope you decode the secrets of price deviation and master the market’s statistical rhythm! ️📊🌡️🚀