Alright, all you pros hunting for market “money flow,” Crypto capital hunters, and savvy traders wanting to know if the big players are secretly accumulating or dumping! Today, we’re unlocking an indicator that blends the essence of “price” and “volume,” specifically designed to sense the momentum of buying and selling pressure – the Chaikin Oscillator (CHO)! It doesn’t directly look at price ups and downs, but rather the momentum of something called the “A/D Line.” Wanna know how strong the “smart money” flow is? Stick close!
What the heck is CHO? What’s its relationship with the A/D Line?
CHO was invented by another technical analysis legend, Marc Chaikin. To understand CHO, you first need to know its parent – the Accumulation/Distribution Line (A/D Line).
- A/D Line: This line was created by Chaikin to measure the daily inflow or outflow of money pressure. The core idea is:
- If the closing price is near the day’s high, it represents buying pressure / Accumulation.
- If the closing price is near the day’s low, it represents selling pressure / Distribution.
- It calculates this “close’s position relative to the daily range,” multiplies it by the day’s volume, and then cumulatively sums these values to draw the A/D Line. An upward A/D Line suggests buying pressure dominates; downward suggests selling pressure dominates.
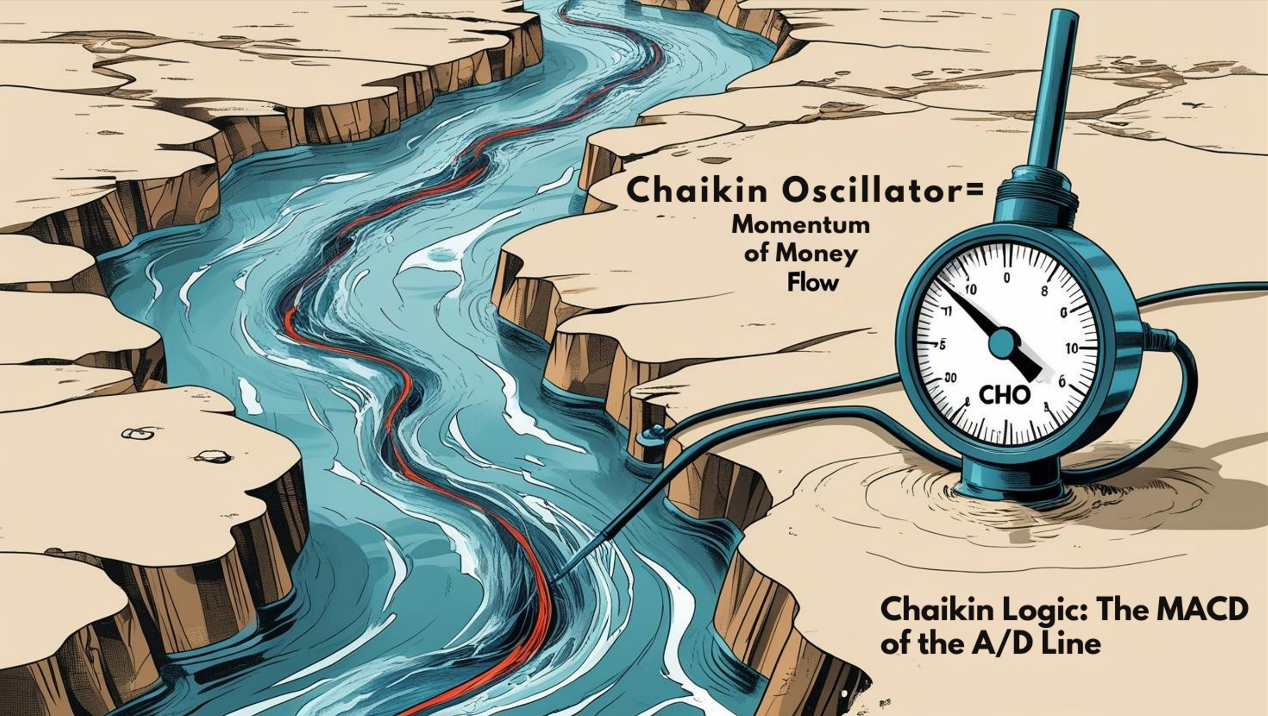
- Chaikin Oscillator (CHO): This is simply the momentum indicator OF the A/D Line! It calculates the difference between a fast and slow Exponential Moving Average (EMA) of the A/D Line, typically EMA(3) and EMA(10). Just like MACD calculates the difference between price EMAs, CHO calculates the difference between A/D Line EMAs!
So, CHO is essentially an “Indicator of an Indicator”! It doesn’t measure price momentum directly, but the rate of change (momentum) of the money flow (A/D Line)!
It appears as a single line oscillating around a Zero Line.
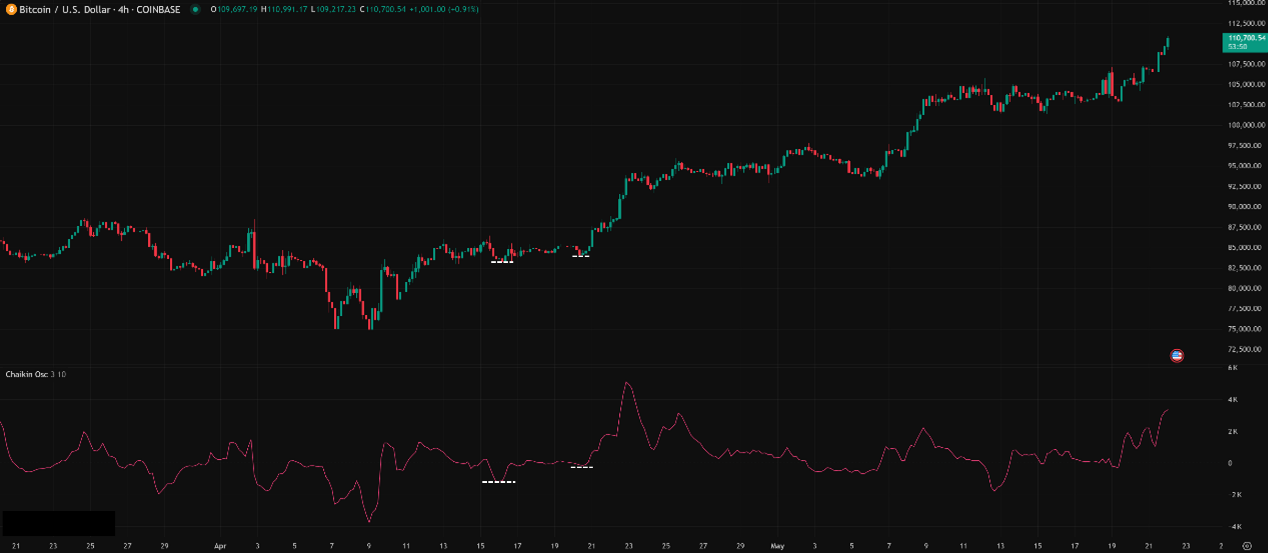
「CHO Structure: Measuring the Momentum of the A/D Line (Money Flow)」
CHO’s Origin Story & Design: Seeing Through the Acceleration of Money Flow
Marc Chaikin felt that just looking at the direction of the A/D Line wasn’t always enough because the line could be rising, but the force (momentum) behind the rise might be weakening. He wanted an indicator to measure the change in momentum of the A/D Line itself, to catch the acceleration or deceleration of buying/selling pressure earlier.
- Design Philosophy:
- A/D Line Captures Money Flow: First, use the A/D Line to gauge if money is accumulating or distributing.
- CHO Measures Money Flow Momentum: Then, use CHO (the MACD of the A/D Line) to see if this money flow is speeding up or slowing down. Think of watching a river (A/D Line) and using a device (CHO) to measure if the current’s velocity is changing.
- Core Calculation (Concept):
- Calculate the daily A/D value (involves Close, High, Low, Volume).
- Cumulatively sum the daily A/D values to get the A/D Line.
- Calculate the short-period EMA of the A/D Line (e.g., 3-period). EMA_Fast = EMA(A/D Line, 3)
- Calculate the long-period EMA of the A/D Line (e.g., 10-period). EMA_Slow = EMA(A/D Line, 10)
- Chaikin Oscillator = EMA_Fast – EMA_Slow
Simply Put: CHO is like the “Speedometer” and “Accelerometer” for the A/D Line! It tells you if the speed of smart money flowing in/out is increasing or decreasing.
「CHO Logic: The MACD of the A/D Line」
CHO Basic Plays (Beginner’s Standard Plays):
CHO’s usage is very similar to MACD’s, just applied to the A/D Line instead of price.
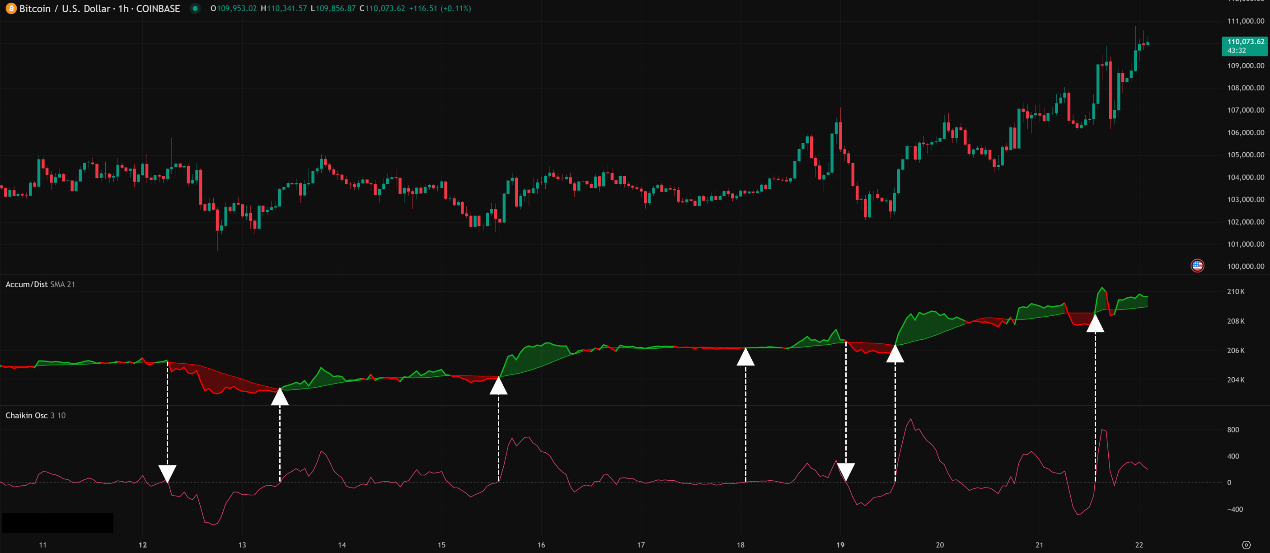
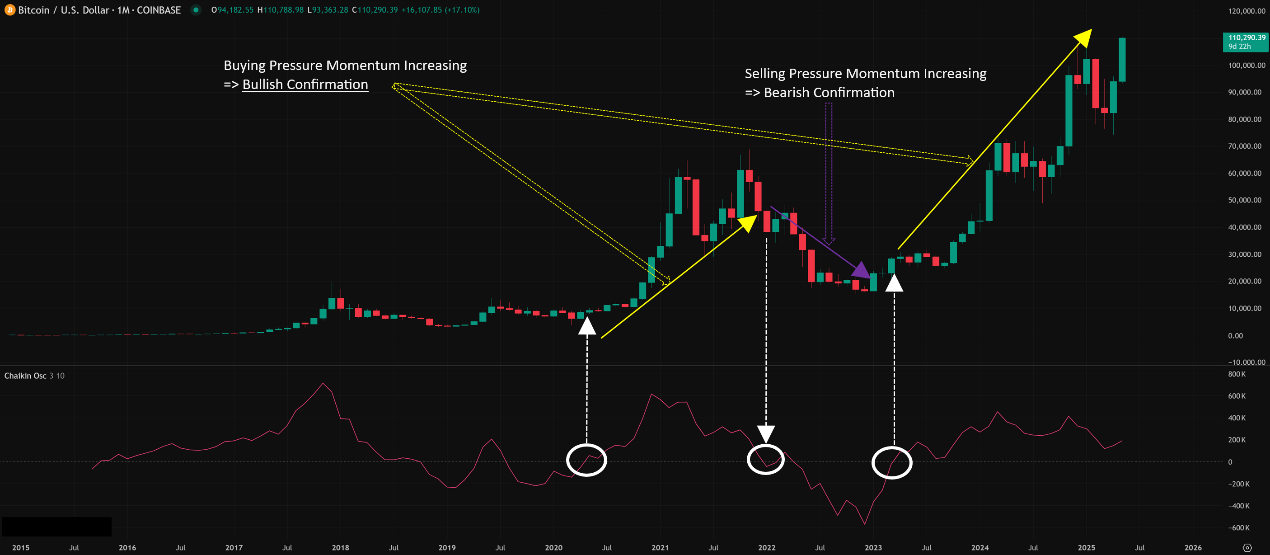
- Zero Line Cross (Confirming A/D Trend):
- CHO crosses above the zero line from below → Indicates A/D Line’s short EMA crossed above long EMA, buying pressure momentum strengthening, potential bullish confirmation.
- CHO crosses below the zero line from above → Indicates A/D Line’s short EMA crossed below long EMA, selling pressure momentum strengthening, potential bearish confirmation.
- Note: This signal is relatively lagging because it waits for the EMA cross. It’s better used to confirm the trend of the A/D Line itself.
「CHO Zero Line Cross: Confirming A/D Line Momentum Direction」
2. Forget Overbought/Oversold!
-
- CHO does not have fixed OB/OS levels. High or low values simply reflect a large difference between the fast and slow EMAs of the A/D Line, not that price itself is OB/OS.
CHO Advanced Plays (Pro Level – Decoding Money Flow Secrets):
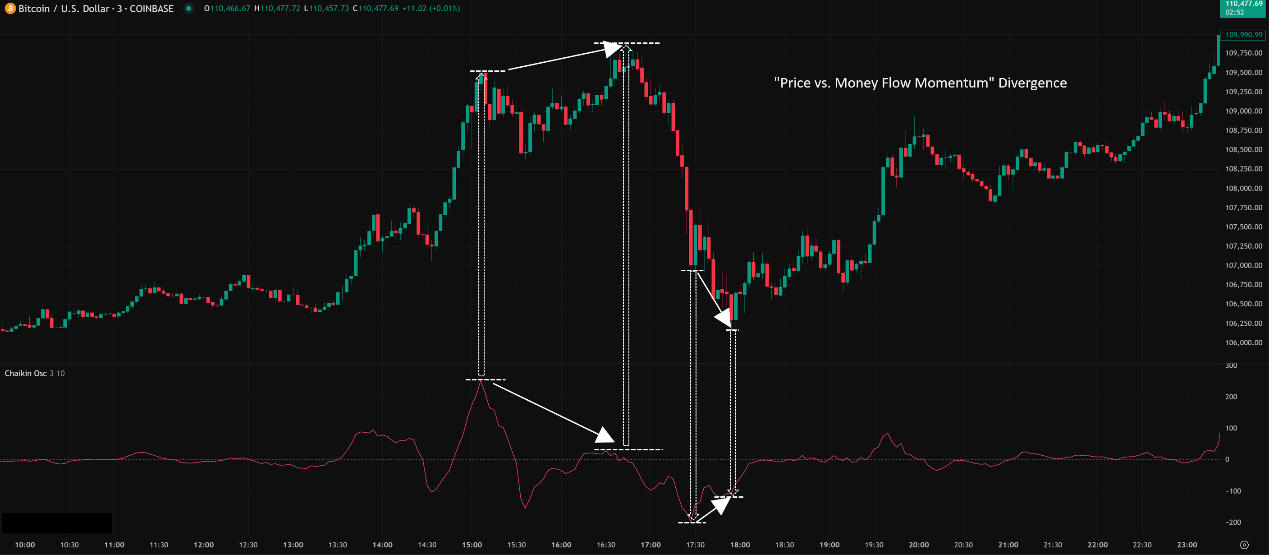
CHO’s real power lies in its divergence with price action, directly reflecting “price-volume separation”!
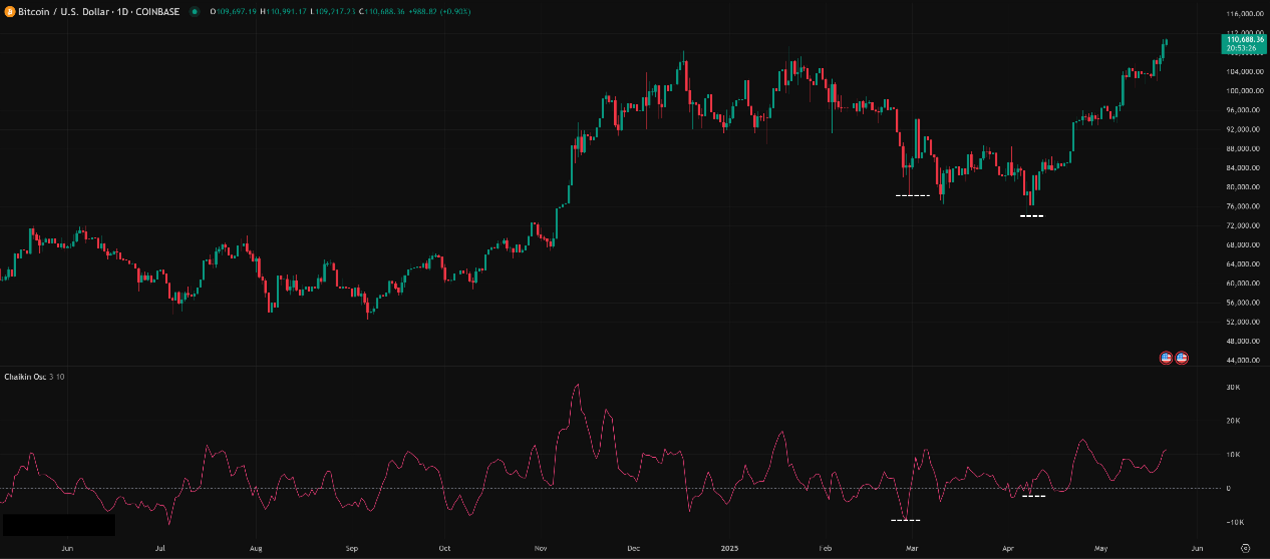
- Divergence (CHO’s Strongest Weapon!):
- This is the usage highly recommended by Marc Chaikin himself! He considered CHO divergence a very reliable predictor of price reversals!
- Bullish Divergence:
- Price makes a New Low (LL).
- But CHO fails to make a new low, forming a Higher Low (HL) instead.
- Interpretation: Even though price is falling, money is actually starting to flow in/accumulate secretly (A/D Line’s decline slows or even reverses, causing CHO to rise)! Like the water level rising behind a dam while the surface outflow still looks strong. A strong potential bottom signal!
- Bearish Divergence:
- Price makes a New High (HH).
- But CHO fails to make a new high, forming a Lower High (LH) instead.
- Interpretation: Even though price is rising, money is actually starting to flow out/distribute secretly (A/D Line’s ascent slows or even reverses, causing CHO to fall)! Like a rocket ascending but its fuel supply starts dwindling. A strong potential top signal.
- Why Strong? Because it directly reflects the contradiction between price action and actual money flow momentum! This “price-volume divergence” usually carries significant weight!
「CHO’s Ace: Price-Volume Divergence (Predicts Reversals)」
2. Confirming Trend Strength:
-
- In an uptrend, if price makes a new high AND CHO also makes a new high → Confirms the uptrend has money flow momentum supporting it, which is healthy.
- In a downtrend, if price makes a new low AND CHO also makes a new low → Confirms the downtrend has selling pressure momentum supporting it.
- If price makes a new high/low but CHO fails to follow → Be alert for potential divergence!
3. Auxiliary Breakout/Breakdown Confirmation:
-
- Price breaks above resistance + CHO is positive and rising → Confirms the breakout has money flow support.
- Price breaks below support + CHO is negative and falling → Confirms the breakdown has selling pressure.
CHO Parameter/Timeframe Breakdown (What Settings Catch the Flow?):
Core Parameters: Fast EMA Period, Slow EMA Period
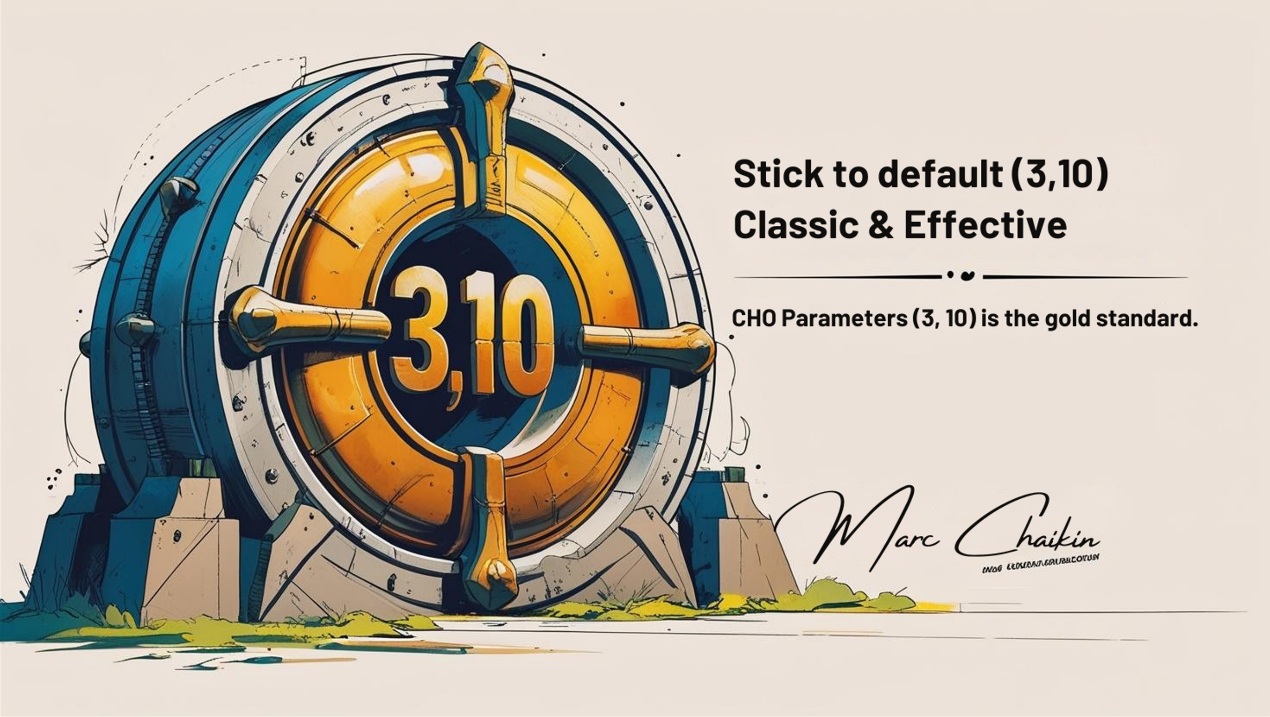
- Default Parameters: (3, 10)! Fast EMA = 3, Slow EMA = 10. This is Marc Chaikin’s original setting and the most common, standard setting worldwide!
- Why 3 and 10?
- The 3-period EMA reacts very quickly, capturing short-term fluctuations in the A/D Line.
- The 10-period EMA is relatively smoother, reflecting the intermediate money flow trend.
- The difference between them effectively measures short-term changes in A/D Line momentum.
- Attempts to Change Parameters?
- Similar to UO/Ichimoku, for CHO, sticking with the default (3, 10) is highly recommended in almost all cases!
- Why?
- Time-Tested: (3, 10) is the balanced choice Chaikin found effective for capturing money flow momentum.
- Unnecessary: CHO’s power lies mainly in divergence interpretation and zero-line relationship. Tweaking parameters might not significantly improve these core uses and could introduce more noise or lag.
- Consensus Value: Most traders use (3, 10), giving signals under these settings more market recognition.
- Conclusion: The “hottest,” most effective parameter combo IS the default (3, 10)! Focus your energy on mastering its usage, especially divergence.
「CHO Parameters: (3, 10) is the Gold Standard」
Timeframe Analysis:
- All Timeframes Applicable! CHO’s concept can be applied across different timeframes.
- But Effectiveness & Focus Differ:
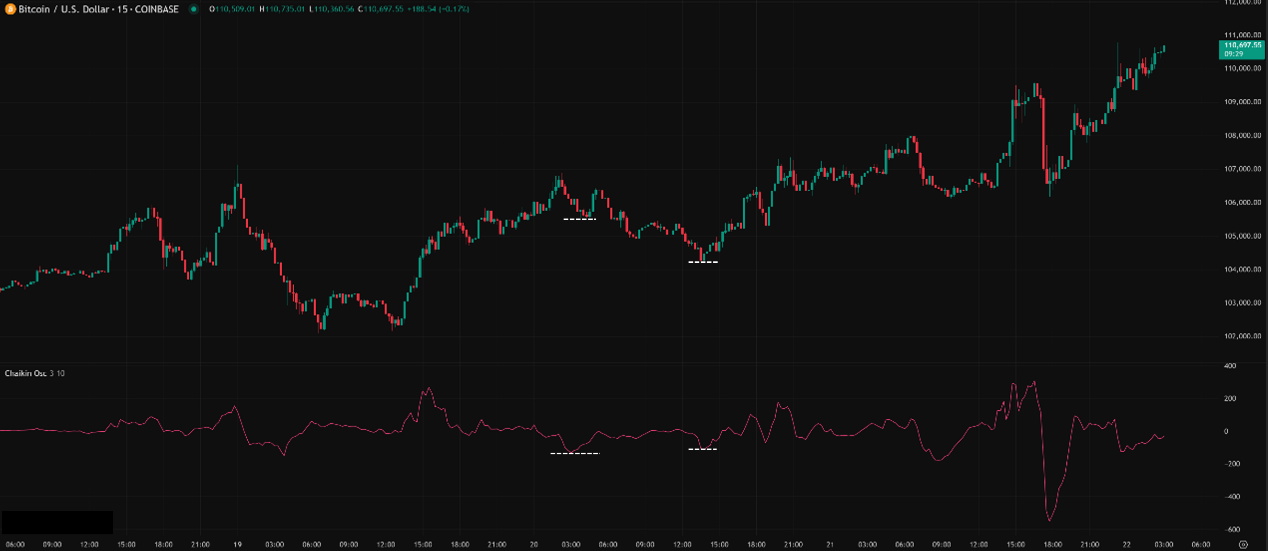
- Ultra Short-Term (M1, M5, M15):
- CHO will be very volatile, frequent zero crosses. Divergences might appear quickly but fail often.
- Might primarily be used to watch for sudden, sharp changes in very short-term money flow momentum, or as an ultra-leading confirmation? (e.g., price nears breakout, check if CHO is already surging). High risk, lots of noise!
- Intraday / Short Swing (H1, H4):
- CHO starts becoming much more valuable.
- Usage: Focus on capturing divergence signals! H4 CHO divergence is particularly noteworthy. Zero line crosses can act as auxiliary confirmation. Can help gauge the dominant intraday money flow momentum.
- Swing / Long-Term (Daily, Weekly):
- Where CHO’s power truly shines! On longer timeframes, the A/D Line better reflects true long-term accumulation or distribution, and CHO measuring the momentum shifts of this long-term flow makes divergence signals extremely significant!
- Usage:
- Catch major market top/bottom divergences. Weekly CHO divergence is a very important warning!
- Use Daily CHO zero crosses or sustained position above/below zero to confirm intermediate trend money flow support.
- Ultra Short-Term (M1, M5, M15):
「CHO Timeframes: Longer = More Reliable Divergence」
Summary: Which Unique Parameter Combo + Timeframe is Hottest & Most Effective? How to Use It?
- Parameters: Default (3, 10) is king!
- Timeframe: Daily / Weekly / H4 are the core application zones, especially for divergence. H1 is usable support. M15 or lower mostly noise.
- Hottest / Most Effective Usage = Become a “Price-Volume Divergence” Detective + Use Zero Line for Momentum Confirmation:
- Divergence is the Soul! Remember it’s Price vs. CHO (Money Flow Momentum) divergence! This is a leading signal!
- Zero Line Crosses for Confirmation. CHO > 0 confirms buying momentum, CHO < 0 confirms selling momentum.
- Don’t Look for OB/OS!
- ALWAYS Combine with Price Action, S/R, Trend Analysis! CHO provides money flow momentum info, not a standalone system.
- Check Volume Data Quality! CHO relies on A/D Line, which relies on volume. Inaccurate volume data (e.g., wash trading on some crypto exchanges) will distort CHO signals! Be especially careful in crypto markets!
CHO: Your Money Flow “Momentum Detector” – Seeing Through Price to Gauge Force
The Chaikin Oscillator, by analyzing the momentum of the A/D Line, offers a unique tool to gauge the changing strength of underlying money flow. Its advantages:
- Combines Price & Volume via A/D Line foundation.
- Divergence signals are high-quality, effectively warning of “price-volume separation.”
- Can confirm the money flow support behind a trend.
Disadvantages:
- It’s an “Indicator of an Indicator,” introducing a second layer of lag relative to price (though divergence is leading).
- Reliant on the A/D Line, which has its own limitations (e.g., handling gaps).
- Reliant on Volume Data Quality.
「Chaikin Oscillator: The Money Flow Momentum Sonar」
CHO is a relatively advanced weapon. It requires the user to look beyond price alone and understand volume dynamics and money flow concepts. If you want to analyze the buying/selling pressure tug-of-war more deeply, CHO is definitely worth studying.
Next Steps:
- Add Chaikin Oscillator (using default 3, 10) to your H4, Daily, Weekly charts.
- Also add the A/D Line to understand how CHO follows its changes.
- Practice spotting divergences between PRICE and CHO like crazy! This is crucial!
- Observe the A/D Line and price behavior when CHO crosses the zero line.
- Backtest! Test strategies centered around CHO divergence combined with other confirmation signals.
Hope you become masters of money flow and see the true strength behind the market moves!🌊💸🚀