Alright, all you Trend Riders seeking the “True Strength” in the market, Crypto momentum analysts, and friends looking for a smoother yet responsive momentum indicator! Today, we’re unlocking an indicator that might not have the household name status of MACD/RSI but is a favorite among many pro traders for supposedly reflecting strength more “truly” – the TSI (True Strength Index)! Its name claims “True,” but how true is it? And how does it help us find the signal within the noise? Let’s get into it!
What the heck is TSI? How’s it different from RSI/MACD?
TSI was developed by William Blau in 1991. It’s a momentum oscillator designed with a clear goal: to create a tool that reflects true momentum direction while maintaining smoothness to reduce false signals.
Its key difference from its siblings lies in its “double smoothing” technique:
- RSI: Measures the relative strength of price gains vs. losses.
- Stoch: Measures the closing price’s position within its recent range.
- MACD: Measures the difference between two price EMAs.
- TSI: It first calculates price momentum (typically the 1-period price change), then applies two layers of Exponential Moving Average (EMA) smoothing to this momentum value! Finally, it’s normalized to oscillate generally between -100 and +100 (though its practical range is often smaller).
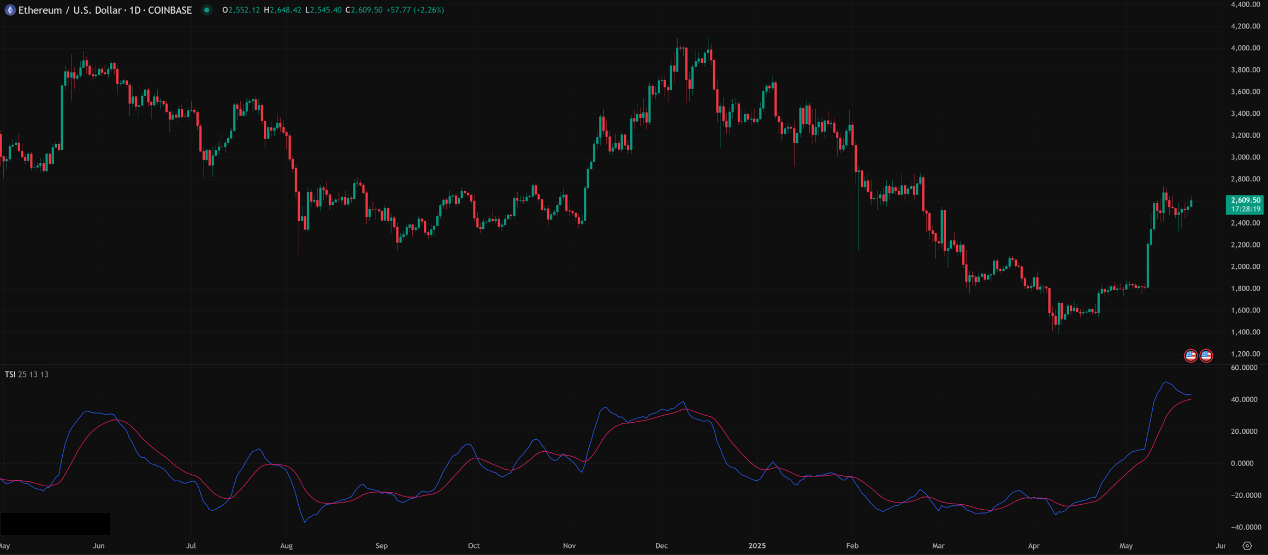
It usually consists of two lines:
- The TSI Line: The main line, representing the double-smoothed momentum value, oscillating around a Zero Line.
- The Signal Line: Typically an Exponential Moving Average (EMA) of the TSI line itself (e.g., 7 or 9 periods).
「TSI Structure: Double-Smoothed Momentum + Signal Line」
Why double smooth?
- First Smoothing (Longer Period EMA): Smooths out short-term noise in the raw price momentum, capturing the primary momentum trend.
- Second Smoothing (Shorter Period EMA): Smooths the result again, making the final TSI line exceptionally smooth, reducing whipsaws, while still retaining reasonable responsiveness to momentum changes thanks to using EMAs (which are more sensitive to recent data than SMAs). Think of it like sanding wood with coarse sandpaper then fine sandpaper – you get a very smooth finish.
TSI’s Origin Story & Design: The Quest for Smooth & Responsive Momentum
William Blau detailed TSI in his book “Momentum, Direction, and Divergence.” His research focused on finding the optimal balance between eliminating lag and filtering noise (smoothing). He felt many traditional momentum indicators were either too fast and noisy (like short-period Momentum/ROC) or too smooth and slow (like long-period MAs).
- Design Philosophy:
- Momentum is Key: He believed the rate of price change (momentum) was crucial for predicting future moves.
- Single Smoothing Isn’t Enough: Directly smoothing momentum (e.g., with one EMA) might still contain too much short-term noise.
- Double EMA Smoothing: By applying two EMAs of different periods, a superior smoothing effect could be achieved, significantly reducing false signals. Crucially, using EMAs (more sensitive to recent data) retains more responsiveness compared to using SMAs for smoothing.
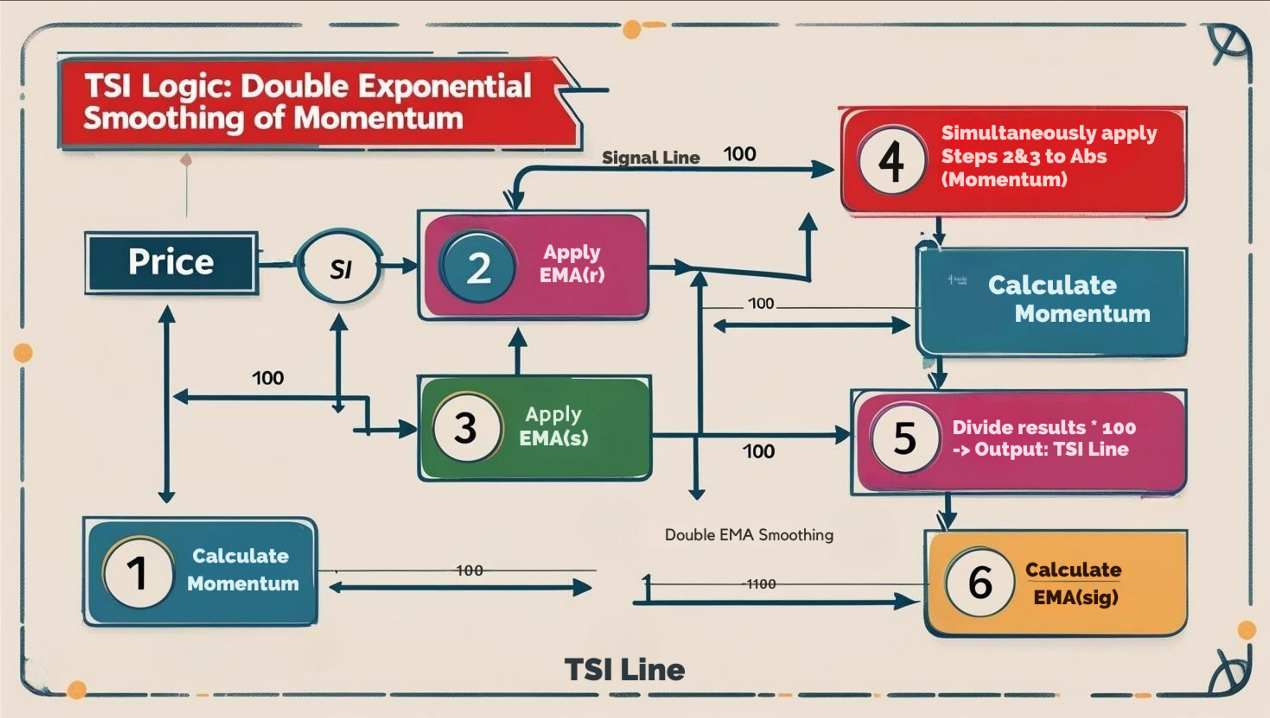
- Core Calculation Concept (Feel the Double Smoothness):
- Calculate Price Momentum: Current Close – Previous Close.
- First EMA Smoothing (Long Period ‘r’): Apply an EMA to the momentum values. EMA1 = EMA(Momentum, r)
- Second EMA Smoothing (Short Period ‘s’): Apply another EMA to the result of the first smoothing. EMA2 = EMA(EMA1, s)
- Do the Same Double Smoothing for Absolute Momentum: AbsEMA1 = EMA(Abs (Momentum), r), AbsEMA2 = EMA(AbsEMA1, s)
- Calculate TSI: TSI = 100 * (EMA2 / AbsEMA2). Divide the double-smoothed directional momentum by the double-smoothed total momentum (absolute value), then multiply by 100 to normalize between -100 and +100.
- Calculate Signal Line: Apply another EMA (period ‘sig’) to the TSI line. Signal Line = EMA(TSI, sig)
「TSI Logic: Double Exponential Smoothing of Momentum」
TSI Basic Plays (Beginner’s Standard Flow):
TSI usage is very similar to MACD, but its signals might be more reliable due to its smoothness.
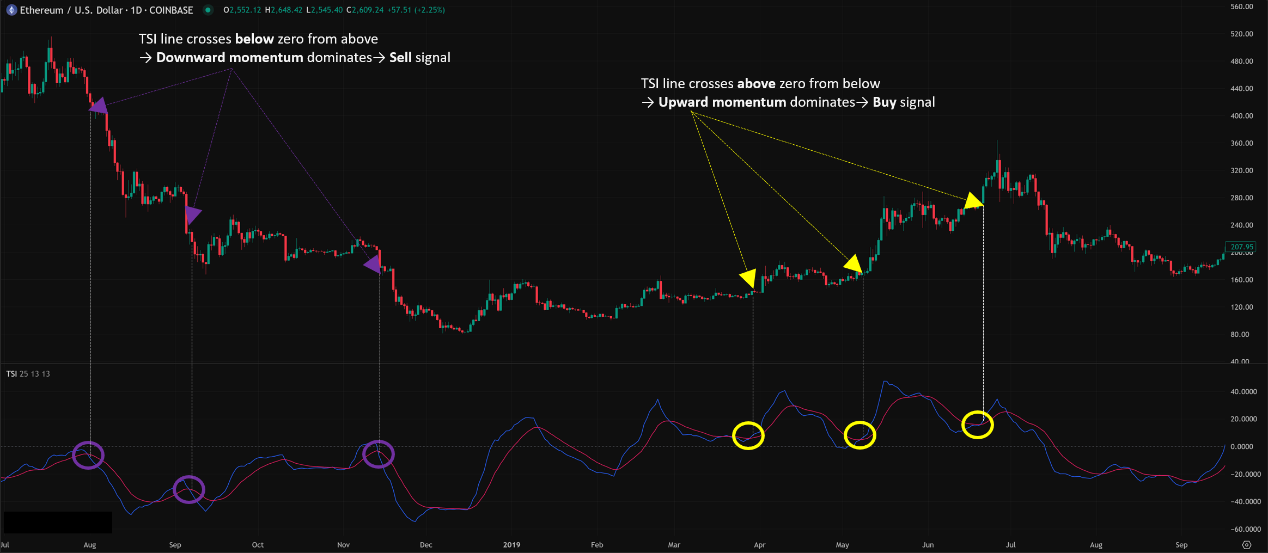
- Zero Line Cross (Trend Confirmation):
- TSI line crosses above zero from below → Upward momentum dominates, confirms bullish trend bias.
- TSI line crosses below zero from above → Downward momentum dominates, confirms bearish trend bias.
- Usage: Primarily as confirmation of trend direction. The zero line cross often reacts faster than MACD’s zero line cross (because TSI is based on momentum, while MACD is based on price EMAs).
- Signal Line Cross (Primary Trading Signal):
- TSI line crosses above its signal line → Buy signal.
- TSI line crosses below its signal line → Sell signal.
- Usage: This is the most common trading signal for TSI. Because the TSI line itself is already very smooth, its crosses with the signal line often generate fewer false signals than MACD’s fast/slow line crosses.
- A bullish cross (TSI above Signal) occurring above the zero line → Buy/add-on opportunity in an uptrend.
- A bearish cross (TSI below Signal) occurring below the zero line → Sell/add-to-short opportunity in a downtrend.
- Crosses near the zero line require more caution, possibly indicating consolidation.
「TSI Primary Use: Signal Line Crossovers」
3. Overbought/Oversold Zones (OB/OS – Relative Reference):
-
- While theoretically unbounded, TSI’s fluctuations are often contained. Common practice uses +25 / -25 as relative OB/OS reference lines.
- TSI > +25 → Relatively Overbought.
- TSI < -25 → Relatively Oversold.
- Usage:
- Do NOT use directly for reversal trades!
- Can help gauge the reliability of signal line crosses. E.g., a bullish cross from the < -25 zone might be more reliable; a bearish cross from the > +25 zone might be more reliable.
- Can indicate that the trend might be short-term overextended.
TSI Advanced Plays (Pro Level – Precision Momentum Analysis):
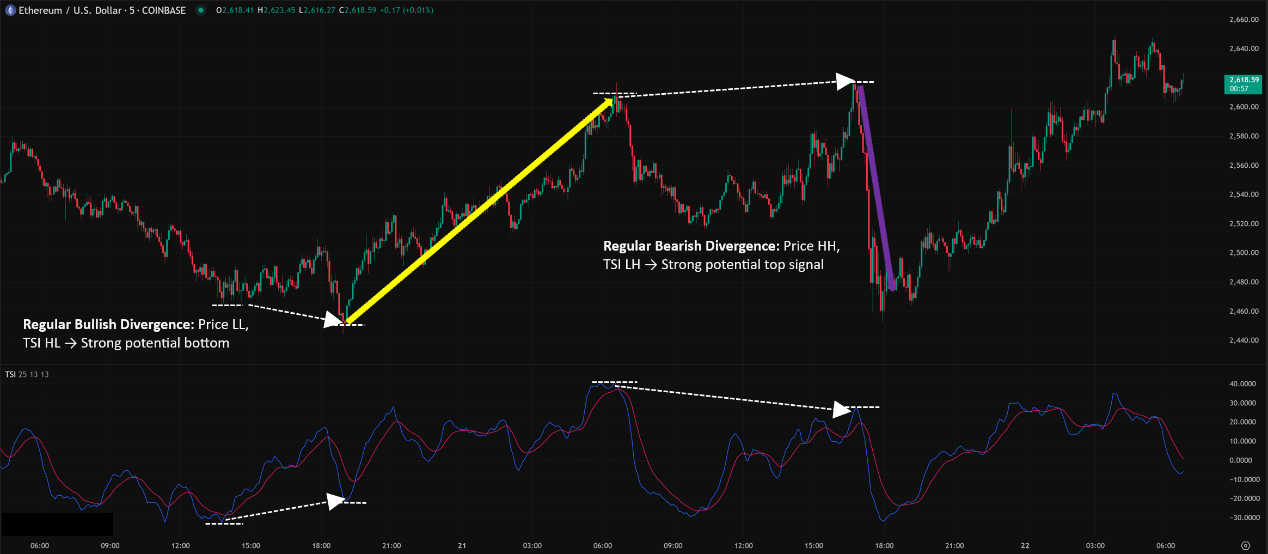
- Divergence (TSI Excels Here!):
- TSI’s smoothness makes its divergence signals often very clear and less noisy!
- Regular Bullish Divergence: Price LL, TSI HL → Strong potential bottom signal.
- Regular Bearish Divergence: Price HH, TSI LH → Strong potential top signal.
- Hidden divergence also applies for trend continuation.
- Advantage: Compared to RSI/Stoch divergence, TSI divergence, thanks to double smoothing, is often considered more reliable and less likely to be negated by short-term noise.
「TSI’s Ace: Clear & Reliable Regular Divergence」
2. Trendline/Pattern Breaks on TSI:
-
- Because the TSI line is smooth, drawing trendlines or identifying patterns (W-bottoms, M-tops) on it is often easier and clearer. A break of a TSI trendline/pattern can provide an early warning of a potential price break.
3. Using TSI as a Trend Strength Filter:
-
- TSI consistently staying above the zero line, with the signal line tracking → Confirms healthy uptrend momentum.
- TSI consistently staying below the zero line, with the signal line following → Confirms healthy downtrend momentum.
- If TSI repeatedly crosses the zero line or oscillates tightly around it → Likely a ranging market, exercise caution with trend strategies.
TSI Parameter/Timeframe Breakdown (What Settings are Truly True?):
Core Parameters: (r, s, sig)
- r (Long EMA Period): For the first momentum smoothing. Affects capturing longer trend momentum. Default = 25.
- s (Short EMA Period): For the second smoothing. Affects the final TSI line’s smoothness and responsiveness. Default = 13.
- sig (Signal Line Period): EMA period for calculating the signal line. Affects crossover frequency and lag. Default = 9 (some platforms might use 7 or 13).
- Standard Default: (25, 13, 9). This is the combo recommended by William Blau, considered a good balance for trend following and smoothness on daily charts.
Parameter Settings Analysis & “Hottest” Combo Discussion:
- Is (25, 13, 9) the Best? It’s the most standard, well-thought-out setting, especially for Daily / Weekly charts aiming to capture major swing momentum. Sticking with the default is often wise.
- Common Directions for Tweaking (Test Carefully!):
- Want it Faster? (For shorter-term H1/H4?):
- Could try shortening ‘s’ (second smooth), e.g., (25, 7, 9). Makes the TSI line react faster but less smooth.
- Could try shortening both ‘r’ and ‘s’, e.g., (14, 7, 9). Makes the whole indicator faster but potentially loses Blau’s intended balance, behaving more like a standard momentum indicator.
- Want it Slower/Smoother? (For ultra-long-term Weekly/Monthly?):
- Could try lengthening ‘r’ (first smooth), e.g., (50, 13, 9). Better captures long-term trend momentum.
- Could try lengthening both ‘r’ and ‘s’, e.g., (50, 25, 9). Indicator becomes very smooth, signals rare but potentially more reliable.
- Changing the Signal Line ‘sig’?
- Shorter ‘sig’ (e.g., 7) → Faster crosses, more false signals.
- Longer ‘sig’ (e.g., 13) → Slower crosses, fewer false signals.
- Want it Faster? (For shorter-term H1/H4?):
- Which “Unique” Combo is Hottest/Most Effective?
- No single “unique” combo overwhelmingly stands out. TSI’s design is already quite optimized.
- The most common “variation” might be the slightly faster (25, 7, 9), hoping for quicker reactions while retaining decent smoothness.
- But the Conclusion Remains: The default (25, 13, 9) is the most time-tested combo. If you want to adjust, it’s best to tweak only one parameter at a time (like ‘s’ or ‘sig’) and perform extensive backtesting.
「TSI Parameters: Balancing Speed & Smoothness」
Timeframe Analysis:
- All Timeframes Applicable! But N values might need adjustment, and signal meaning differs.
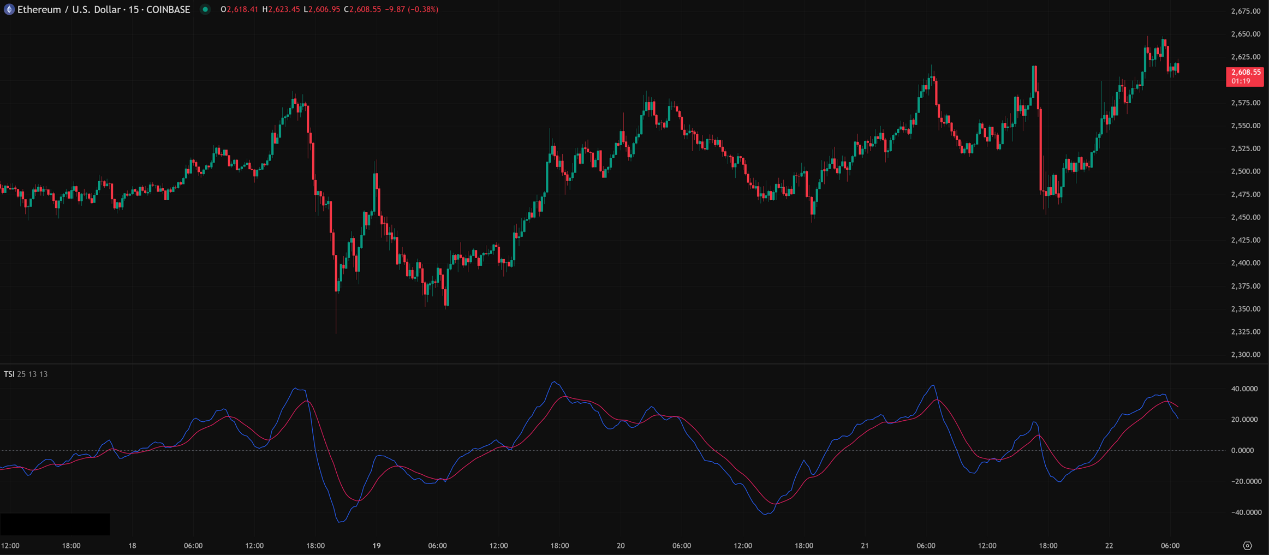
- Ultra Short-Term (M1, M5, M15):
- Using defaults (25, 13, 9) will be very laggy. Using ultra-short parameters (e.g., 14, 7, 7) makes it faster, but the double smoothing might still struggle with extreme volatility. Effectiveness is questionable.
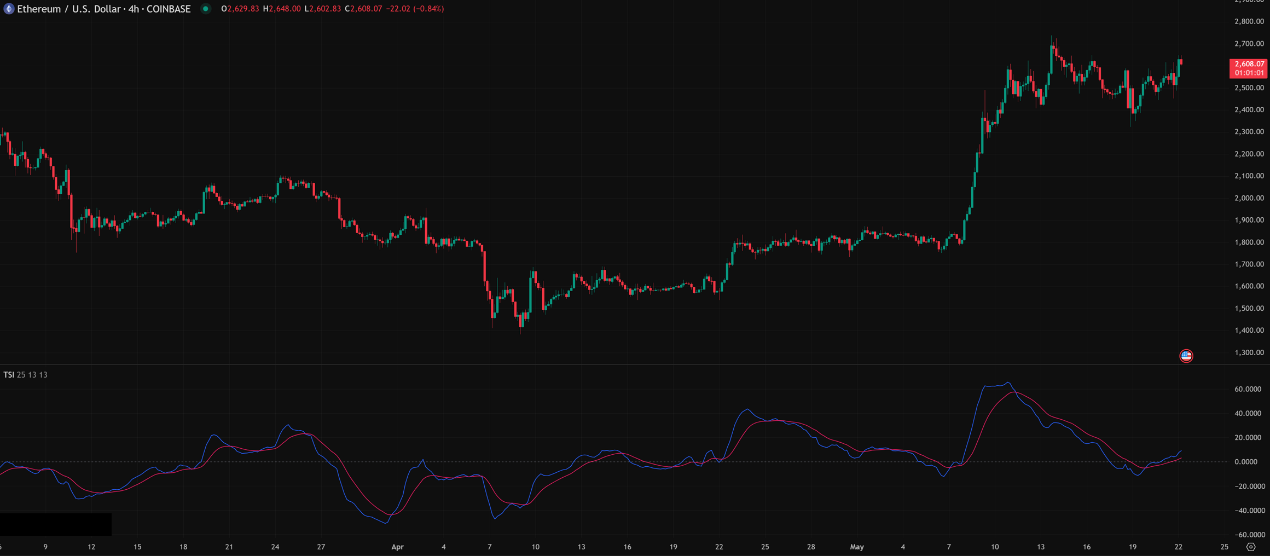
- Intraday / Short Swing (H1, H4):
- Common usage zone! Default (25, 13, 9) or the slightly faster (25, 7, 9) are applicable.
- Usage: Signal line crosses combined with zero line position, and divergence are the primary uses. TSI’s smoothness helps filter some noise here.
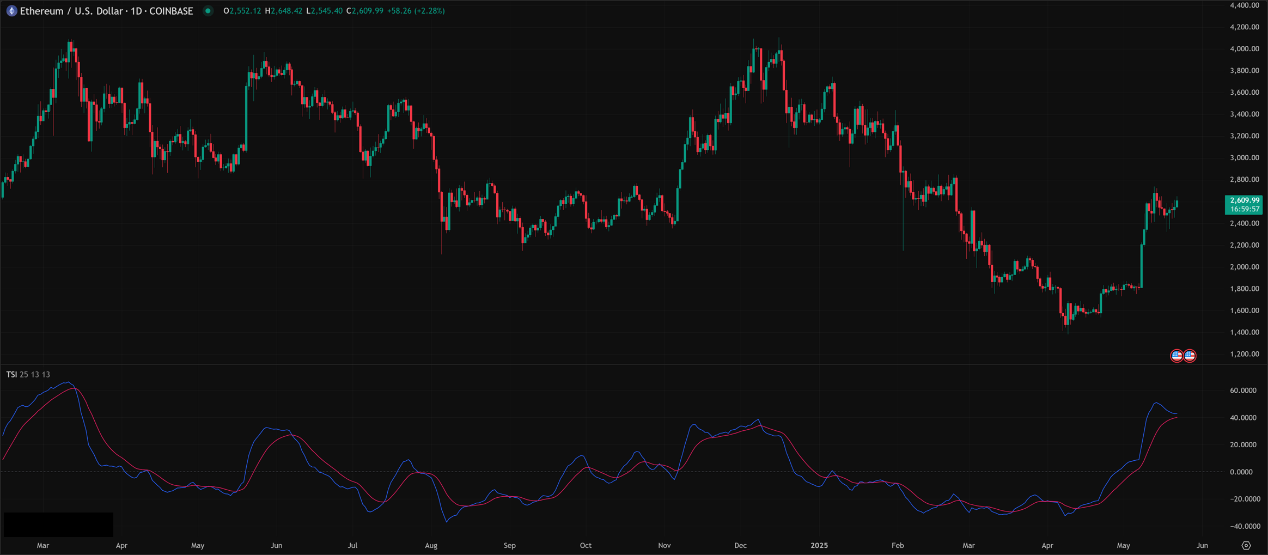
- Swing / Long-Term (Daily, Weekly):
- Where TSI truly shines!
- Usage (with default 25, 13, 9):
- Major trend confirmation: TSI position relative to zero.
- Major divergence warnings: Daily/Weekly TSI divergences are very significant reversal signals.
- Signal line crosses as swing entry/exit references.
「TSI Timeframes: Longer = More Reliable/Meaningful」
Summary: Which Unique Parameter Combo + Timeframe is Hottest & Most Effective? How to Use It?
- Parameters: Default (25, 13, 9) is the gold standard, most versatile. Try (25, 7, 9) for slightly faster reaction, requires testing.
- Timeframe: Daily / Weekly are optimal stages, best reflecting design intent. H4 / H1 are common usage zones. M15 or lower effectiveness diminishes.
- Hottest / Most Effective Usage = Leverage “Smooth Crossovers” + Master “Clear Divergence”:
- Signal line crosses are primary trade signals. Use zero line position for trend context.
- Divergence is a superpower! TSI’s smoothness makes divergence easier to spot and potentially more reliable.
- Use the zero line for major momentum direction.
- Use OB/OS (+/- 25) only as auxiliary reference, e.g., confirming crosses occurred at relative extremes.
- ALWAYS Combine with Price Action, S/R, etc.!
TSI: Your Momentum “Noise Reducer,” Providing Clearer Signals
The True Strength Index, through its clever double EMA smoothing, strikes an excellent balance between responsiveness and signal quality. It’s like a high-end audio noise reducer, filtering out static to let you hear the main melody clearly. Pros:
- Effectively smooths momentum, reducing false signals.
- Divergence signals are clear and reliable.
- Signal line crossovers relatively trustworthy.
- Zero line crosses react reasonably fast.
Cons:
- Calculation relatively complex.
- Still has lag (though potentially better than MACD signal crosses).
- Parameter combo, while standard, requires understanding its mechanics for tweaking.
「TSI: The Market Momentum Noise Reducer」

TSI is a well-designed, highly valuable advanced momentum indicator. If you find MACD too slow or RSI/Stoch too noisy, TSI might be just your cup of tea.
Next Steps:
- Add TSI (using default 25, 13, 9) to your H4, Daily, Weekly charts.
- Focus on observing TSI / Signal Line crossovers and their position relative to zero.
- Practice identifying TSI divergences relentlessly, compare them to RSI/MACD divergences.
- Note TSI’s behavior around the +/- 25 levels, but don’t rely on them heavily.
- Backtest! Test TSI signals within your trading system.
May you harness the True Strength and achieve consistent wins in the market! 💪✨🎵