Okay! Listen up, all you awesome traders! Time for another technical indicator deep dive! The big boss we’re breaking down today is something that every serious trader absolutely needs to know, maybe even uses every single day – it’s the legendary ATR (Average True Range)!📈
Why legendary? Because in crazy volatile markets like crypto (where things get choppy as hell!), or even if you want to play it safer in forex or stocks, ATR is your “risk ruler” and your “stop-loss locator”! It won’t tell you when to buy or sell, but it will tell you: how wild the market is right now, and how much “breathing room” your trade needs!
Wanna know how to use this ruler to survive better in the casino… oops, I mean, the market? Wanna know how to set stops so you don’t get faked out by market noise? Sit tight, ’cause we’re about to dissect ATR from top to bottom! Let’s Goooo!🚀
ATR Indicator: Its Origin Story (The Legend Behind the Indicator)
Who came up with this super important indicator?
- The Inventor: J. Welles Wilder Jr. Yep, him again! This legend in the technical analysis world (he also invented RSI, Parabolic SAR, ADX, etc.) first introduced ATR in his classic 1978 book, “New Concepts in Technical Trading Systems.”
- Original Purpose: Born for Commodities! Back then, Wilder mainly traded commodities futures. Commodities have a specific characteristic: price gaps are super common (like yesterday’s close being far from today’s open), and sometimes they hit limit moves (daily price change limits). If you just used the simple daily High – Low to calculate volatility, you’d completely miss the huge volatility from gaps or underestimate it during limit moves.
- The Solution: “True Range”! Wilder thought, “I need a way to capture the real price movement range within a day, regardless of gaps.” So he defined “True Range (TR)” and then averaged it out, creating the ATR we use today!
So, ATR was born to provide a more accurate, more comprehensive way to measure the market’s true daily (or periodic) volatility range, especially when price gaps occur.
How ATR is Calculated (The Core Logic)
To use it well, you gotta know where it comes from. Relax, no heavy math needed, just get the logic.
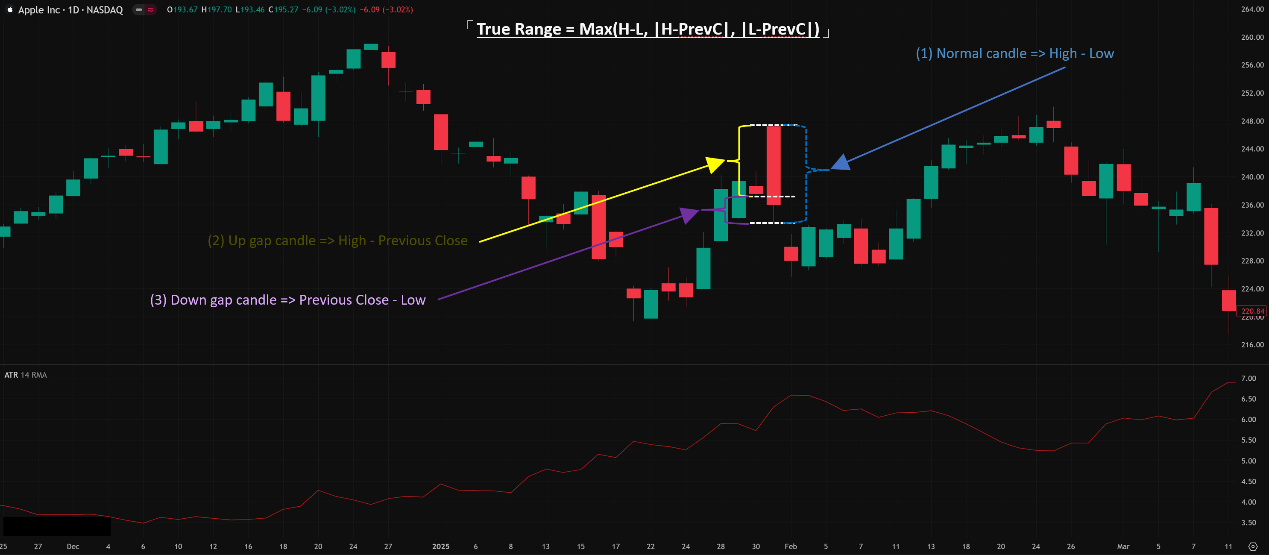
- Step One: Calculate “True Range (TR)”
- For each day (or each candlestick), the TR is the greatest of the following three calculations:
- Current High – Current Low: The basic intraday range.
- Current High – Previous Close : (Absolute value) This captures the volatility from an upward gap.
- Current Low – Previous Close : (Absolute value) This captures the volatility from a downward gap.
- Why take the maximum? Because Wilder wanted to ensure TR reflects the maximum true range of price movement for the period, no matter how price moved (normal fluctuation, gapped up, gapped down).
- For each day (or each candlestick), the TR is the greatest of the following three calculations:
- Step Two: Calculate “Average True Range (ATR)”
- After calculating the daily TR, you don’t use it directly because single-day TR can be erratic. So, you average it.
- ATR is typically calculated by taking a moving average (often Wilder’s own smoothed moving average, similar to an Exponential Moving Average – EMA) of the TR values over a specific period (e.g., 14 periods).
- The resulting ATR value represents the average true volatility range of the market over the recent past (for that specific period length).
Key Point: The ATR value is an ABSOLUTE price unit!
- For example, if Bitcoin’s daily ATR is 1500, it means that based on the past 14 days, Bitcoin’s average true daily range was about $1500 USD.
- If EURUSD’s H4 ATR is 0.0035, it means over the last 14 H4 candles, the average true range per candle was 35 pips.
- It’s NOT a percentage! This is different from Historical Volatility (HV).
Think of it like a ruler:
ATR tells you, on average, how many “units” (dollars / pips / points) this asset has been moving recently per period.
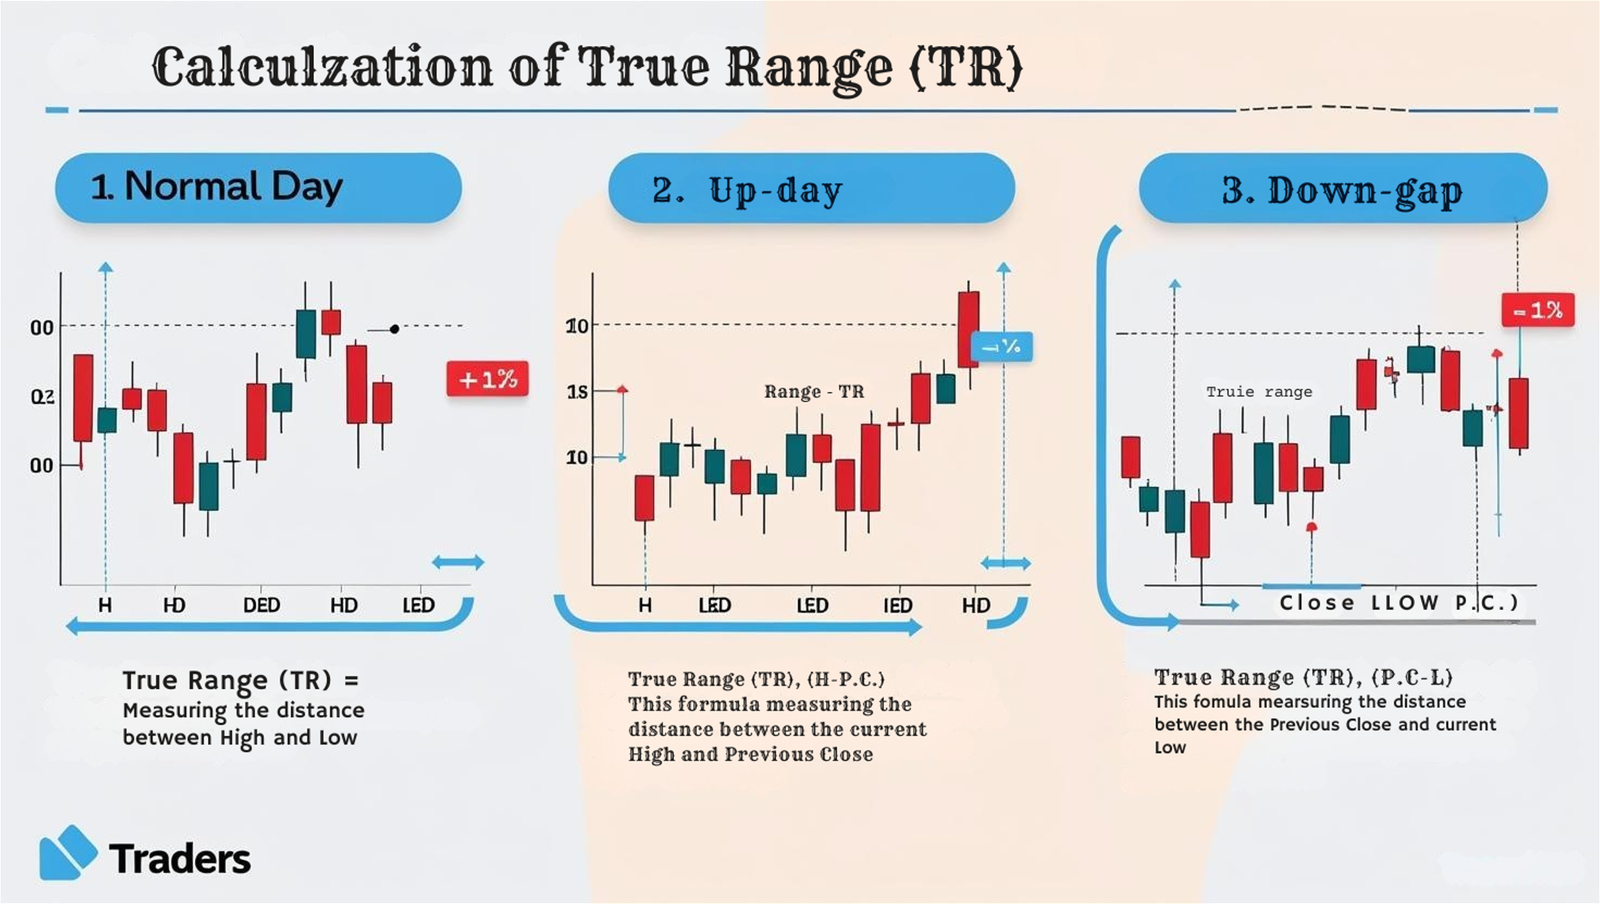
👇「True Range Calculation Explained (3 Scenarios)」
Basic & Advanced Ways to Use ATR (From Newbie Setup to Pro Toolkit)
👶Level 1: Basic Interpretation (The Core Function)
The most basic use of ATR is just to tell you how “active” the market is:
- High ATR:
- Meaning: Market volatility has been high recently, price swings per period are large.
- Examples: Often occurs after major news releases, when key support/resistance breaks, or during trend acceleration/reversal. Crypto bull/bear market starts or panic selling usually see ATR spike.
- Low ATR:
- Meaning: The market has been calm recently, price range per period is small.
- Examples: Often seen in sideways consolidation zones, around holidays, or when the market lacks direction.
- CRITICAL WARNING! ⚠️ ATR is NOT a Directional Indicator!
- Rising ATR only means volatility is increasing. This could be due to a big rally OR a big crash!
- Falling ATR only means volatility is decreasing. It doesn’t mean price won’t move, just that the moves are less intense.
- NEVER assume a rising ATR means buy, or a falling ATR means sell!
👇「High vs. Low ATR Levels on Chart」

🚀Level 2: Advanced Plays – Where ATR Truly Shines (Pro Applications)
This is where ATR becomes essential! Why is it a must-have for traders? Because of these uses:
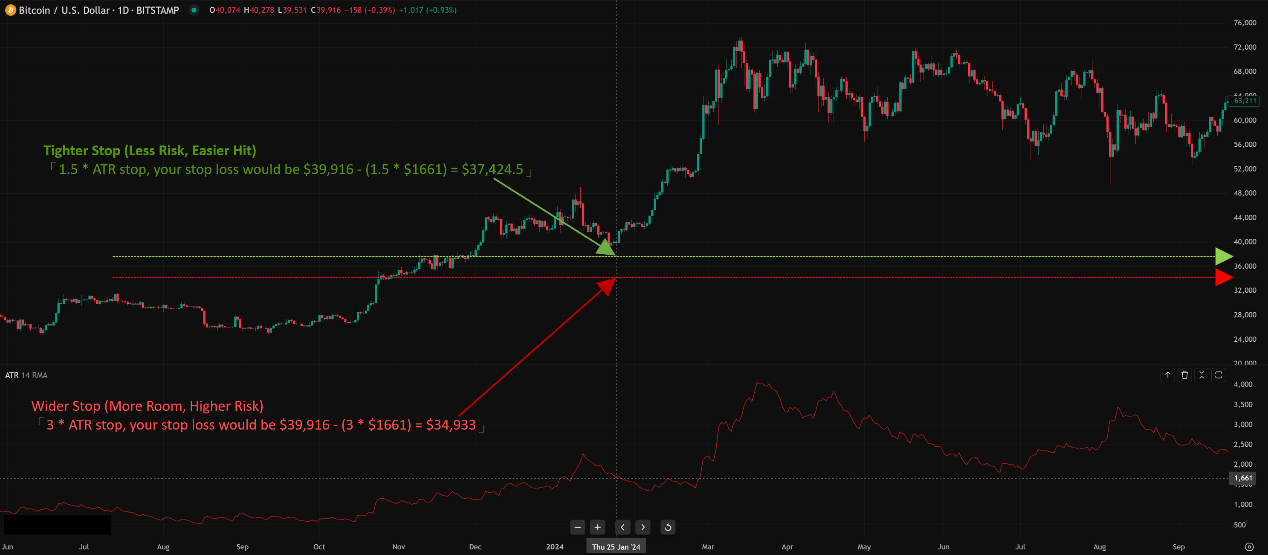
A. Setting Stop Losses (The #1 Use Case!)
- The Problem: Set stops too tight, and normal market “noise” easily takes you out. Set them too wide, and one loss can hurt bad. What to do?
- The ATR Solution: Use ATR as your measuring stick! Since ATR reflects the market’s recent average volatility, setting stops based on a multiple of ATR allows you to adjust your stop distance based on the market’s own volatility, instead of guessing or using fixed points.
- Common Method: ATR Multiples
- Going Long: Entry Price – (N * ATR Value) = Stop Loss Price
- Going Short: Entry Price + (N * ATR Value) = Stop Loss Price
- What is N? This depends on personal choice and risk tolerance. Common multiples are 1.5, 2, 2.5, or 3.
- Smaller N (e.g., 1.5): Tighter stop, smaller risk per trade, but easier to get stopped out. Better for short-term.
- Larger N (e.g., 2.5 or 3): Wider stop, gives price more “breathing room,” less likely to get shaken out by noise, but potential loss per trade is larger. Better for swing or trend trading.
- Example: You buy Bitcoin at $40,000. The daily ATR(14) at that time is $1500. If you use a 2 * ATR stop, your stop loss would be $40,000 – (2 * $1500) = $37,000.
- Advanced: ATR Trailing Stop
- This is even cooler! Not only use ATR for initial stops, but also use it to dynamically adjust the stop loss as price moves in your favor, locking in profits.
- For Longs: Stop Loss = Max (Current Stop, Current Candle High – N * ATR) or Max (Current Stop, Current Candle Close – N * ATR)
- For Shorts: Stop Loss = Min (Current Stop, Current Candle Low + N * ATR) or Min (Current Stop, Current Candle Close + N * ATR)
- Many trading platforms have built-in ATR Trailing Stop indicators to automate this.
👇「ATR Multiple Stop Loss Example (Long Position)」
B. Position Sizing
- Core Idea: The dollar amount risked on each trade should be roughly consistent (e.g., risking only 1% of your account per trade).
- ATR’s Role: Because different market conditions and assets require different stop distances (calculated using ATR), ATR helps determine your position size.
- If ATR is high (high volatility), you need a wider stop (e.g., 3 * ATR). To keep the dollar risk constant, your position size must be smaller.
- If ATR is low (low volatility), you can use a tighter stop (e.g., 1.5 * ATR). Therefore, your position size can be larger.
- Simple Logic: (Dollar Amount You Want to Risk) / (Stop Distance in Dollars/Points based on ATR) = Number of Contracts/Shares to Trade.
- Result: This makes your risk management more standardized and objective. You won’t accidentally risk more money just because an asset is more volatile.
C. Judging Market Character & Filtering Trades
- Low ATR Environment: Market might be ranging. Breakout trades might have a lower success rate (more false breakouts), trend-following strategies might perform poorly. Range trading strategies might be more suitable.
- High ATR Environment: Market is volatile. Trends might be strong, but reversals can also be swift. May require quicker reactions or wider stops.
- ATR Spikes/Drops: Can signal a change in market state. For example, a sudden spike in ATR from low levels, combined with a price breakout, could be a strong signal of trend initiation.
D. Parameter Settings & Timeframes
- Default Parameter: 14 Periods
- Why 14? This was Wilder’s recommended value and has become the market standard. 14 periods (whether days, H4, H1) provides a relatively balanced view of recent volatility.
- How Global Traders Play It (Global Variations & Styles):
- Short-Term/Day Traders (Scalpers/Day Traders – Common in Crypto, FX):
- Parameters: Tend to use shorter periods, like 5, 7, 9, 10.
- Reason: Need faster reflection of the last few bars’ volatility to keep stops tighter.
- Example: Using ATR(7) on an M5 / M15 chart for very close stops.
- Swing/Trend Traders (Across various markets):
- Parameters: Might stick with 14, or use slightly longer periods like 20, 21 (approx. one trading month), or even 50.
- Reason: Want a smoother reading representing medium-term volatility, avoiding stop placement being affected by short-term noise.
- Example: Using ATR(21) on a D1 chart for setting trailing stops in a trend-following strategy.
- Long-Term Investors:
- Parameters: Might use 50 or even 100 periods.
- Reason: Concerned with long-term, structural volatility levels.
- Short-Term/Day Traders (Scalpers/Day Traders – Common in Crypto, FX):
- Timeframe Impact (CRITICAL!):
- For the same asset, ATR values on different timeframes can be vastly different! Bitcoin’s Daily ATR might be $1500, but its H1 ATR might only be $300.
- When using ATR for stops or position sizing, you MUST use the ATR value from your primary trading timeframe! You cannot use a Daily ATR to set an H1 stop; that would be wildly incorrect.
E. Which Combos Are “Hot” & Effective? (The “Hot” Combos & Best Practices)
ATR itself isn’t usually part of complex indicator combos; its power is in its direct application. But some common practices and related indicators are worth noting:
- Combo 1: ATR Trailing Stop (A powerful application itself)
- Settings: ATR(14) or adjusted to your style, Multiplier N (1.5-3).
- Timeframe: Match your trading timeframe.
- Use: As described earlier, dynamically locks in profit, gives trends room, protects gains. Used in many successful trend-following systems.
- Effect: Mechanizes the stop-loss/profit-taking process, reducing emotional decisions.
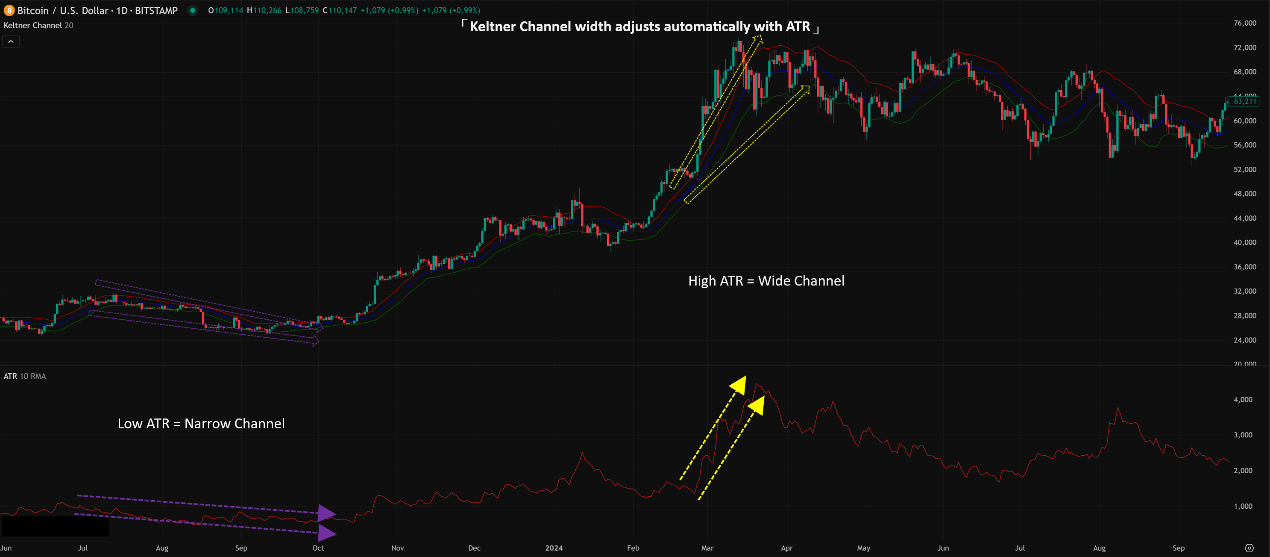
- Combo 2: Keltner Channel (KC) – ATR’s Cousin
- Settings: KC typically uses an EMA midline, with upper/lower bands at Midline +/- (N * ATR). Common settings are EMA(20), ATR(10), N=1.5 or 2.
- Timeframe: Applicable on various timeframes.
- Use: KC band width adjusts automatically based on ATR. High ATR = wide channel, Low ATR = narrow channel. Can be used to identify potential overbought/oversold conditions (price touching/exceeding bands) or combined with Bollinger Bands for “Squeeze” plays (refer back to our Standard Deviation discussion on TTM Squeeze).
- Effect: Provides a dynamic price channel that adapts to market volatility better than fixed-width channels.
👇「Keltner Channel Example」
- Combo 3: Using ATR to Confirm Breakout Strength
- Settings: Price Chart + ATR Indicator.
- Timeframe: Match the timeframe you’re watching for breakouts.
- Use: When price breaks a key S/R level, if you simultaneously see ATR also rising significantly (spiking from lows), it suggests the breakout might be accompanied by real volatility expansion, potentially increasing its chances of success. If ATR is flat or falling during the break, it might be a false breakout.
- Effect: Acts as an additional filter for breakout signals.
F. Optimal Parameter Combos? (The Million Dollar Question Again!)
For ATR, the answer is still: NOPE! There’s no single parameter that’s always “best.”
Why?
- Asset Characteristics: Each Crypto/Stock/FX pair has unique volatility patterns.
- Market Environment: Bull, bear, or sideways markets might favor different ATR responsiveness.
- Trading Style: Scalping vs. Trend Following requires different reaction speeds and smoothness.
How to Choose?
- Start with 14: It’s the most common, balanced starting point.
- Consider Your Timeframe & Style:
- Short-term (M1-M15): Try 5, 7, 10.
- Mid-term (M30-D1): 14, 20, 21 are often sufficient.
- Long-term (W1+): 21, 50, or longer.
- Visual Backtesting: Put different ATR settings on your chart. See which setting’s stop levels (e.g., 2*ATR) look most reasonable historically – avoiding noise but not being excessively wide.
- Consistency is Key: Once you choose a parameter set, use it consistently within your strategy for stop setting and position sizing. Don’t arbitrarily switch between 10 and 20 periods.
Key Takeaways on Parameters/Timeframes:
- Default: 14 is the gold standard.
- Short-term/Fast Markets: Consider 5-10.
- Mid-Long Term/Trends: 14-21 or slightly longer.
- CRITICAL: ATR Timeframe MUST Match Your Trading Timeframe!
- Testing + Consistency rules.
The Bottom Line: ATR – Your Trading “Safety Net” (Final Verdict)
ATR might not be the sexiest indicator. It doesn’t give flashy crosses like MACD or overbought/oversold signals like RSI. But it is absolutely one of the most practical, fundamental, and indispensable tools in a trader’s kit. It’s your reliable helper in the wild markets for quantifying risk, setting protective stops, and maintaining consistency.
It helps you:
- Measure True Volatility: Gives an objective number, gaps included.
- Set Dynamic Stop Losses: No more guesswork; adapt to the market’s rhythm.
- Standardize Position Sizing: Keep risk controlled across all trades.
- Understand Market Conditions: Know when it’s “stormy” and when it’s “calm.”
For all you young traders aiming to play smarter and safer in crypto or any financial market, mastering ATR is a crucial step in leveling up from the newbie stage!👍
Remember:
- ATR measures volatility, not direction.
- Its core value lies in setting stops and sizing positions.
- Match parameters and timeframe correctly.
- Practice and testing are the real path to understanding.
Hope this super detailed breakdown helps you guys out! Go load up ATR on your TradingView / MT4 / MT5, add it to your charts, and start feeling its power! See ya next time! Keep Learning, Keep Earning! 💰✨