What’s up, Market Masters!😎 Time again for us to break down some killer technical analysis tools! Last time we looked at VPFR (Volume Profile Fixed Range), letting you pick the range yourself. Today, we’re unlocking its sibling – Volume Profile Session Volume (VPSV)! This one is even slicker because it automatically analyzes the volume distribution for each trading session (usually daily)! 📊⏰
Imagine this: no more manual drawing! Every day, it automatically maps out where the most action happened (POC) and the main battleground (VA) for that day. Pretty sweet, right? VPSV is especially awesome for Day Traders or Swing Traders looking to catch key intraday levels! Think of it as getting a “battlefield heatmap” delivered daily, showing the shifting focus of major players and market sentiment from session to session!
Wanna know how to use VPSV to find critical daily support and resistance? How to spot trend changes by observing daily profile shifts? How to use VPSV in the 24/7 crypto market? Okay! Eyes peeled, ’cause we’re about to show you how to master the pro-level uses of VPSV! Let’s get this session started!🔥
VPSV Indicator: Its Origin Story (Automating the Daily Volume Story)
VPSV is a key member of the Volume Profile family, born out of specific analytical needs.
- Evolution of the Volume Profile Family: Like VPFR, VPSV stems from the deeper pursuit of volume analysis, particularly inspired by Market Profile® concepts. However, VPFR requires manual range selection, and VPVR looks at the whole visible chart. Analysts needed a way to systematically and consistently analyze the internal structure of each individual trading session.
- Born for Session Analysis: Traditional markets (stocks, futures) have clear opening and closing times. Different sessions (e.g., Asia, Europe, US) have different participants and characteristics. VPSV was designed to capture these session-specific dynamics. It automatically segments the volume profile into discrete sessions (most commonly daily) allowing traders to easily compare and analyze market behavior day by day.
- A Day Trader’s Best Friend: For Day Traders who need to focus on intraday fluctuations and key levels, the automatically updated daily VPSV is incredibly convenient. They can quickly see yesterday’s Value Area (VA) and Point of Control (POC) to plan today’s strategy.
- How it Differs from VPFR/VPVR:
- VPFR: You manually pick start and end points to analyze a specific range.
- VPVR: Automatically analyzes all visible bars on your chart.
- VPSV: Automatically draws a separate profile for each distinct trading session (usually Daily/Weekly).
So, VPSV was created to automate and standardize Volume Profile analysis on a per-session basis, allowing traders to more easily track and compare the daily (or weekly) shifts in market value perception and points of high engagement.
How VPSV is Designed (Slicing and Dicing Volume by Session)
VPSV’s core logic is essentially the same as VPFR’s – plotting volume horizontally against price levels – but the key difference is its automatic session segmentation.
- Step One: Defining the “Session”
- VPSV first needs to know how to define a session. The most common setting is “Daily.” For stocks/futures, this means from market open to market close.
- For 24/7 markets like Crypto, it typically uses UTC time from 00:00 to 23:59 to define a “trading day.”
- Some platforms might allow custom sessions or “Weekly” profiles.
- Step Two: Calculating Profile for Each Session (Independently)
- The indicator automatically identifies each distinct session on the chart (e.g., each day).
- Then, it repeats the VPFR calculation process, but only using the candle data within that specific session:
- Segments the volume from each candle within the session across different price levels.
- Aggregates the total volume at each price level for that session.
- Draws the horizontal volume histogram next to the chart (usually aligned with that session’s candle range).
- Calculates and displays that session’s unique POC, VA (VAH/VAL), HVNs, and LVNs.
The Final Result: You see a vertical stack of Volume Profile charts on your screen, each profile corresponding to one trading session (e.g., daily). Each day has its own POC, VA, HVNs, and LVNs.
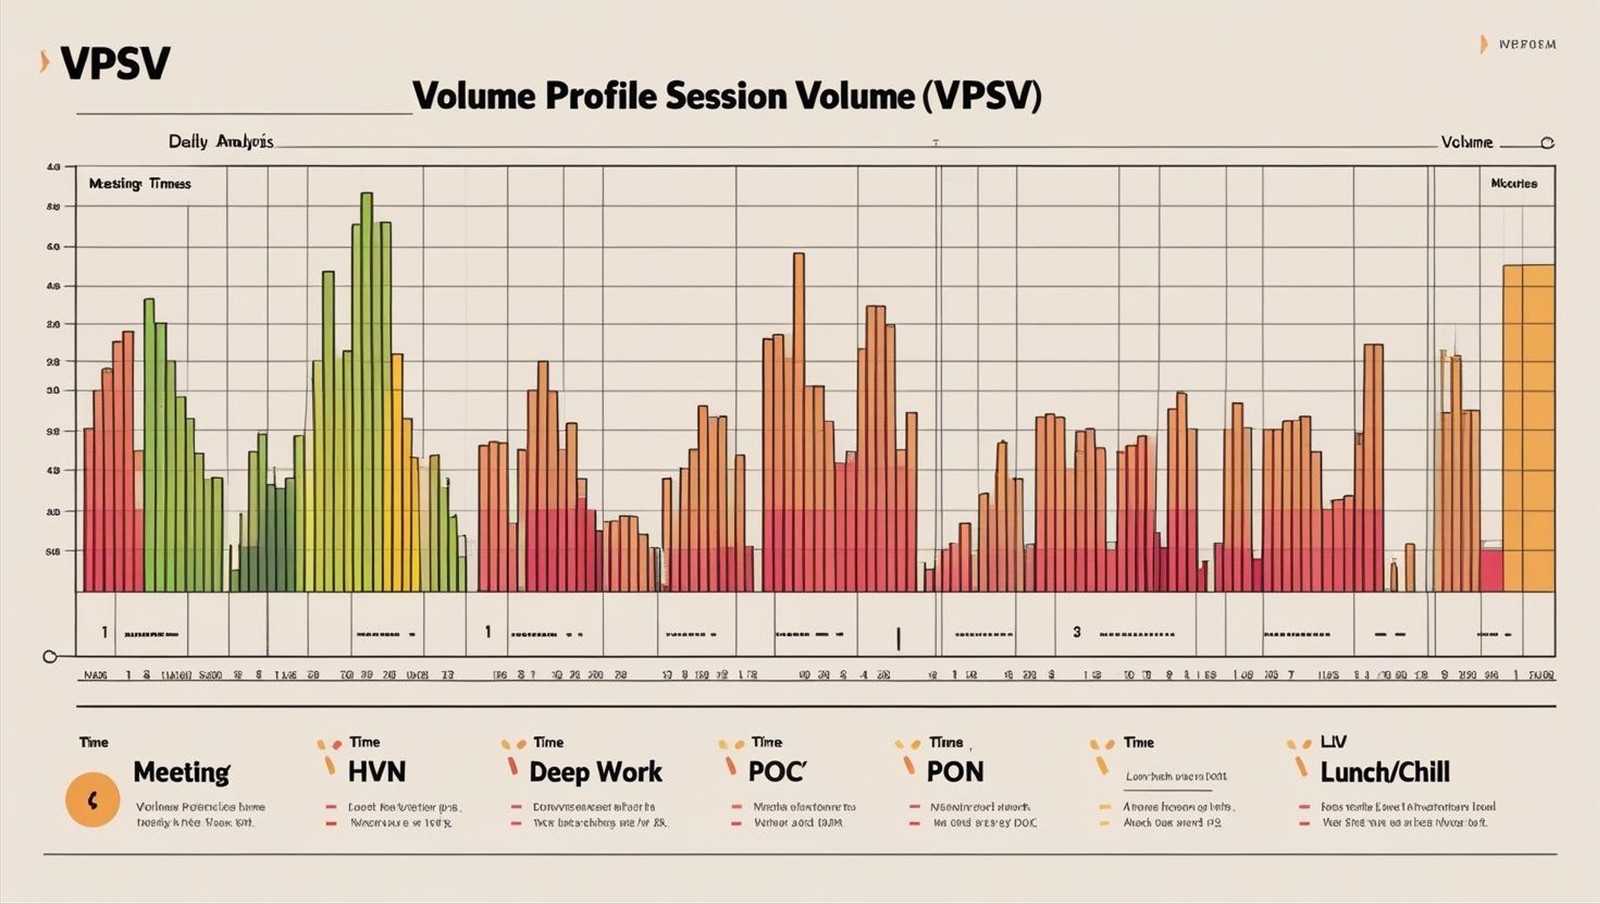
Think of Your Daily Schedule:
- VPSV automatically analyzes how you spent your time each day.
- “Meeting” times might have high volume (HVN).
- “Deep work” time might have volume concentrated at a specific level (POC).
- “Lunch/Chill” time might have very low volume (LVN).
- Each day’s schedule (profile) is different; VPSV helps you clearly see these daily variations.
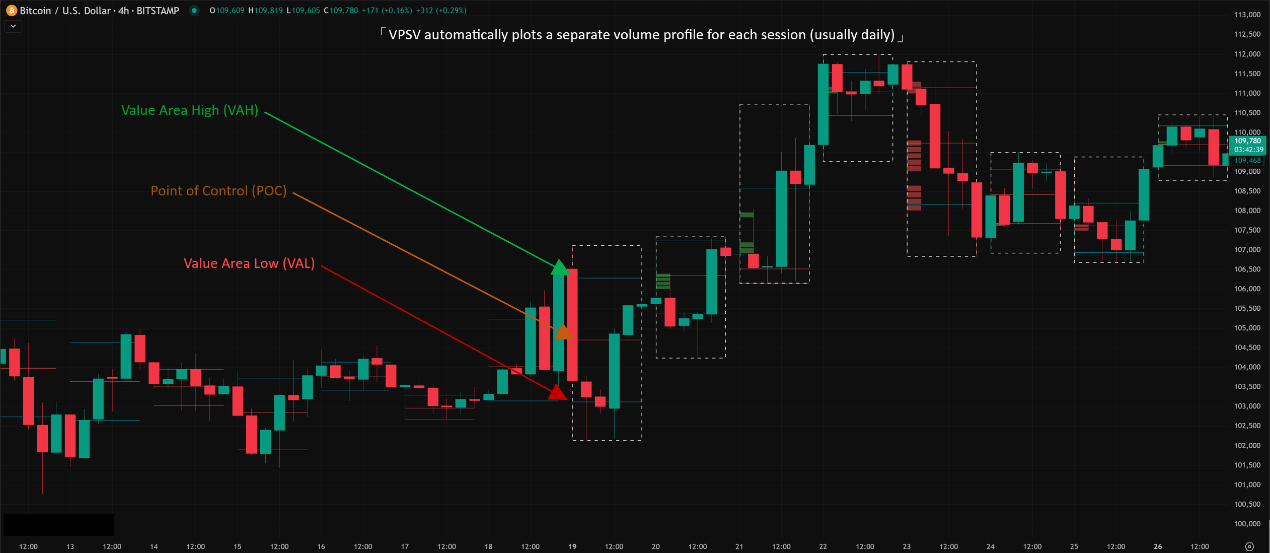
👇「Basic VPSV Appearance Explained」
Basic & Advanced Ways to Use VPSV (From Daily Levels to Value Migration)
VPSV’s main power comes from using information from past sessions to anticipate movement in the current or upcoming session.
👶Level 1: Basic Usage – Using Prior Session Data for Today’s Strategy
This is the classic, most direct way to use VPSV, especially popular among Day Traders:
- Using Prior Session’s POC, VAH, VAL as Today’s S/R:
- Principle: Markets have “memory.” Where the most volume traded yesterday (POC) and the generally accepted value range (VAH/VAL) often act as support or resistance today.
- How to Use:
- After Market Open: Pay attention if price tests yesterday’s POC. If price is above yesterday’s POC, it might act as support; if below, resistance.
- Price Approaching Yesterday’s VAH: Potential resistance. A break above VAH could open up room to move higher.
- Price Approaching Yesterday’s VAL: Potential support. A break below VAL could open up room to move lower.
- Effectiveness: Provides dynamically updated, volume-backed key S/R levels daily, potentially more objective than manually drawn lines.
- Observing Session POC/VA Position Shifts (Initial Trend Bias):
- POC Moving Up Daily + VA Range Shifting Up: 📈Suggests consistent buying pressure, rising market value perception – characteristic of an uptrend.
- POC Moving Down Daily + VA Range Shifting Down: 📉Suggests consistent selling pressure, falling market value perception – characteristic of a downtrend.
- POC & VA Ranges Overlapping Significantly for Days: ⚖️ Suggests market balance/consolidation, waiting for a breakout.
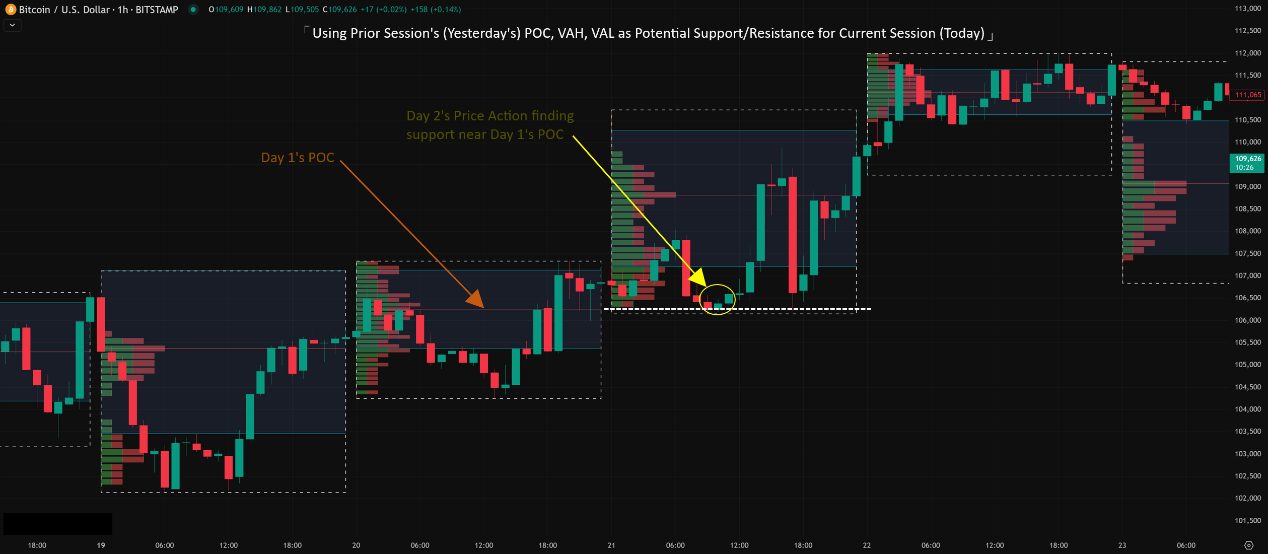
👇「Using Prior Day VPSV (POC, VAH, VAL) as Today’s S/R Example」
🚀Level 2: Advanced Plays – Reading Session Interaction & Value Migration
Mastering basic S/R allows for deeper analysis of inter-session profile relationships.
A. Value Area Migration for Trend Analysis:
- A powerful method for judging trend strength and persistence.
- Observe the VA range over consecutive days:
- VA Consistently Migrating Higher (Today’s VA range is above yesterday’s): 🐂Strong bullish signal. Shows the market continuously accepting higher prices as “fair value”; buyers are in control.
- VA Consistently Migrating Lower (Today’s VA range is below yesterday’s):🐻 Strong bearish signal. Shows the market continuously accepting lower prices; sellers are in control.
- VA Largely Overlapping (Today’s VA mostly overlaps yesterday’s): ⚖️ Market is in balance or consolidation. No clear directional bias. Could be range trading opportunities or waiting for a breakout.
- VA Completely Separate (No overlap between today’s and yesterday’s VA): Indicates a very strong trend or a significant gap/news event occurred.
B. POC Migration for Added Context:
- Observe the day-to-day shift in the POC location:
- POC Consistently Moving Higher: Supports an uptrend.
- POC Consistently Moving Lower: Supports a downtrend.
- POC Staying Near the Same Level: Market might be finding balance at this price.
- Caution: Sometimes price trends up, but POC moves down (e.g., P-shape profile), potentially warning of distribution at highs. Vice versa for lows. Always consider VA migration and price trend together.
👇「Value Area Migration Explained」

C. Opening Price vs. Prior Day Value Area: Gauging Intraday Bias
- A core tactical element for many Day Traders (derived from Market Profile® opening principles).
- Observe where today’s opening price is relative to yesterday’s VA:
- Open Within Prior VA:
- Higher probability the price will oscillate within or test the boundaries (VAH/VAL) of yesterday’s VA during the day. Suggests market balance/ranging. Strategy might favor range trades (short near VAH, buy near VAL, with confirmation). (Basis of the ‘80% Rule’ concept, but not absolute).
- Open Above Prior VA:
- Potential bullish signal. Indicates the market accepted higher value overnight/pre-market. If price holds above yesterday’s VAH, it may continue seeking a new, higher value area. Pullbacks to VAH could be buying opportunities.
- Open Below Prior VA:
- Potential bearish signal. Indicates the market rejected yesterday’s value. If price stays below yesterday’s VAL, it may continue seeking a new, lower value area. Rallies to VAL could be shorting opportunities.
- Open Within Prior VA:
- Key: The price action during the initial period after the open (e.g., first hour) is crucial for confirming whether the bias implied by the opening location holds true.
D. Parameter Settings & Time Intervals (VPSV Specifics)
- Core Parameter 1: Session Definition
- Standard: Daily. Most common and widely applicable setting.
- Crypto Markets: Usually follows UTC day.
- Stocks/Futures: Can often be set to Regular Trading Hours (RTH) to filter out pre/post-market noise and focus the profile on the main session’s activity. Check if your platform offers this.
- Other: Weekly profiles can show longer-term value shifts.
- Core Parameter 2: Number of Rows / Row Size
- Same as VPFR, affects resolution. Using the platform’s Auto or default value (e.g., 24 rows for daily) is usually sufficient. Don’t overcomplicate it.
- Core Parameter 3: Value Area Percent
- Standard: 70%. Stick with this in almost all cases.
- Chart Timeframe vs. VPSV Session:
- Important distinction! If you’re on an M15 chart, but VPSV Session is set to Daily, you’re still seeing the volume profile for the entire day, just calculated with finer M15 candle data (which can be more accurate than using just D1 data).
- Choosing Chart Timeframe: Match your trading style.
- Day Trader: Might use M5, M15, M30 charts but reference the Daily VPSV’s POC, VAH, VAL.
- Swing Trader: Might use H1, H4, D1 charts, observing Daily VPSV migration, or even switch VPSV session to Weekly.
E. Which Combos Are “Hot” & Effective? (Effective VPSV Strategies)
VPSV’s strength lies in its session-based nature and dynamic S/R. Effective strategies usually leverage these features.
- Hottest Strategy 1: Prior Day Level Strategy
- Core: Using yesterday’s POC, VAH, VAL as key battlegrounds for today.
- Execution: After the open, watch price interaction with these levels.
- Price holds firmly above prior VAH, retests VAH successfully? Potential long entry.
- Price breaks below prior VAL, fails to reclaim it on a rally? Potential short entry.
- Price chops around prior POC? Maybe wait for clearer bias or trade the range carefully.
- Effect: Provides daily, volume-backed levels for day trading setups.
- Hottest Strategy 2: Opening Range vs. Prior VA Breakout/Reversion
- Core: Using the opening price relative to yesterday’s VA to establish an initial intraday bias.
- Execution:
- Open > Prior VA -> Lean long, look for buy setups on dips to VAH.
- Open < Prior VA -> Lean short, look for sell setups on rallies to VAL.
- Open within Prior VA -> Consider range tactics initially, watch for tests of VAH/VAL or a breakout from the VA.
- Effect: Offers a quick framework for assessing potential intraday direction early on.
- Hottest Strategy 3: Value Migration Trend Following
- Core: Using the consistent directional shift of VA/POC to confirm and participate in medium-term trends.
- Execution:
1. Observe VPSV over several days to confirm steady upward/downward migration of VA/POC.
2. If migration aligns with the trend identified by other means (e.g., MAs), increases confidence in trend trades.
3. Look for entries in the direction of the trend on pullbacks to the current or prior day’s POC/VAL/VAH.
-
- Effect: Uses the shifting center of gravity (volume-weighted) to validate trend reality and persistence.
F. Best Parameter Combos? (The Parameter Verdict for VPSV)
- Session Definition:
- Standard/Start Point: Daily. Most versatile.
- Stock/Futures Day Traders: Consider RTH setting if available.
- Internal Parameters (Rows, VA%):
- Stick to platform defaults or standard values (e.g., 70% VA). Minimal benefit in tweaking unless you have advanced, tested reasons.
Conclusion: The essence of VPSV lies in understanding the “Session” concept and interpreting profile interactions, not tweaking minor settings!
The Bottom Line: VPSV – Your Daily Market Heatmap (The Wrap-up)
Volume Profile Session Volume (VPSV) is an extremely practical tool within the Volume Profile family, especially valuable for traders focusing on session-based dynamics. It automatically dissects the market, giving you a clear view of:
- Each session’s value core (POC) and range (VA).
- Daily updated, volume-backed S/R levels.
- The migration path of market value perception (Value Migration).
- Potential intraday directional bias.
It helps you:
- Formulate intraday trading strategies.
- Confirm the persistence of trends.
- Pinpoint entry, stop, and target levels with more precision.
- Understand market behavior across different trading sessions.
For young traders wanting to master the intraday rhythm or improve swing trading by tracking daily shifts in money flow focus, VPSV is an indispensable weapon to master!
Remember:
- VPSV’s core is session-based analysis.
- Prior day’s data is highly relevant for the current day.
- Value Area / POC migration is a powerful trend tool.
- Opening price vs. Prior VA offers key intraday clues.
- Use default parameters; focus on interpretation.
- Combine with Price Action and other analysis!
Alright! Hope this comprehensive guide to VPSV helps you level up! Load it onto your charts and start observing the daily “heatmap” of the market! Catch you later! Keep evolving!🧠💥