Okay Okay! What’s up, Candlestick Warriors and future Trading Masters! Ready for this? Today, we’re unlocking something that isn’t some complex mathematical indicator, but rather the most, most, most fundamental, yet incredibly powerful language of technical analysis – Candlestick Patterns! ️🕯️📈📉
That’s right! Those red and green (or black and white) “little candles” you stare at all day! Don’t think they just show if the price went up or down. Each candlestick, and especially combinations of them, is actually a micro-snapshot of the hand-to-hand combat between bulls and bears! They’re like the market’s “emojis” or “Morse code.” If you learn to decode them, you can spot shifts in market sentiment earlier and catch potential trading opportunities!
Wanna know how to read pressure and support from a single candle? Wanna learn to ID the classic reversal and continuation patterns? Wanna know how to use candlestick patterns like a pro? This time, let’s dive deep into the world of candlesticks, from their origins, basic interpretation, to advanced strategies, and completely master this “ancient Eastern art”! Let’s read the candles!🔥
Candlestick Patterns: The Origin Story (From Rice Trading to Global Charts)
Candlestick charts weren’t invented on modern Wall Street. Their history is long and has a touch of Eastern mystique.
- Birthplace: 18th Century Japanese Rice Market – Legend has it that during the Tokugawa Shogunate, a legendary rice merchant named Munehisa Homma existed. To navigate the rice futures market of the time, he began recording the open, high, low, and close prices of rice each day, along with market sentiment. He gradually developed a method using graphical representations (early forms of candlesticks) to predict prices. He’s basically the “grandmaster” of candlestick analysis!
- How Did It Reach the West? Thanks to Steve Nison – While candlestick charting was used in Japan for centuries, it remained largely unknown in the West. That changed in the early 1990s when American technical analyst Steve Nison introduced candlestick charting and its various patterns in detail to the Western world through his hugely popular book, Japanese Candlestick Charting Techniques. It caused a sensation, and candlestick charts have since become a standard analysis tool for traders globally.
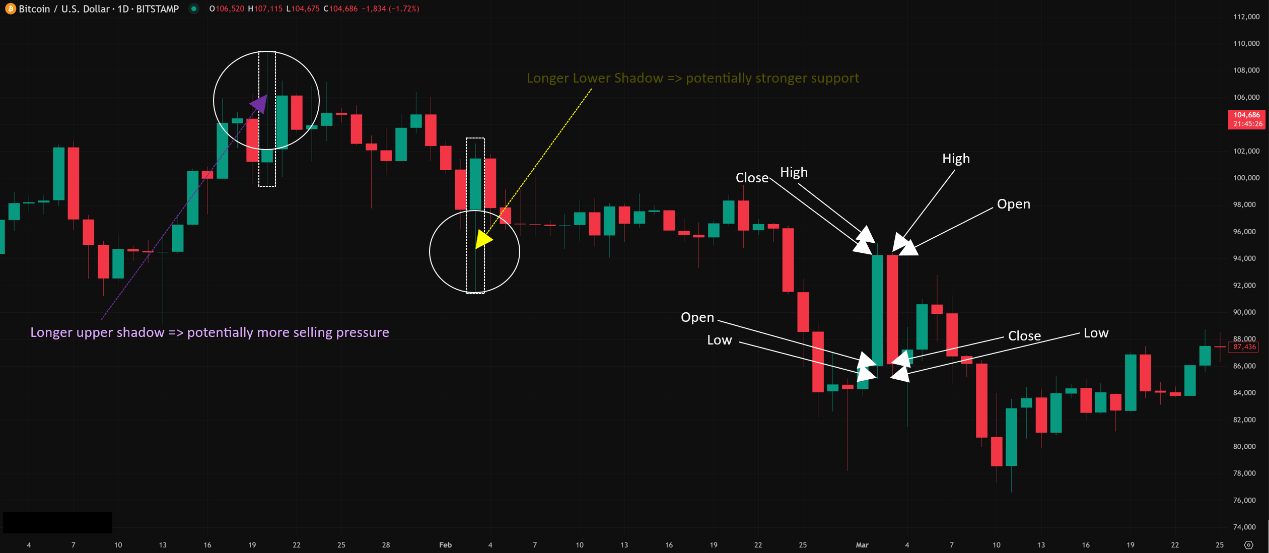
- Core Concept: Candles Contain Price, Time, and Emotion – The brilliance of candlesticks lies in how a single “candle” packs four key price points (Open, High, Low, Close – OHLC) for a specific period. Furthermore, through the size of its Real Body and the length of its Shadows (Wicks), it visually represents the power struggle between buyers and sellers and the prevailing market sentiment during that period.
So, candlestick pattern analysis isn’t new; it’s a visual analysis technique refined over centuries of practical application, combining price action with market psychology.
Anatomy of a Candle (Dissecting the Candlestick!)
To read candlestick patterns, you first need to understand the information packed into a single candle.
- Real Body:
- This is the thick, central part of the candle. It shows the distance between the Open and Close price.
- Bullish Candle (Usually Green/White): The Close price is higher than the Open price. A longer body indicates stronger buying pressure and momentum.
- Bearish Candle (Usually Red/Black): The Close price is lower than the Open price. A longer body indicates stronger selling pressure and momentum.
- Small Body: Open and Close prices are close together. Indicates indecision or a potential balance between buyers and sellers.
- Shadows (Wicks):
- The thin lines extending above and below the real body.
- Upper Shadow: The top point is the period’s High price; the bottom connects to the top of the real body. It shows how high the price went before pulling back towards the close, representing selling pressure or profit-taking from above. Longer upper shadow = potentially more selling pressure.
- Lower Shadow: Connects to the bottom of the real body; the bottom point is the period’s Low price. It shows how low the price went before bouncing back towards the close, representing buying support from below. Longer lower shadow = potentially stronger support.
A Single Candle Tells a Story:
- Long Green Body, Short Wicks: Buyers dominated from start to finish. Strong!
- Long Red Body, Short Wicks: Sellers dominated from start to finish. Weak!
- Long Upper Wick, Small Body: Price rallied high but got rejected. Sellers fought back successfully near the top. Potential topping signal?
- Long Lower Wick, Small Body: Price dipped low but recovered. Buyers fought back successfully near the bottom. Potential bottoming signal?
- Doji (Open ≈ Close): Very small or non-existent body. Intense battle, indecision. Potential turning point signal.
👇「Candlestick Anatomy Diagram (Labeling OHLC, Body, Wicks)」
Basic & Advanced Ways to Use Them (From Single Candles to Powerful Patterns)
Once you can read individual candles, the next step is learning to recognize patterns formed by combinations of candles. Patterns generally fall into three categories: Bullish Reversal, Bearish Reversal, and Continuation. Reversal patterns usually get the most attention and can be more powerful.
👶Level 1: Recognizing Classic Patterns
Here are some of the most common and important reversal patterns (Remember: where they appear is crucial!):
A. Bullish Reversal Patterns (Usually appear at the bottom of a downtrend):
- Hammer:💚
- Appearance: Small real body, long lower shadow (usually 2x body size or more), very short or no upper shadow. Looks like a hammer.
- Meaning: In a downtrend, price made a new low, but strong buying pressure pushed the price back up to close near the open. Sellers exhausted, buyers stepping in.
- Inverted Hammer:💚
- Appearance: Small real body, long upper shadow, very short or no lower shadow. Looks like an upside-down hammer.
- Meaning: In a downtrend, buyers tried to push the price up, but couldn’t hold the highs at the close. Still shows buyers testing the waters, potential bottoming signal (needs stronger confirmation).
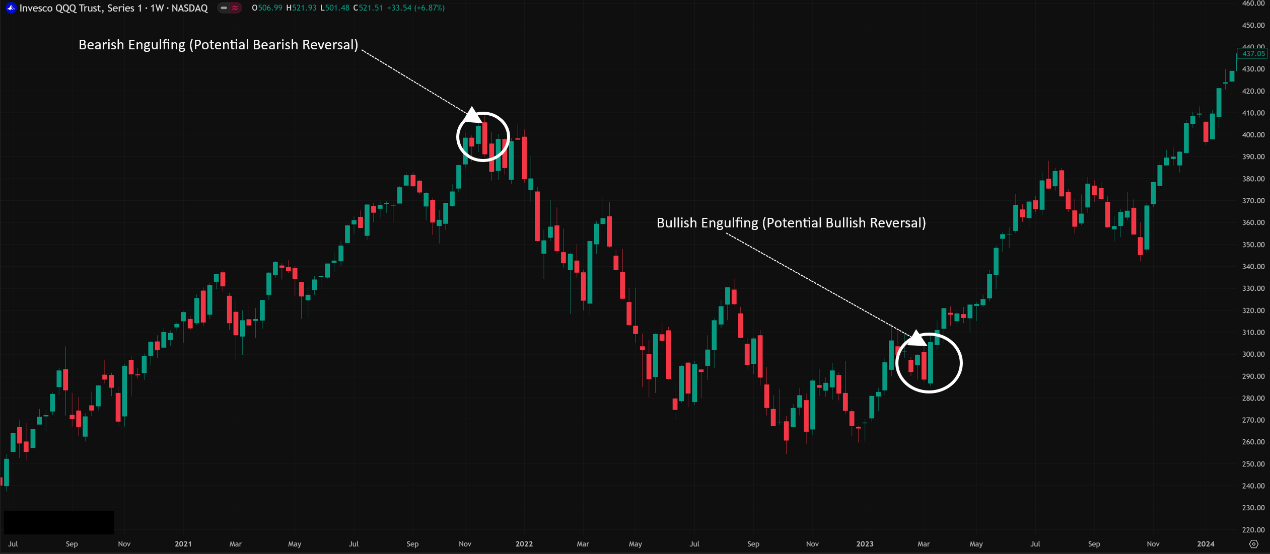
- Bullish Engulfing:💚💚
- Appearance: Two candles. First is bearish. The second is a larger bullish candle whose real body completely engulfs the real body of the first bearish candle.
- Meaning: Selling pressure (first candle) is completely overwhelmed by stronger buying pressure (second candle). A relatively strong bullish reversal signal.
- Piercing Line:💚
- Appearance: Two candles. First is a long bearish candle. Second is a bullish candle that opens below the prior low (gaps down) but closes more than halfway up the body of the first bearish candle.
- Meaning: Despite a pessimistic open, buyers fought back strongly, reclaiming significant ground. Strong bullish implications.
- Morning Star:💚💚💚
- Appearance: Three candles. First is a long bearish candle. Second is a small-bodied candle (the “Star,” can be bullish, bearish, or Doji) that ideally gaps down from the first. Third is a strong, long bullish candle that closes deep into the body of the first bearish candle.
- Meaning: Like darkness (long bear), followed by a star (indecision), then sunrise (long bull). Represents the downtrend stalling and buyers taking control. A relatively reliable bullish reversal pattern.
B. Bearish Reversal Patterns (Usually appear at the top of an uptrend):
- Shooting Star: ❤️
- Appearance: Small real body, long upper shadow (usually 2x body size or more), very short or no lower shadow. Looks like a meteor falling.
- Meaning: In an uptrend, price made a new high, but heavy selling pressure pushed the price back down to close near the open. Buyers exhausted, sellers stepping in.
- Hanging Man: ❤️
- Appearance: Looks identical to a Hammer (small body, long lower shadow) but appears at the top of an uptrend.
- Meaning: In an uptrend, price dropped significantly during the period but managed to close near the open. Shows potential weakening of underlying support, latent selling pressure. A bearish signal that requires strong confirmation (e.g., a big bearish candle next day).
- Bearish Engulfing: ❤️❤️
- Appearance: Two candles. First is bullish. The second is a larger bearish candle whose real body completely engulfs the real body of the first bullish candle.
- Meaning: Buying pressure (first candle) is completely overwhelmed by stronger selling pressure (second candle). A relatively strong bearish reversal signal.
- Dark Cloud Cover: ❤️
- Appearance: Two candles. First is a long bullish candle. Second is a bearish candle that opens above the prior high (gaps up) but closes more than halfway down the body of the first bullish candle.
- Meaning: Optimistic open is strongly rejected by sellers, erasing most of the previous gains. Strong bearish implications.
- Evening Star: ❤️❤️❤️
- Appearance: Three candles. First is a long bullish candle. Second is a small-bodied candle (the “Star”) that ideally gaps up from the first. Third is a strong, long bearish candle that closes deep into the body of the first bullish candle.
- Meaning: Like daylight (long bull), followed by a star (indecision), then nightfall (long bear). Represents the uptrend stalling and sellers taking control. A relatively reliable bearish reversal pattern.
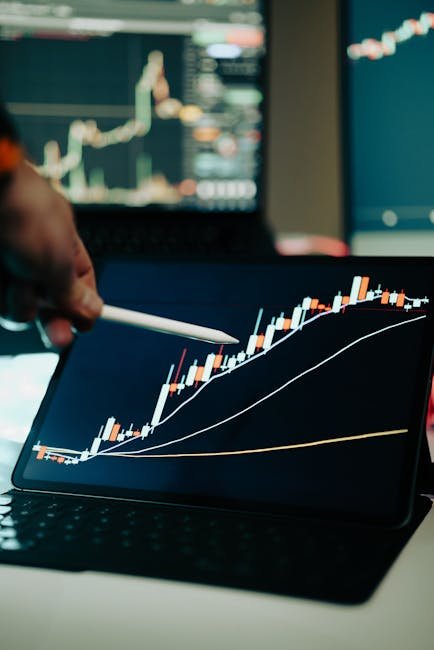
👇「Classic Candlestick Reversal Patterns (e.g., Engulfing) 」
🚀Level 2: Advanced Candlestick Usage – Context is KING!
Recognizing patterns is just step one. Using them effectively is the real skill!
A. Location, Location, Location!
- The power of a candlestick pattern depends HEAVILY on WHERE it appears on the chart!
- High Probability Locations:
- At Key Support Levels: Look for Bullish Reversal patterns (Hammer, Bullish Engulfing, Morning Star).
- At Key Resistance Levels: Look for Bearish Reversal patterns (Shooting Star, Bearish Engulfing, Evening Star).
- At Moving Averages: Finding support/resistance at a key MA accompanied by a corresponding reversal pattern.
- At Trendlines: Touching an ascending/descending trendline and forming a corresponding reversal pattern.
- At Fibo Retracement Levels: Appearing at key Fibo levels (especially 38.2-61.8%).
- Low Probability Locations: If a pattern appears in the “middle of nowhere” on the chart, without any other technical level supporting it, its reliability drops significantly.
B. Confirmation is Mandatory!
- NEVER trade a pattern the instant you see it! Candlestick patterns are signals, not guarantees.
- How to Confirm?
- Wait for the Next Candle: For a bullish pattern, wait for the next candle to close bullish, ideally breaking the high of the pattern. For a bearish pattern, wait for the next candle to close bearish, ideally breaking the low of the pattern.
- Combine with Other Indicators: Example: See a Bullish Engulfing while RSI is moving up from oversold, or MACD has a bullish crossover? Stronger signal.
- Volume Confirmation: Reversal patterns accompanied by an increase in volume are generally more reliable.
C. Trend Context Matters!
- With the Trend > Against the Trend:
- In a clear uptrend, bullish reversal patterns appearing on pullbacks to support are generally higher probability trades (you’re trading with the main flow).
- In a clear downtrend, bearish reversal patterns appearing on rallies to resistance are generally higher probability.
- Using reversal patterns to catch counter-trend tops or bottoms is much riskier and requires significantly more confirmation.
D. Timeframe Significance:
- Like Pivot Points, the significance of a candlestick pattern is proportional to the timeframe!
- M1, M5 patterns: Likely just intraday noise, may fail quickly.
- H1, H4 patterns: Start having relevance, can influence price for several hours to days.
- D1 (Daily) patterns: Very important! Daily reversal patterns like Engulfing or Morning/Evening Stars often signal intermediate-term trend changes and are closely watched by Swing Traders.
- W1 (Weekly), MN (Monthly) patterns: Carry immense weight! Weekly/Monthly patterns can influence price for months or even years and are critical for long-term investors.
E. “Parameters” & “Best Combos”? – The Candlestick Reality!
- Candlestick Patterns Themselves Have NO Parameters! A Hammer is a Hammer; its definition is the pattern itself, unlike RSI(14) which has a ’14’ you can adjust.
- The “Parameters” are Really:
- Strictness of Pattern Definition: How long must a Hammer’s wick be relative to its body? Longer wicks/smaller bodies usually mean stronger signals. This is a “quality” parameter.
- The Timeframe You Analyze: H1 or D1? This is the biggest “parameter” affecting signal significance.
- Your Confirmation Rules & Other Tools: How do you define confirmation? What S/R levels do you use? These are parameters of your trading system.
- Which Patterns Are “Hottest” or Most Effective?
- No definitive answer, but generally:
- Multi-candle patterns are often more reliable than single-candle patterns: E.g., Morning/Evening Stars, Engulfing patterns are typically stronger than standalone Hammers/Shooting Stars.
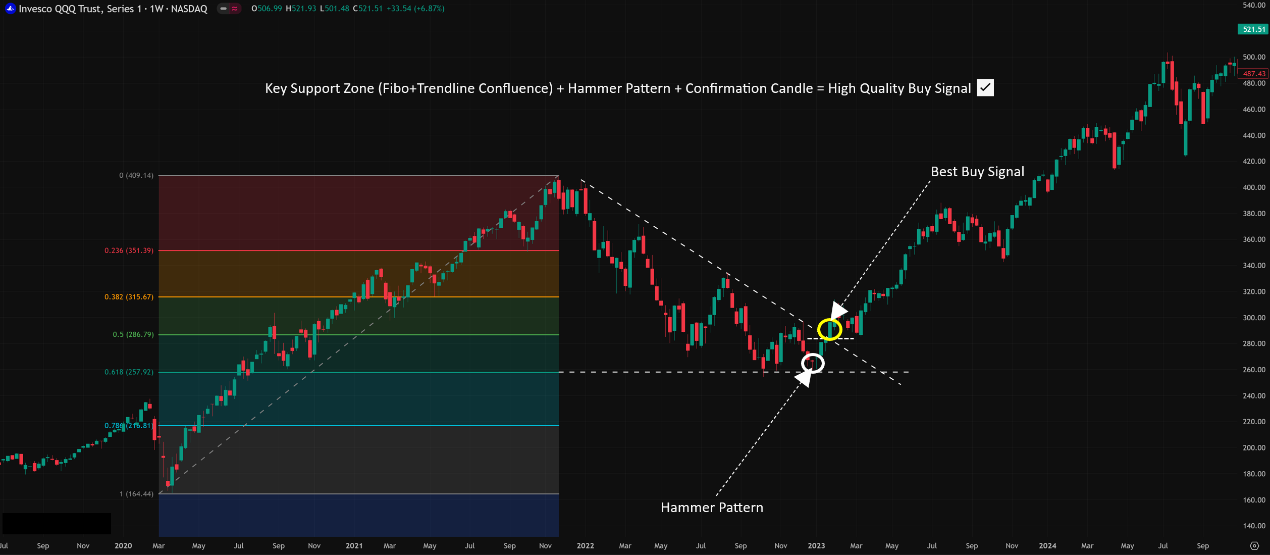
- Patterns appearing at key locations + receiving confirmation are the MOST effective! A Bullish Engulfing at strong support, confirmed by the next candle breaking its high, is a high-quality signal.
- The “hottest” setup isn’t a single pattern, but a combination strategy: “Pattern + Location + Confirmation + Risk Management”!
- No definitive answer, but generally:
- Example High-Probability Combo:
- [Key Confluence S/R Zone] + [Classic Reversal Candlestick Pattern] + [Next Candle Confirmation] + [Other Indicator Support (e.g., RSI/MACD)]
- Stop Loss Placement: Usually placed just below the low of a bullish pattern or just above the high of a bearish pattern.
👇「Candlestick Pattern + Confluence Confirmation」
The Bottom Line: Candlestick Patterns – The Universal Language of Market Sentiment
Candlestick charts and their patterns are the absolute foundation and core of technical analysis. They aren’t complex math formulas; they are the visual representation of price action and the balance of power between bulls and bears over a specific time period.
Learning candlestick patterns helps you:
- Instantly read market sentiment: Are buyers or sellers in control? Indecision or conviction?
- Identify potential turning points: Through classic reversal patterns.
- Find high-probability trading opportunities: By placing patterns in the right Location and Context.
- Provide reference points for entries and stops.
- Combine with other analysis tools for validation.
For all young traders wanting to master the financial markets (especially volatile crypto!), mastering the interpretation and application of candlestick patterns is a fundamental skill you MUST have! They are how the market “talks” to you!
Remember:
- Candlesticks themselves have no parameters; focus on pattern definition.
- Context is King! Location, trend background, and confirmation are crucial.
- Never use them in isolation! Always combine with other analysis.
- Higher timeframe patterns carry more weight.
- You don’t need to memorize hundreds; master the dozen or so most classic and common patterns.
- Practice, practice, practice! The more charts you look at, the better your “feel” will become!
Alright! Hope this deep dive into candlestick patterns helps you unlock their power! Start spotting these “codes” on your charts and try reading the market’s “facial expressions”! See ya next time! Read the charts, not the news!😉📊