The speculator’s chief enemies are always boring from within. It is inseparable from human nature to hope and to fear
William Delbert Gann – 1949
As a prominent public blockchain project, Cardano (ADA) has consistently captured the market’s attention. Recently, with the broader cryptocurrency market undergoing a general pullback, discussions about ADA’s future trajectory have intensified. While news headlines are filled with reports of market volatility, the real trend story is often hidden within the structure of the price charts. This article will deeply analyze ADA’s technical performance across different timeframes, aiming to distinguish short-term market noise from long-term structural trends.
Analysis Benchmark Statement All subsequent technical analysis is based on a price snapshot locked in on September 24, 2025, 14:19 (UTC+8): ADA = 0.8137 USD. This price snapshot provides a stable reference point for the analysis. All support, resistance, and projected paths are relative to this benchmark. Market prices are highly volatile; readers should treat this report as an “analytical map,” not a real-time price feed.
Catalysts and Fundamental View (The Rear-view Mirror) Over the past 24 hours, market news has primarily focused on macro-level selling pressure, with over $150 billion in market capitalization wiped out, triggering a cascade of liquidations. Against this backdrop, ADA’s price has suffered in line with the broader market. However, it is crucial to note the absence of any significant negative news specific to Cardano. On the contrary, a report about WisdomTree including ADA in its new index fund adds a positive note for its long-term development. This suggests that the current price decline is more likely attributable to general market panic rather than a deterioration of the project’s fundamentals.
The Predictive Lens: A Multi-Timeframe Technical Deep Dive
Multi-Timeframe Technical Deep Dive (The Predictive Lens) This is the core section. Our analysis is strictly based on the user-provided charts:
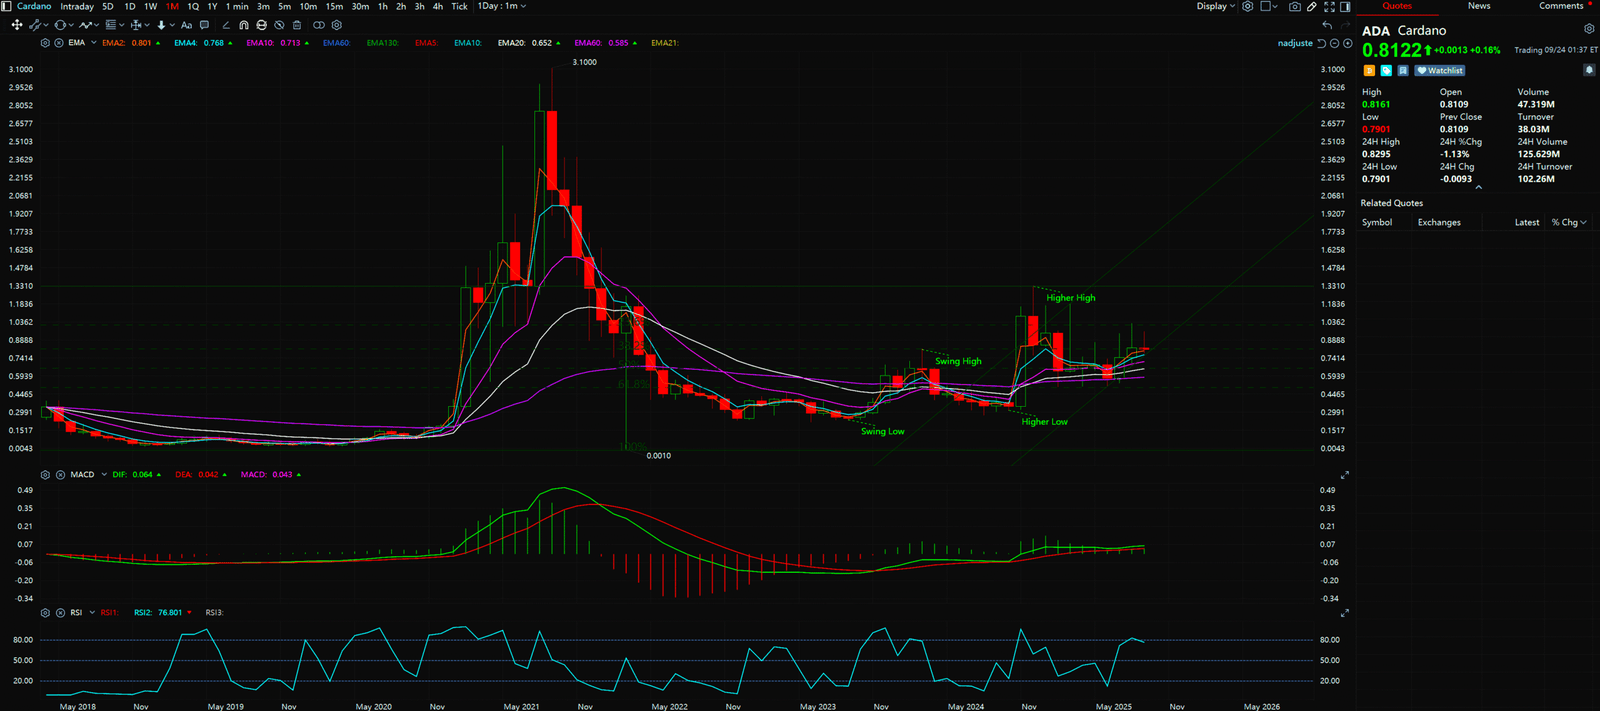
- Monthly Chart (Long-Term Perspective): The monthly chart clearly displays a textbook uptrend structure. The price has formed a distinct series of Higher Highs, climbing from a previous high of around $0.81 to a more recent high of approximately $1.32, and concurrently establishing Higher Lows, rising from a swing low of about $0.23 to a higher low of $0.31. The MACD indicator below the chart provides strong confirmation: both the MACD line and the signal line are firmly above the zero axis, with the MACD line (green) above the signal line (red), a classic signal of a strong bull market.
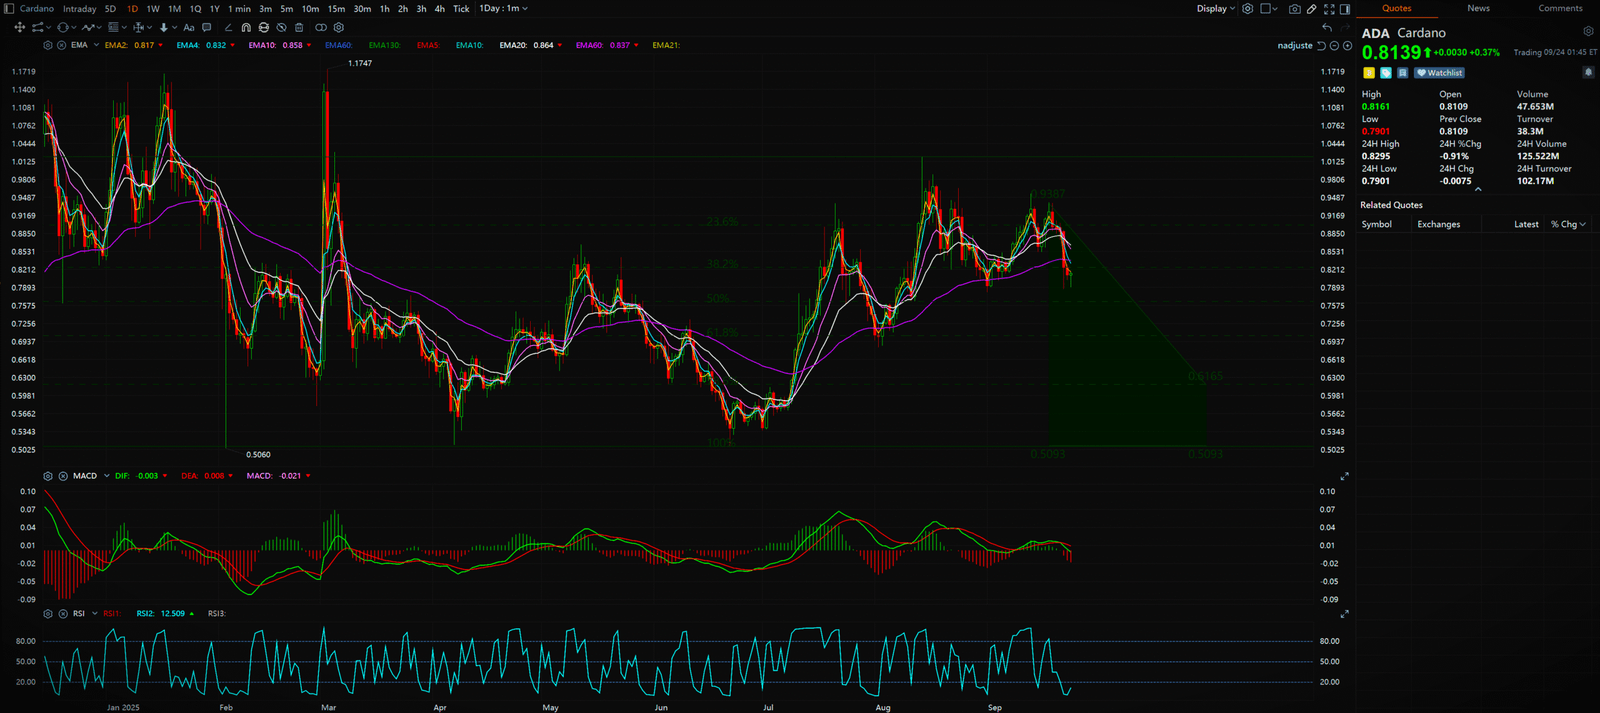
- Daily Chart (Short-Term Perspective): Switching to the daily chart, however, tells a completely different story. The price is in a clear downtrend, forming a sequence of Lower Highs (from ~$0.95 to $0.93) and Lower Lows (from ~$0.85 to $0.78). This structure indicates that the short-term market is dominated by sellers. Each rally has failed to break the previous high and subsequently fell below the previous low, confirming the continuation of the downtrend.
Synthesis and The Professional’s Viewpoint
The “trend divergence” between the monthly and daily charts is the key takeaway of this analysis. The strong uptrend on the monthly chart represents the strategic positioning of long-term investors and “smart money,” who are bullish on ADA’s long-term value. The downtrend on the daily chart, meanwhile, reflects the risk-off behavior of short-term traders amid macro market fear.
The conclusion is clear: a short-term correction within a long-term bull market. The decline on the daily chart should be viewed as a corrective or consolidation phase within the larger uptrend shown on the monthly chart. For long-term investors, this could present a potential opportunity to accumulate. For short-term traders, caution is warranted as the downward momentum could persist. The $0.6165 to $0.5093 range is indeed a critical potential support zone. This area corresponds to previous structural lows and a high-volume node. If the price pulls back to this zone and shows signs of stabilization, it could signal the end of the short-term decline and a resumption of the long-term uptrend.


Key Takeaways
Summary / Key Price Levels:
- Core View: Long-term bullish, short-term bearish. Currently in a daily-level correction within a monthly-level bull market.
- Key Resistance: $0.95 USD (origin of the recent daily downtrend), $1.10 USD (previous rally high).
- Key Support: $0.78 USD (recent daily low), $0.6165 – $0.5093 USD (key mid-term structural support zone).
For continuous, real-time analysis of these developing market structures, visit www.chart-blitz.com.
Fundamental news tells you what happened. Technical analysis predicts what will happen. To master the professional framework that separates market signal from noise, explore our exclusive models at www.chart-blitz.com.
Sources:
- https://www.fxstreet.com/cryptocurrencies/news/crypto-liquidations-hit-18b-in-a-day-final-flush-or-more-to-come-202509230706
- https://insidebitcoins.com/news/wisdomtree-registers-crypto-index-fund-tracking-top-20-tokens-including-xrp-solana-bitcoin
- https://cryptonews.com/news/crypto-price-prediction-today-23-september-xrp-solana-cardano/
- https://www.moneycontrol.com/news/business/markets/cryptocurrency-bitcoin-ethereum-xrp-solana-tron-doge-price-today-live-updates-24-09-2025-alpha-liveblog-13572149.html
Unlocking Technical Analysis: Power Moves with Diagrams !
Monthly Timeframe for Cardano (ADA)
Daily Timeframe for Cardano (ADA)