The speculator’s chief enemies are always boring from within. It is inseparable from human nature to hope and to fear
William Delbert Gann – 1949
Yesterday, something big happened in the crypto world. An Ethereum (ETH) address that had been dormant since 2017—like a whale sleeping for 8 years on the ocean floor—suddenly woke up and moved over $6 million worth of ETH. The market is now buzzing with speculation.
Moves from these “prehistoric whales” are often seen as mysterious omens. Do they know something we don’t, preparing to sell at the top? Or is this just a portfolio shuffle, or perhaps even a signal that they’re getting ready for the next massive bull run?
Instead of Guessing the Whale’s Mind, Watch the Chart’s “Lifeline” As retail investors, it’s impossible to know a whale’s true intentions. But the good news is, you don’t have to. All market sentiment, fear, and greed are ultimately reflected in the price chart. Instead of guessing, it’s better to learn how to read the one key level in the market’s script.
Analysis Benchmark Statement
- All technical analysis below is based on a price snapshot locked in on Oct 29, 2025, 17:31 (UTC+8): ETH = $4,015 USD.
- This price snapshot provides a stable reference point for analysis. All support, resistance, and projected paths are relative to this benchmark. Market prices are volatile; please treat this report as an “analytical map,” not a real-time quote.
Forget Complex Indicators, You Only Need One Line
Do you get a headache looking at all the red and green lines on a trading chart? To understand Ethereum’s current trend, you only need to draw one line on your chart: US$3,854.
This is the short-term “lifeline” for Ethereum.
Why is this price so important? In technical analysis, there’s a fundamental but incredibly useful concept called “support/resistance flip.” Think of US$3,854 as a former “ceiling” that ETH struggled to break through in early August. According to the principle, once a price breaks through a ceiling, that ceiling often turns into a very solid “floor.”
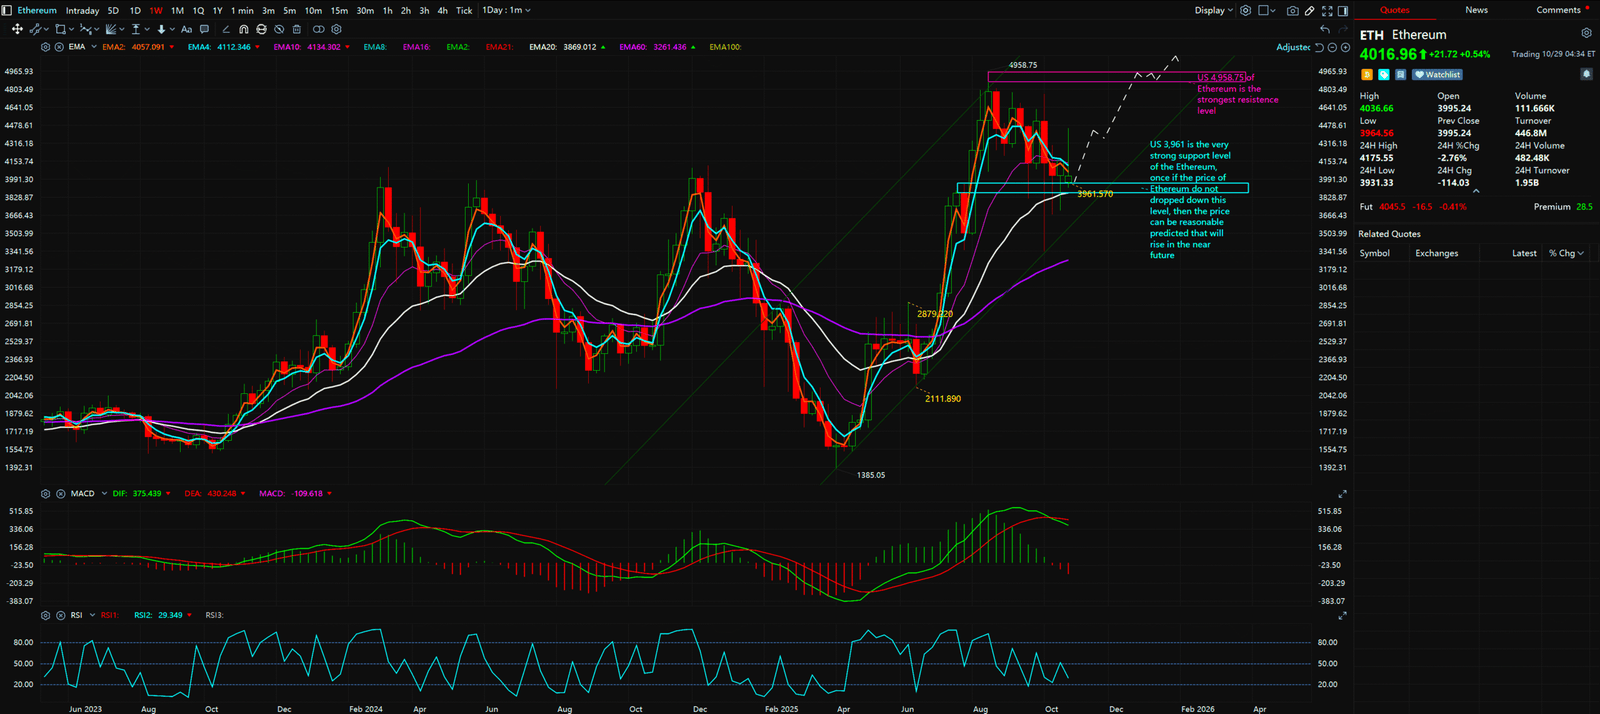
As seen in the weekly chart of the Ethereum, when ETH’s price pulled back from its highs, it found support precisely on this “floor” before bouncing back. This is a powerful technical signal telling us that buyers in the market find this price attractive and are willing to step in.
Only Two Scripts: Hold the Floor, Challenge the Final Boss
Now that we’ve identified the “floor,” the next logical target is the “ceiling.” Currently, the most significant psychological and resistance level for Ethereum is its all-time high: US$4,958. This is the “final boss level” we need to challenge.
So, the script for the near future is actually quite simple:
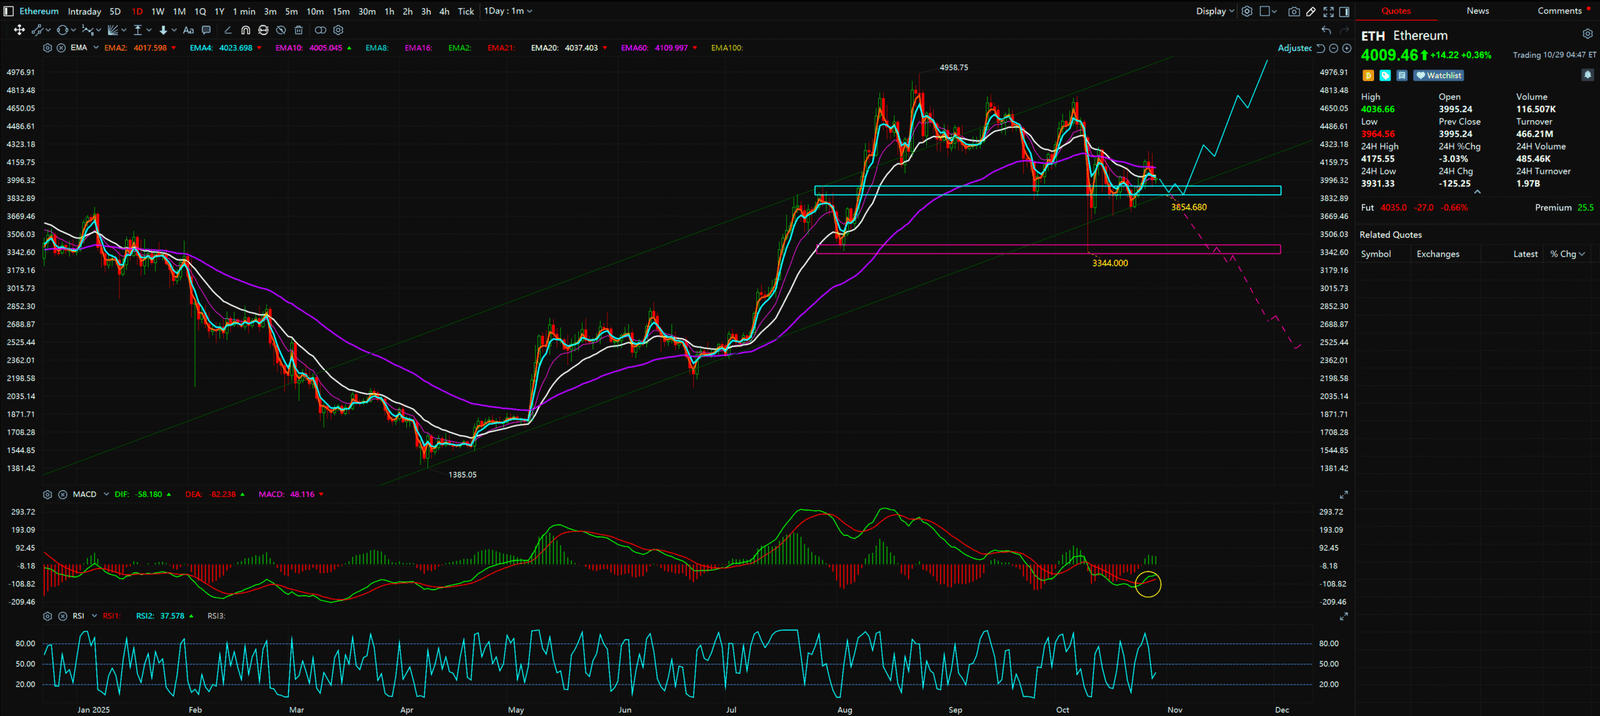
- Scenario A (Bullish): As long as the ETH price remains above the $3,854 lifeline—even with some sideways movement or minor pullbacks (like the weakening momentum shown on the daily chart)—it can be seen as a consolidation phase to gather energy. Looking at the bigger picture on the weekly chart, the overall “macro trend” remains healthy and upwards. When market sentiment aligns, the next logical target will be to challenge, and possibly break, the ultimate ceiling at $4,958.
- Scenario B (Bearish): If, due to some negative news, the ETH price breaks below this critical $3,854 “floor,” it would be a major warning sign. This would indicate that sellers are regaining control, and the uptrend might be temporarily over. At that point, strict risk management, including considering a stop-loss, would be essential.
Synthesized Analysis & Unique Insight : Keep It Simple, Stay Patient
The market is filled with endless news and noise every day. This whale’s unusual move has given us a perfect opportunity to re-examine Ethereum’s core price levels. You don’t need to be a technical analysis expert. You just need to remember the $3,854 lifeline. If it holds, be patient and let the market play out its script. If it breaks, be decisive and protect your capital.


Key Takeaways
Summary / Key Price Levels:
The crypto market is full of opportunities, but also significant risks. Instead of chasing vague “insider tips,” it’s better to learn one or two key signals. Now you know ETH’s “Ultimate Ceiling” (US 4,958) and its “Lifeline” (US 3,854). The next step is to wait for the market to give a clear signal.
- Key Level to Watch (Defense): Is the price holding strong above the US 3,854 “Lifeline“?
- Liftoff Signal (Offense): Wait for a decisive breakout and hold above the US 4,958 “Ultimate Ceiling“
For continuous, real-time analysis of these developing market structures, visit www.chart-blitz.com.
Fundamental news tells you what happened. Technical analysis predicts what will happen. To master the professional framework that separates market signal from noise, explore our exclusive models at www.chart-blitz.com.
Sources:
- https://www.coindesk.com/markets/2025/10/29/ether-holds-above-usd4-000-arkham-says-tom-lee-s-bitmine-is-buying-the-dip
- https://www.coinspeaker.com/ethereum-bounce-4k-next/
- https://decrypt.co/346448/bitcoin-ethereum-traders-fed-rate-decision
Unlocking Technical Analysis: Power Moves with Diagrams !
Weekly Timeframe for ETH (Ethereum)
Daily Timeframe for ETH (Ethereum)