The big money is not in the individual fluctuations, but in the main movements. That is, not in reading the tape but in sizing up the entire market and its trend.
Jesse Livermore – 1923
Here we go again. Yesterday, several “authoritative” investment banks upgraded their forecasts for the semiconductor industry, citing “stronger-than-expected” demand for AI chips and an “impending supercycle” in the memory market. 🤯 Instantly, financial news apps lit up with push notifications, all screaming headlines like “Semiconductor Stocks on the Move! Top Analyst Picks!” Retail investor forums erupted in a chorus of excitement, with everyone suddenly acting like seasoned experts, debating which company has the most “reasonable” P/E ratio or the most “promising” technology. It’s laughable, and frankly, pathetic. While you’re getting hyped up over this meticulously crafted “Official Story” from Wall Street, the real players—the “Navigators”—have already read the next chapter of the script on the charts. This news? It’s nothing more than the last handful of breadcrumbs scattered for the sheep before the shearing begins. 😴
The “Official Story”: A Fundamentalist’s Paradise
Alright, let’s put on the “fundamental investor” hat for a moment and perform the perfunctory ritual of analyzing why Lam Research (LRCX) and its playground, the semiconductor equipment industry, are supposedly such a “compelling” investment.
The Macro Narrative: The “Can’t-Lose” Gold Rush
According to the standard playbook, semiconductors are the “new oil,” and equipment makers like Lam Research are the ones “selling the drills and shovels.” The argument is seductive: no matter which country or company wins the race in AI, electric vehicles, 5G, or cloud computing, they all need chips. And to produce those chips, they must buy equipment from Lam Research, Applied Materials (AMAT), ASML, and their peers. The “Official Story” tells you that investing in LRCX isn’t a bet on a single company; it’s a bet on the future of human technology. Market research firms project the global semiconductor equipment market to surpass $200 billion by 2030, growing at a “robust” CAGR of over 9%. Sounds like a sure thing, doesn’t it? Just buy and hold, and let the good times roll. 🤦
The Three Titans: A Battle of Gods, A Trap for Mortals
In this oligarchic market, each major player has its officially assigned role:
- 👑 The Leader – ASML Holding (ASML):
- Core Advantage: Monopoly. One word says it all. ASML is the world’s only producer of extreme ultraviolet (EUV) lithography machines. Without EUV, there are no advanced-process chips below 7nm. Giants like TSMC, Samsung, and Intel all have to queue up, cap in hand, to buy from ASML. It isn’t competing; it’s setting the rules of the game. Its 50%+ gross margins are a testament to this unassailable position.
- Achilles’ Heel: Geopolitical Risk. ASML’s technology is no longer just a product; it’s a pawn in the great game of global politics. US-led chip sanctions against China directly impact ASML’s addressable market and growth trajectory. A single diplomatic fallout could shatter its growth narrative overnight. Its very success makes it a target for every nation striving for technological sovereignty.
- 🐘 The Incumbent – Applied Materials (AMAT):
- Core Advantage: Diversification. AMAT is the supermarket of the semiconductor equipment world. From deposition and etch to chemical mechanical planarization (CMP) and ion implantation, it does almost everything. This broad portfolio provides a one-stop-shop appeal for customers and insulates it from the cyclical risks of any single technology. Its decades-old global service network and customer relationships form a deep, formidable moat.
- Achilles’ Heel: Innovator’s Dilemma. Because it does everything, it faces hyper-focused competitors like Lam Research in every single segment. AMAT must pour colossal R&D funds into maintaining leadership across a dozen fronts. A moment’s distraction could see it being leapfrogged in a critical technology. It’s a classic case of being a jack of all trades, but a master of none.
- ⚔️ The Challenger – Lam Research (LRCX):
- Core Advantage: Specialization. Unlike AMAT’s sprawling empire, Lam Research focuses its entire war chest on two of the most critical steps in chipmaking: etch and thin-film deposition. In etch, particularly, LRCX is the undisputed global champion. As chip architecture transitions from planar to 3D (e.g., 3D NAND Flash, GAA transistors), the requirements for precision and aspect ratio in etching have grown exponentially. This is Lam’s turf. Its Kiyo® and VECTOR® product lines are veritable money-printing machines.
Achilles’ Heel: Customer Concentration. LRCX derives a huge portion of its revenue from a handful of major memory manufacturers like Samsung, Micron, and SK Hynix. This means that when the memory market enters a downturn or a key customer slashes capital expenditures, Lam’s earnings take a disproportionately massive hit. Its fate is inextricably tied to the volatile boom-and-bust cycle of the memory industry.
The Critical Twist: The Chart is the Only Truth
Okay, we’ve laid it all out. Compelling, right? You feel like you’ve got a handle on the industry’s very soul.
But does any of this actually matter?
All this talk of “macro trends,” “economic moats,” and “Achilles’ heels” is based on past data and public information. It’s a beautifully polished “rear-view mirror.” It gives you a crystal-clear view of the wall you just crashed into, but it tells you absolutely nothing about the hairpin turn just ahead. Wall Street analysts are master craftsmen who specialize in decorating these rear-view mirrors. They write 10,000-word reports and build complex financial models for one purpose only: to create a plausible explanation for a price move that has already happened.
Consider this “thought experiment”: On Monday, the news breaks that a key LRCX customer is slashing capital spending due to high inventory. The fundamentalists see this, panic, and sell. The stock tanks 8%. On Wednesday, LRCX stock suddenly sees massive volume at the lows and stages a V-shaped reversal, closing up 6%. It’s not until Friday that “market chatter” emerges about a massive long-term procurement deal signed between LRCX and a sovereign wealth fund betting on AI infrastructure. See the pattern? The news (the breadcrumbs) is always the last to arrive. By the time the bad news is out, the bottom might already be in. By the time the good news is announced, the smart money might be using the ensuing rally to sell their positions. In this chaos, only one thing tells the truth: the chart. That long-tailed candle on Wednesday, printed on enormous volume, was the “footprint” of capital. It told you, in the most honest language possible, that big money was stepping in. That signal was two days ahead of the news and a million times more accurate than any analyst report.
The Brutal Truth on the Charts: The Script for LRCX
Forget the earnings reports. Forget the analysts. Now, we open the only map of truth—the chart—to dissect the price action of LRCX over the last 18 months. You are about to see a meticulously executed script of accumulation, markup, and distribution.
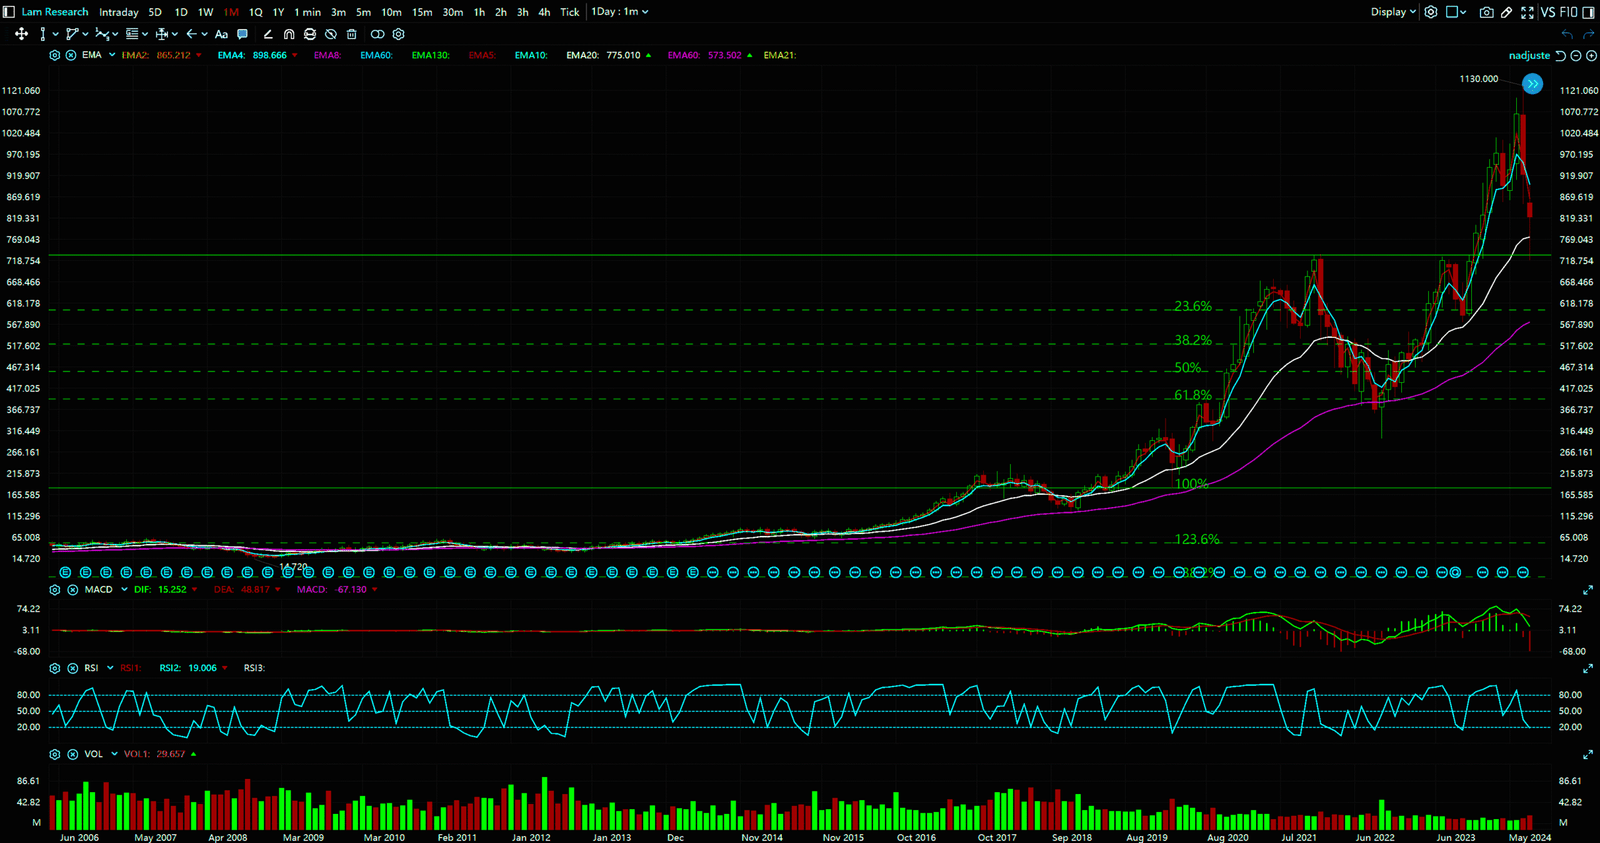
Act I: The Macro Script (Monthly Chart) – Establishing the Long-Term Trajectory
First, pull up the monthly chart. What we see is a long-term ascending trendline (Point A) originating from the 2020 lows and extending to the present. This line is the “lifeline” of LRCX. During the 2022 bear market, even after a gut-wrenching 50%+ correction, the price found its ultimate support right around this trendline before launching its next major bull run. This is not a coincidence. This is the consensus of macro capital—as long as LRCX’s price remains above this line, the long-term script is “up.” Any dip towards this line is interpreted as a “loading opportunity,” not an “apocalypse.” This is the fundamental difference between a Navigator’s macro perspective and a sheep’s, who wets their pants over daily fluctuations.
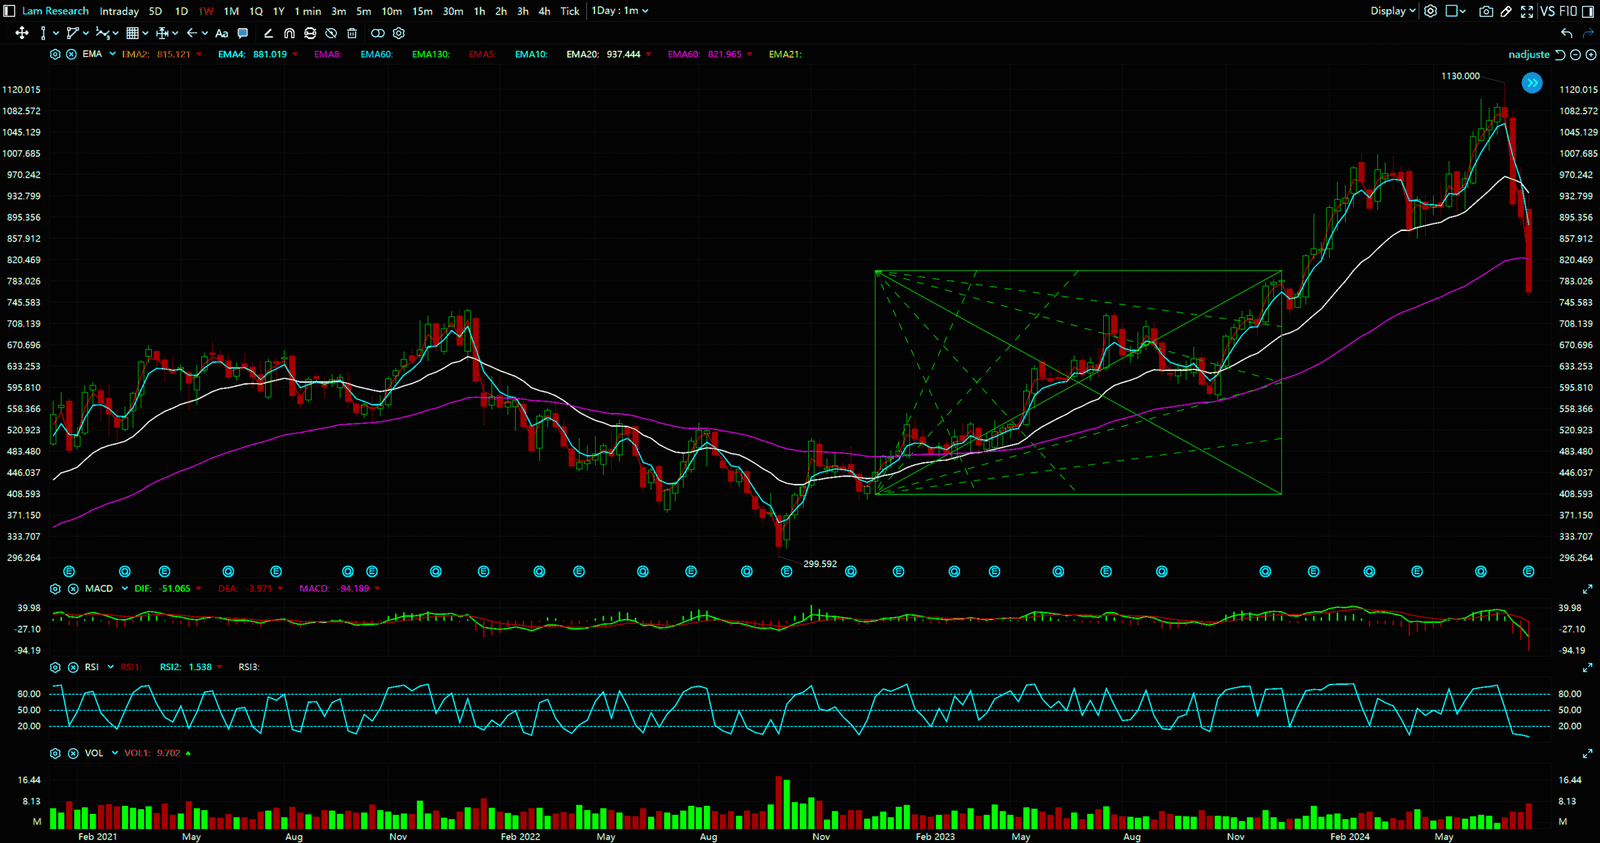
Act II: The Strategic Setup (Weekly Chart) – The Accumulation Zone & Relative Strength
Next, we zoom into the weekly chart, where the plot thickens. Notice that for most of 2023, LRCX’s price was contained within a massive rectangular range (Zone B). A fundamentalist would call this a “holding pattern pending better earnings” due to the memory market slump. In our world, this is a textbook “accumulation range.”
- The Volume Code: Look closely at the volume profile within this range. Volume consistently expanded in the lower half of the range, yet the price refused to break down. What does this signal? It signals a “change of hands.” The sheep were selling out of fear (bad earnings, negative headlines), while the Navigators (institutional capital) were quietly absorbing these panic-sold shares in tranches. Every dip to the bottom of the range was met with increased volume, and the price was swiftly bid back up. These are the “footprints” of capital.
- Relative Strength Comparison: During this same period, let’s compare LRCX to its main competitor, AMAT. You’ll find a fascinating divergence: while both were consolidating, LRCX’s pullbacks were shallower, and its bounces were more powerful. When the sector came under pressure, LRCX was consistently the first to reclaim its 30-week moving average. This tells you that the big money in the market favored LRCX, believing it had greater potential in the next leg up. This is a subtle, yet critical, piece of information that no fundamental analysis will ever provide.
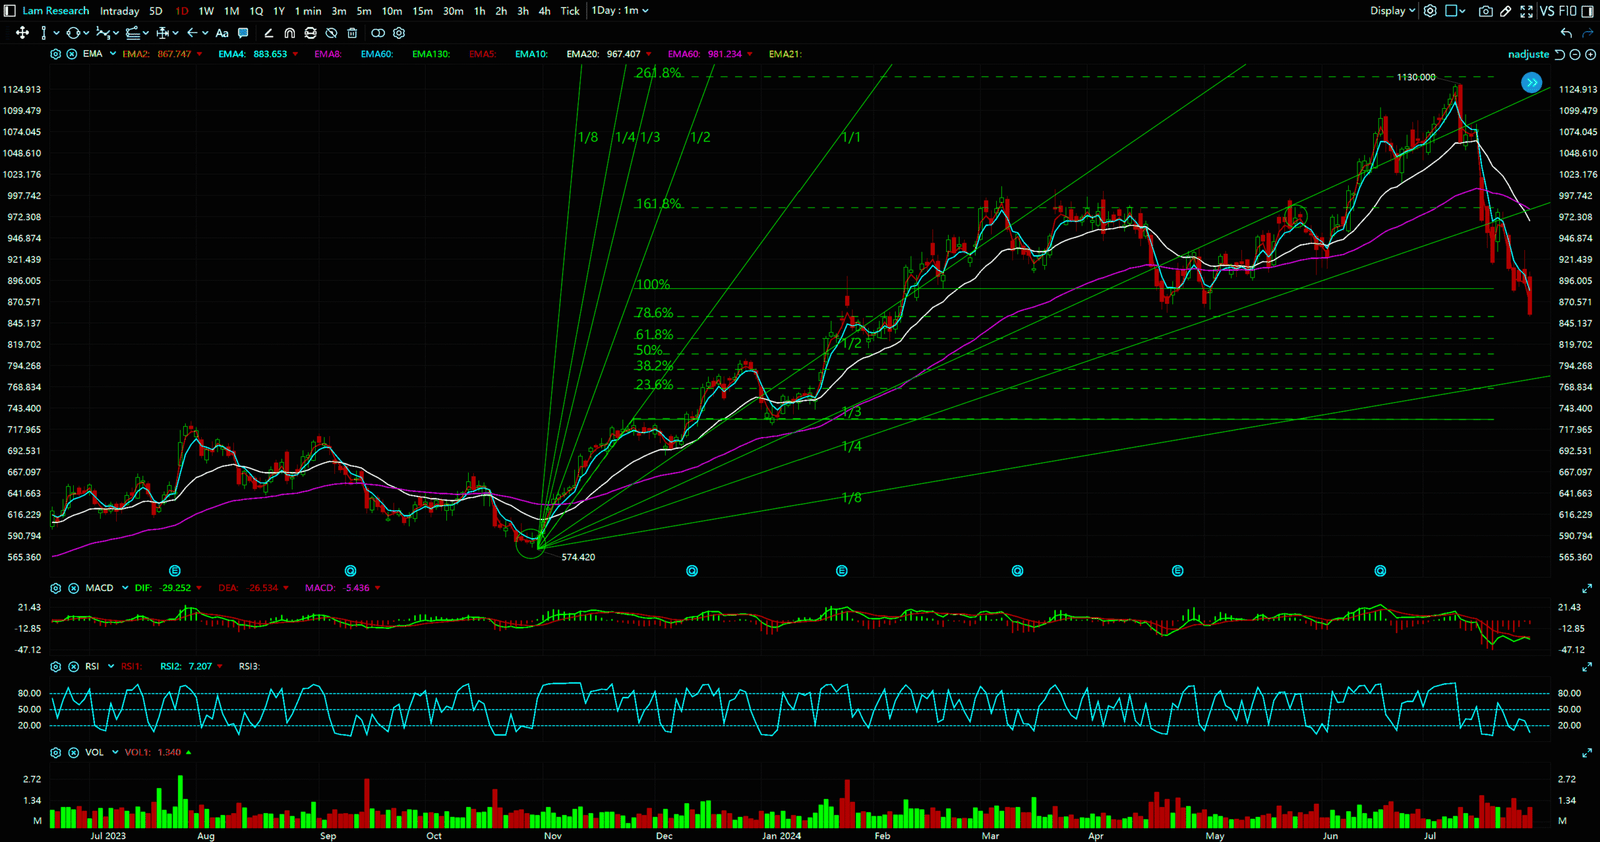
Act III: The Tactical Execution (Daily Chart) – Weaponizing News to Engineer Fear and Greed
The daily chart is the battlefield where capital executes its tactics. We can find countless examples of news being used to fleece the retail crowd.
- The Accumulation Case (October 2023): “Bad news” circulated that memory giants were cutting capital expenditures further. LRCX gapped down, closing with bearish candles for three straight days, breaking a near-term support level. Retail forums were filled with capitulation and “stop-loss” chatter. But look at the fourth day’s candle: a massive hammer with a long lower wick, printed on the highest single-day volume in over three months. The price made a new low intra-day but was aggressively bought up to close near the high. We call this a “shakeout” or the “climax of panic selling.” The sheep handed over their blood-soaked shares at the absolute bottom, and institutional players absorbed it all. The very next day, the stock gapped up and never looked back. Tell me, what’s more important: the news, or the volume and the candlestick?
- The Distribution Case (May 2024): After a multi-month, smooth uptrend, LRCX hit a new all-time high. At this exact moment, every major bank upgraded their price targets, and the media trumpeted stories of how robust AI demand was, creating a euphoric, can’t-lose atmosphere. But look at the chart. After hitting that new high (Point C), the price failed to accelerate. Instead, it printed several consecutive candles with long upper wicks (shooting stars, spinning tops), all while volume remained stubbornly high. This is an extremely dangerous signal. Price is struggling to advance, yet turnover is huge. What does that mean? It means a massive supply of shares is being dumped onto the market at these elevated levels. The Navigators who accumulated shares down below are now methodically distributing them to the greedy sheep, who are chasing the headlines and the upgraded price targets. This is “churn,” and it’s a classic precursor to a significant pullback.
The Future Script: Key Battleground Levels
Synthesizing this analysis, the script for LRCX is crystal clear. The long-term uptrend remains intact, but the stock has entered a short-term distribution or high-level consolidation phase. The next critical moves will revolve around the following price zones:
- Core Support Zone (Zone D): This is the top of the prior high-volume consolidation range. This level is the line in the sand. If the price corrects down to this zone and finds support—ideally on shrinking volume, followed by a high-volume reversal candle—it would signal a healthy pullback, potentially the start of a new accumulation phase.
- Overhead Resistance (Point C): The all-time high. For the price to challenge this level again, it must do so on significantly higher volume than the previous attempt. A breakout on weak or declining volume would be a massive red flag for a “bull trap,” designed to lure in the last of the FOMO buyers before the real drop.
The Navigator’s strategy is simple: we watch for the “footprints” of capital re-entering at the core support zone. We watch for the “churn” of distribution at the overhead resistance. We don’t guess tops or bottoms. We simply follow the real-time flow of money. This method of analysis is the only map that matters. Everything else is just noise.


Conclusion: Stop Being the Sheep. Learn to Read the Map.
After seeing the footprints of capital, do you still care about the next earnings forecast? Do you still listen to an analyst’s “price target”?
This market has never been a level playing field. It’s a zero-sum game, with the map-reading “Navigators” on one side and the news-reading “sheep” on the other. While the sheep are busy debating which patch of grass (fundamentals) looks greener, the Navigators have already used their map (the chart) to locate the next water source. The “Official Story” from Wall Street is the opium designed to keep you docile and content, ready for the shearing.
Wake up. Stop being a passive recipient of information. Your financial destiny should not be dictated by a press release, an earnings report, or a so-called “expert” analyst. True power comes from your ability to read the market for yourself. Want to learn the “real rules of the game”?
Want to evolve from a sheep, destined for slaughter, into a Navigator who controls their own destiny? Visit our website now and learn to read the only source of truth in the market—the chart. It is the only survival skill you will ever need in the brutal arena of finance.
Sources:
- Market Research Future (MRFR)
- Gartner, Inc.
- Company 10-K Filings (SEC)
Unlocking Technical Analysis: Power Moves with Diagrams
Monthly Timeframe (Lam Research)
Weekly Timeframe (Lam Research)
Daily Timeframe (Lam Research)