When you make a trade, you should have a clear target of where you expect to get out
William Delbert Gann – 1949
💥 Over the past 24 hours, BNB’s news cycle has been nothing short of turbulent. On the surface, the market is being pulled by three distinctly different forces simultaneously, leaving retail investors completely disoriented.
The First Force: The Binance Delisting Storm. Binance announced that it will delist eight cryptocurrencies effective April 1, 2026, including A2Z, FORTH, HOOK, IDEX, LRC, NTRN, RDNT, and SXP. This news triggered a chain reaction in the market — retail investors began questioning: “Could the next coin to be delisted be the one I’m holding?” Fear spread rapidly, and BNB’s trading volume noticeably increased after the announcement.
The Second Force: BNB Chain’s Impressive Data. At the same time, BNB Chain announced an exciting piece of news: in the RWA (Real World Assets) sector, BNB Chain grew by 33% over the past 30 days, with TVL (Total Value Locked) surpassing $3 billion. This data should have been a strong bullish signal, but the market’s reaction was surprisingly muted.
The Third Force: XRP Overtakes BNB’s Market Cap. What’s even more disheartening for BNB holders is that XRP, in its recent strong rebound, has officially surpassed BNB’s market cap, taking away its “4th largest cryptocurrency” crown. This news dealt a significant psychological blow to BNB holders.
As a former bank trader, seeing these three pieces of news appear simultaneously immediately brings to mind a familiar scenario: this is the classic “market maker releasing smoke signals to match chart trajectory” manipulation tactic. Bearish news creates panic, retail investors sell, and market makers accumulate at low prices. And that “BNB Chain grew 33%” bullish news? That’s the market maker pre-planting the seed for a future pump.
However, news can only tell you “what happened”; charts tell you “what will happen next.” Let’s put down the news, open the charts, and look at the truth.
【Analysis Baseline Statement】
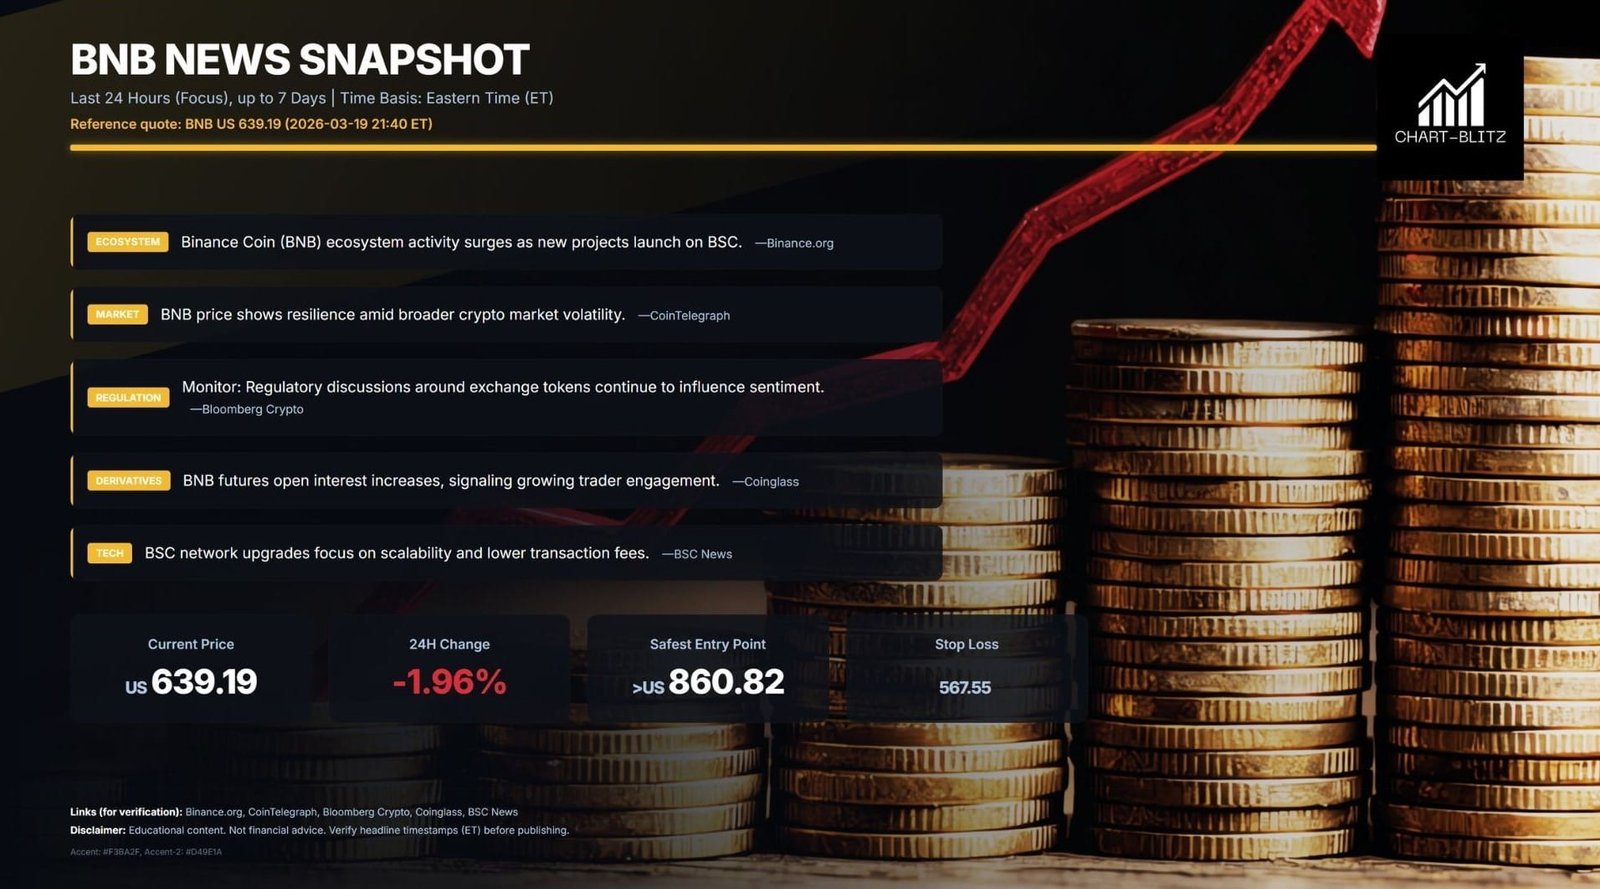
Analysis Baseline Statement: All technical analysis below is based on a locked price snapshot as of March 19, 2026, 09:00 EST: BNB = 639.19 USD. Please treat this report as an “analysis map” rather than real-time quotes.
📊 Technical Indicator Overview: The Foundation for Reading Charts
Before diving into the analysis, we must first understand the core technical indicators used in today’s charts. These indicators are like the “language” of charts — without understanding the language, you cannot truly read what the charts are saying.
Elliott Wave Theory
Elliott Wave Theory, proposed by Ralph Nelson Elliott in the 1930s, holds that market price movements follow a predictable wave pattern. A complete impulse wave consists of 5 sub-waves (1-2-3-4-5), where waves 1, 3, and 5 are impulse waves and waves 2 and 4 are corrective waves. After completing the 5-wave impulse, it is typically followed by a 3-wave correction (A-B-C). The core value of this theory is that it helps traders determine where the current market stands, thereby predicting the next direction.
VPFR (Volume Profile Fixed Range)
VPFR is an indicator that displays the volume distribution within a specific price range. It reveals which price areas have large amounts of accumulated chips (high volume areas) and which areas have almost no chips (low volume areas, i.e., “vacuum zones”). POC (Point of Control, the maximum volume control point) is the most important concept in VPFR, representing the price level with the highest volume within the specified range, typically serving as a strong support or resistance level.
EMA Ribbon (Exponential Moving Average Ribbon)
The EMA Ribbon consists of a set of exponential moving averages of different periods, typically including EMAs of 8, 13, 21, 34, 55, and other periods. When short-term EMAs are above long-term EMAs and the lines fan out, it indicates a strong uptrend; the opposite indicates a downtrend. The arrangement of the EMA Ribbon is one of the most intuitive tools for judging trend strength.
MACD (Moving Average Convergence Divergence)
MACD, developed by Gerald Appel in the 1970s, is one of the most widely used trend-following momentum indicators. It consists of three parts: the MACD line (fast line), the signal line (slow line), and the histogram. When the MACD line crosses above the signal line, it generates a “golden cross” buy signal; the opposite generates a “death cross” sell signal. The height of the MACD histogram represents the strength of momentum; when the histogram gradually shortens, it indicates that trend momentum is weakening.
Fibonacci Retracement
Fibonacci retracement is based on the ratio relationships in the Fibonacci sequence (23.6%, 38.2%, 50%, 61.8%, 78.6%), used to predict potential support or resistance levels during price trends. These ratios have a magical self-fulfilling quality in financial markets — because a large number of traders use these levels, they often truly become market turning points.
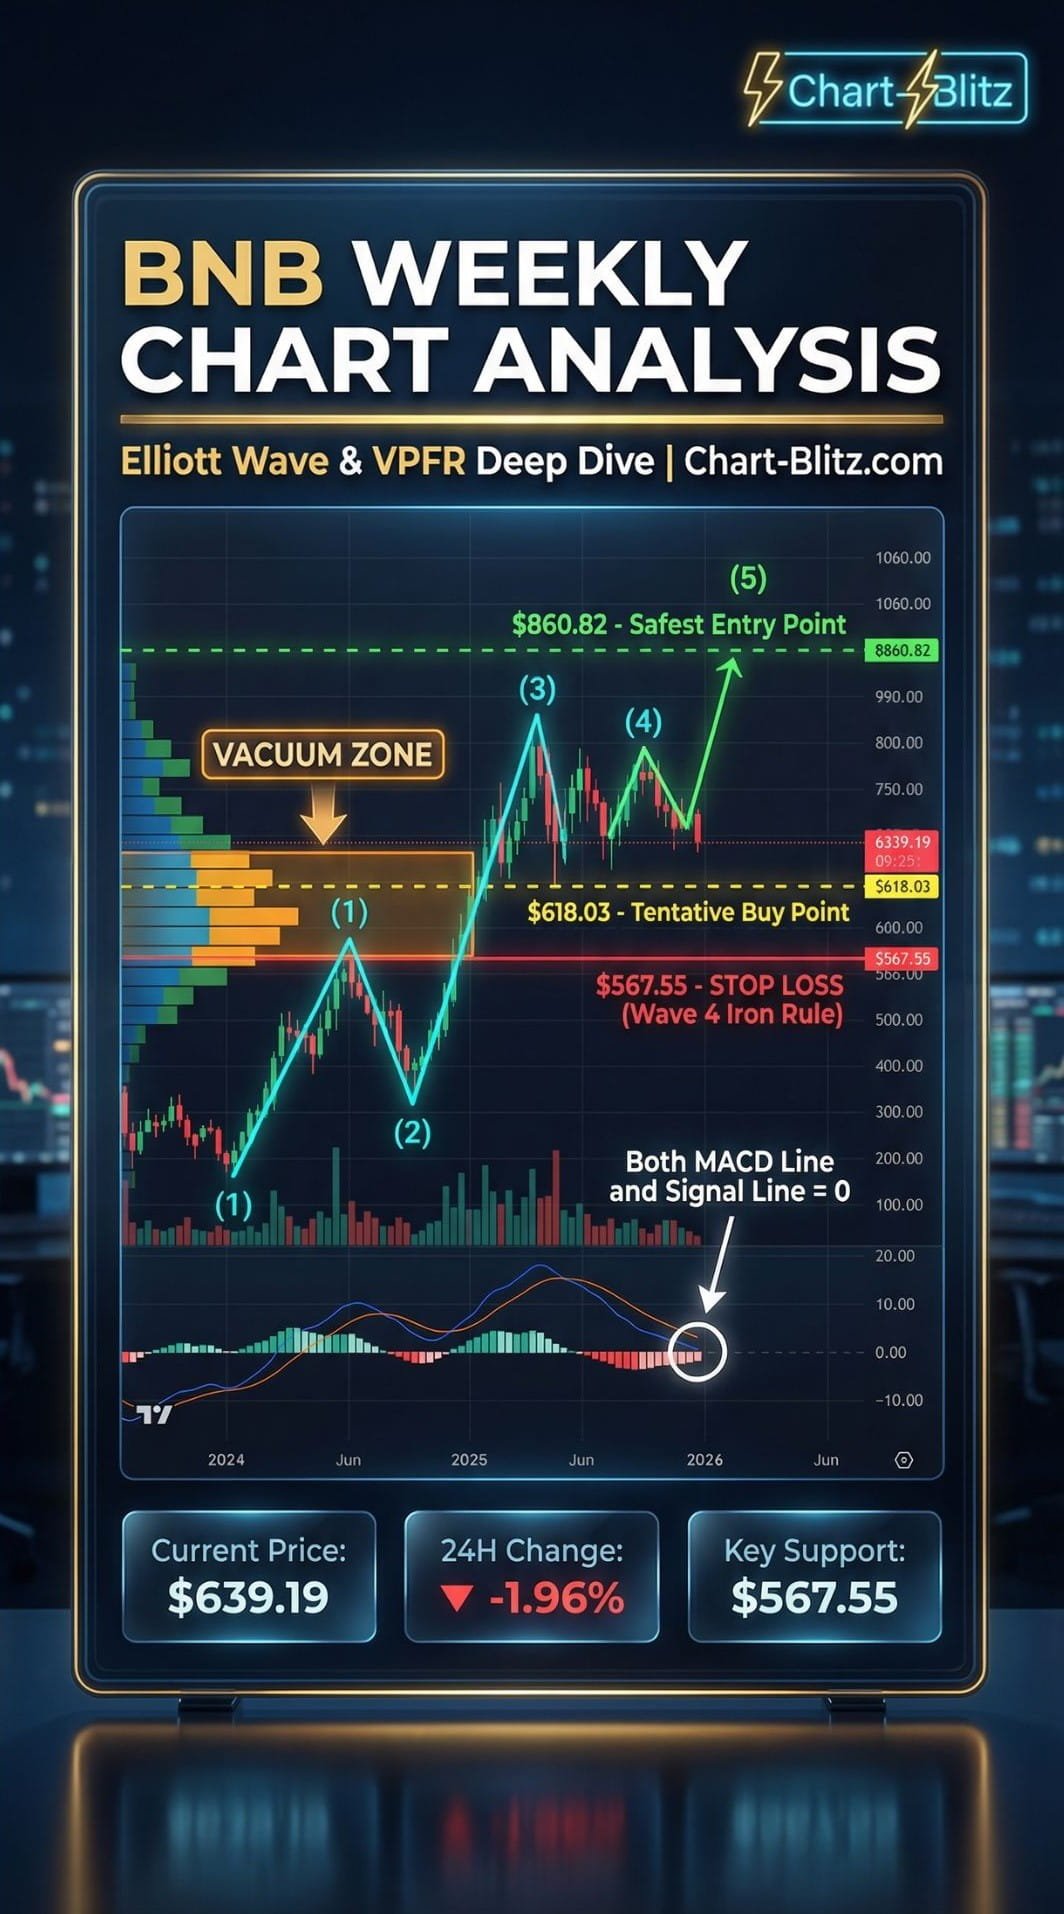
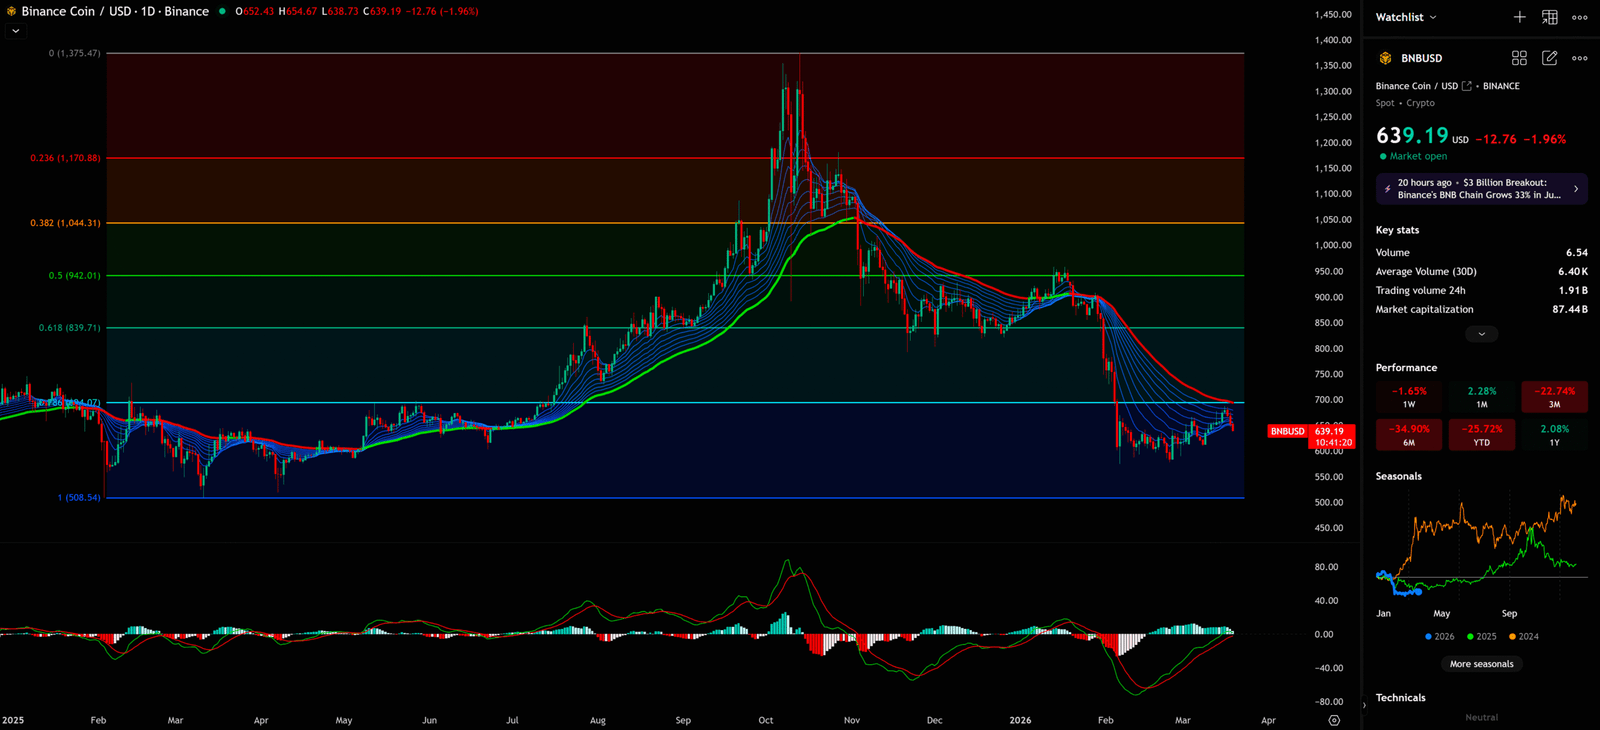
📈 Weekly Chart Deep Dive: Elliott Wave at the Edge of Life and Death
Among all timeframes, the weekly chart is our “North Star.” It filters out short-term market noise and reveals the true flow of funds and the big picture of the market.
1) Wave Count: The Life-and-Death Test of Wave (4)
From the weekly chart, we can clearly observe a potential 1-2-3-4-5 upward impulse wave structure. According to the chart annotations, BNB initiated wave (1) in early 2024, completed wave (2) correction, then completed a spectacular wave (3) in mid-2025 (reaching a high of approximately $1,375), and subsequently entered the wave (4) correction.
Currently, the price is in the process of wave (4) correction, and here there is an iron rule of Elliott Wave theory that must be firmly remembered: The bottom of wave 4 must absolutely not overlap with the top of wave 1. This is one of the most inviolable rules in Elliott Wave theory.
The critical defense line marked on the chart is $567.55. This position is labeled “Stop Loss” and is also the key area of wave 1’s top. If BNB’s price falls below $567.55 and cannot recover, the entire 1-2-3-4-5 upward impulse wave hypothesis will be completely shattered. This means the current decline may just be part of a larger-degree corrective wave (A-B-C), not a wave 4 correction. In this case, the target could point to significantly lower levels.
Before confirming stabilization, strictly forbid easily determining any downward position as the “bottom of wave 4.” This is the most common mistake retail investors make — blindly “bottom-fishing” during a decline, only to find themselves deeper and deeper in losses.
2) VPFR Vacuum Zone: The Market Maker’s Liquidity Trap
Observing the VPFR indicator on the weekly chart, we find an extremely important phenomenon: between $567.55 and $618.03, there exists a relative “Vacuum Zone.” This means that in past trading history, this price range has not accumulated a large amount of chips and volume.
The existence of a vacuum zone has two implications. First, once the price enters this zone, due to the lack of strong support, the price can drop relatively quickly and easily until it encounters the next support area with a large amount of accumulated chips. Second, market makers often exploit such vacuum zones, combined with bearish news (such as the Binance delisting event), to artificially create panic, push the price down to this area, trigger retail stop-loss orders, and thereby acquire a large number of chips at low prices. This is what is known as “creating Exit Liquidity.”
The $618.03 marked on the chart is labeled “The Tentative Buy Point,” which is right at the upper edge of the vacuum zone. The importance of this position is: if BNB can stabilize at this level, combined with increased volume, this may be the signal that market makers have completed their accumulation and are preparing to pump.
3) MACD Zero-Axis Resonance: The Critical Point of Momentum
The MACD indicator at the bottom of the weekly chart shows a very noteworthy phenomenon: there is a prominent circle annotation with the text “Both MACD Line and Signal Line = 0.” This means that both the MACD fast line and slow line have simultaneously returned to near the zero axis.
In technical analysis, MACD returning to the zero axis represents a “reset” of market momentum, a critical inflection point. From this position, the market can develop in two directions: if MACD forms a golden cross near the zero axis and moves upward, it represents the initiation of a new round of upward momentum; if MACD forms a death cross near the zero axis and moves downward, it confirms downward momentum. Currently, this indicator is at the most critical moment of the bull-bear battle
Weekly Timeframe for BNB (Binance Coin)
📉 Daily Chart Analysis: The Dual Pincer Attack of Fibonacci and EMA Ribbon
The daily chart further confirms the weekly chart’s concerns and provides more precise support and resistance levels.
1) Key Fibonacci Retracement Levels
From the daily chart, we can see clear Fibonacci retracement levels, drawn from BNB’s historical high of $1,375.47 to the low of $508.54:
| Fibonacci Level | Price | Significance |
| 0% (Top) | $1,375.47 | Historical High |
| 23.6% | $1,170.88 | First Resistance |
| 38.2% | $1,044.31 | Second Resistance |
| 50% | $942.01 | Mid-level Resistance |
| 61.8% | $839.71 | Golden Ratio Resistance |
| 100% (Bottom) | $508.54 | Key Long-term Support |
BNB’s current price of $639.19 is in the area between the 61.8% retracement level ($839.71) and the 100% bottom ($508.54). The technical significance of this position is: the 61.8% golden ratio level is a strong resistance, and the 100% bottom is the last line of defense. If BNB cannot break through the 61.8% resistance, the next target may be $508.54.
2) The Bearish Arrangement of EMA Ribbon
The EMA Ribbon on the daily chart shows that short-term EMAs are fully below long-term EMAs, and the EMA lines exhibit a typical “bearish fan” arrangement. This means the short-term trend is clearly bearish, and any rebound may face strong suppression from the EMA Ribbon.
It is worth noting that during the bull market peak in 2025, the EMA Ribbon showed a perfect bullish arrangement, and the current bearish arrangement is a clear signal of trend reversal. Before the EMA Ribbon turns bullish again, any buying is counter-trend trading with extremely high risk.
Daily Timeframe for BNB (Binance Coin)
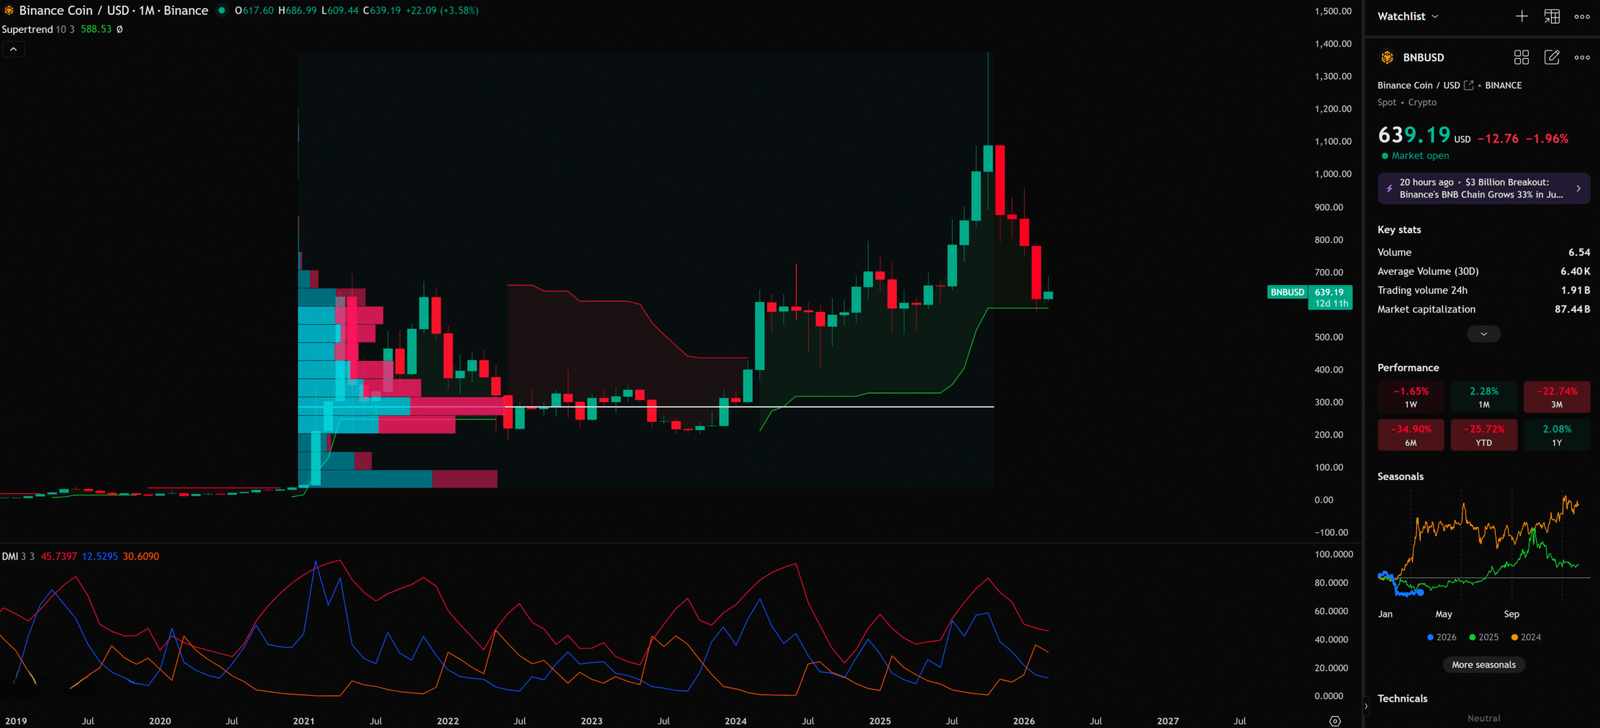
📈 Monthly Chart Analysis: Deep Concerns in Long-Term Indicators
1) Supertrend Indicator’s Reversal Signal
The Supertrend indicator (set to 10, 3) displayed on the monthly chart currently reads $588.53, and the indicator color shows bearish (red). Supertrend is a trend-following indicator; when the price is below the indicator line, it indicates an overall bearish trend. BNB’s monthly Supertrend confirms the medium-to-long-term downtrend.
2) DMI Indicator’s Strong Bearish Signal
The DMI (Directional Movement Index) at the bottom of the monthly chart shows: DI- (negative directional indicator, red line) value is 45.74, far higher than DI+ (positive directional indicator, blue line) at 12.53, and ADX (Average Directional Index, orange line) is 30.61, indicating that the current downtrend’s strength is quite significant.
This combination tells us: monthly-level selling pressure remains strong, and bearish forces dominate. Until DI+ re-exceeds DI-, the monthly trend remains bearish.
Monthly Timeframe for BNB (Binance Coin)
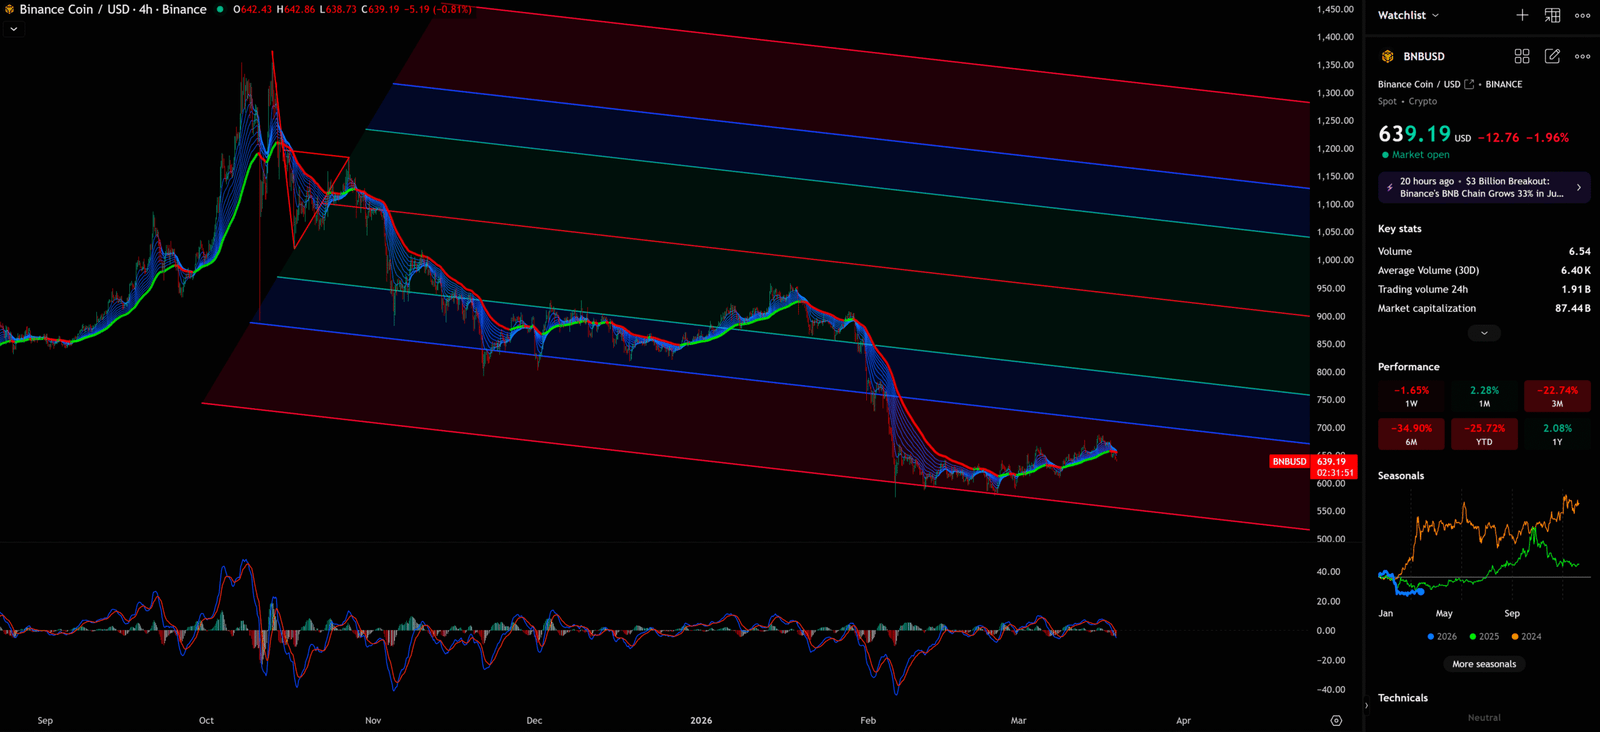
📉4-Hour Chart Analysis: Short-Term Rebound Opportunity and Channel Boundaries
1) The Boundaries of the Descending Parallel Channel
From the 4-hour chart, we can clearly see a descending parallel channel. The upper band (red) and lower band (red) of the channel are clearly visible, and BNB’s price is declining orderly within the channel. Currently, the price is running near the lower area of the channel, which means a technical rebound may occur in the short term.
However, it must be emphasized: a rebound within a parallel channel is just normal fluctuation within the channel and does not represent a trend reversal. Only when the price can effectively break through the channel’s upper band and stabilize above it can we confirm a change in the short-term trend.
2) Short-Term Suppression from EMA Ribbon
The EMA Ribbon on the 4-hour chart also shows a bearish arrangement, with the various EMA lines (blue for short-term, red for long-term) forming a strong suppression band. In the $650-$700 area, the EMA Ribbon constitutes obvious short-term resistance
4-Hour Timeframe for BNB (Binance Coin)
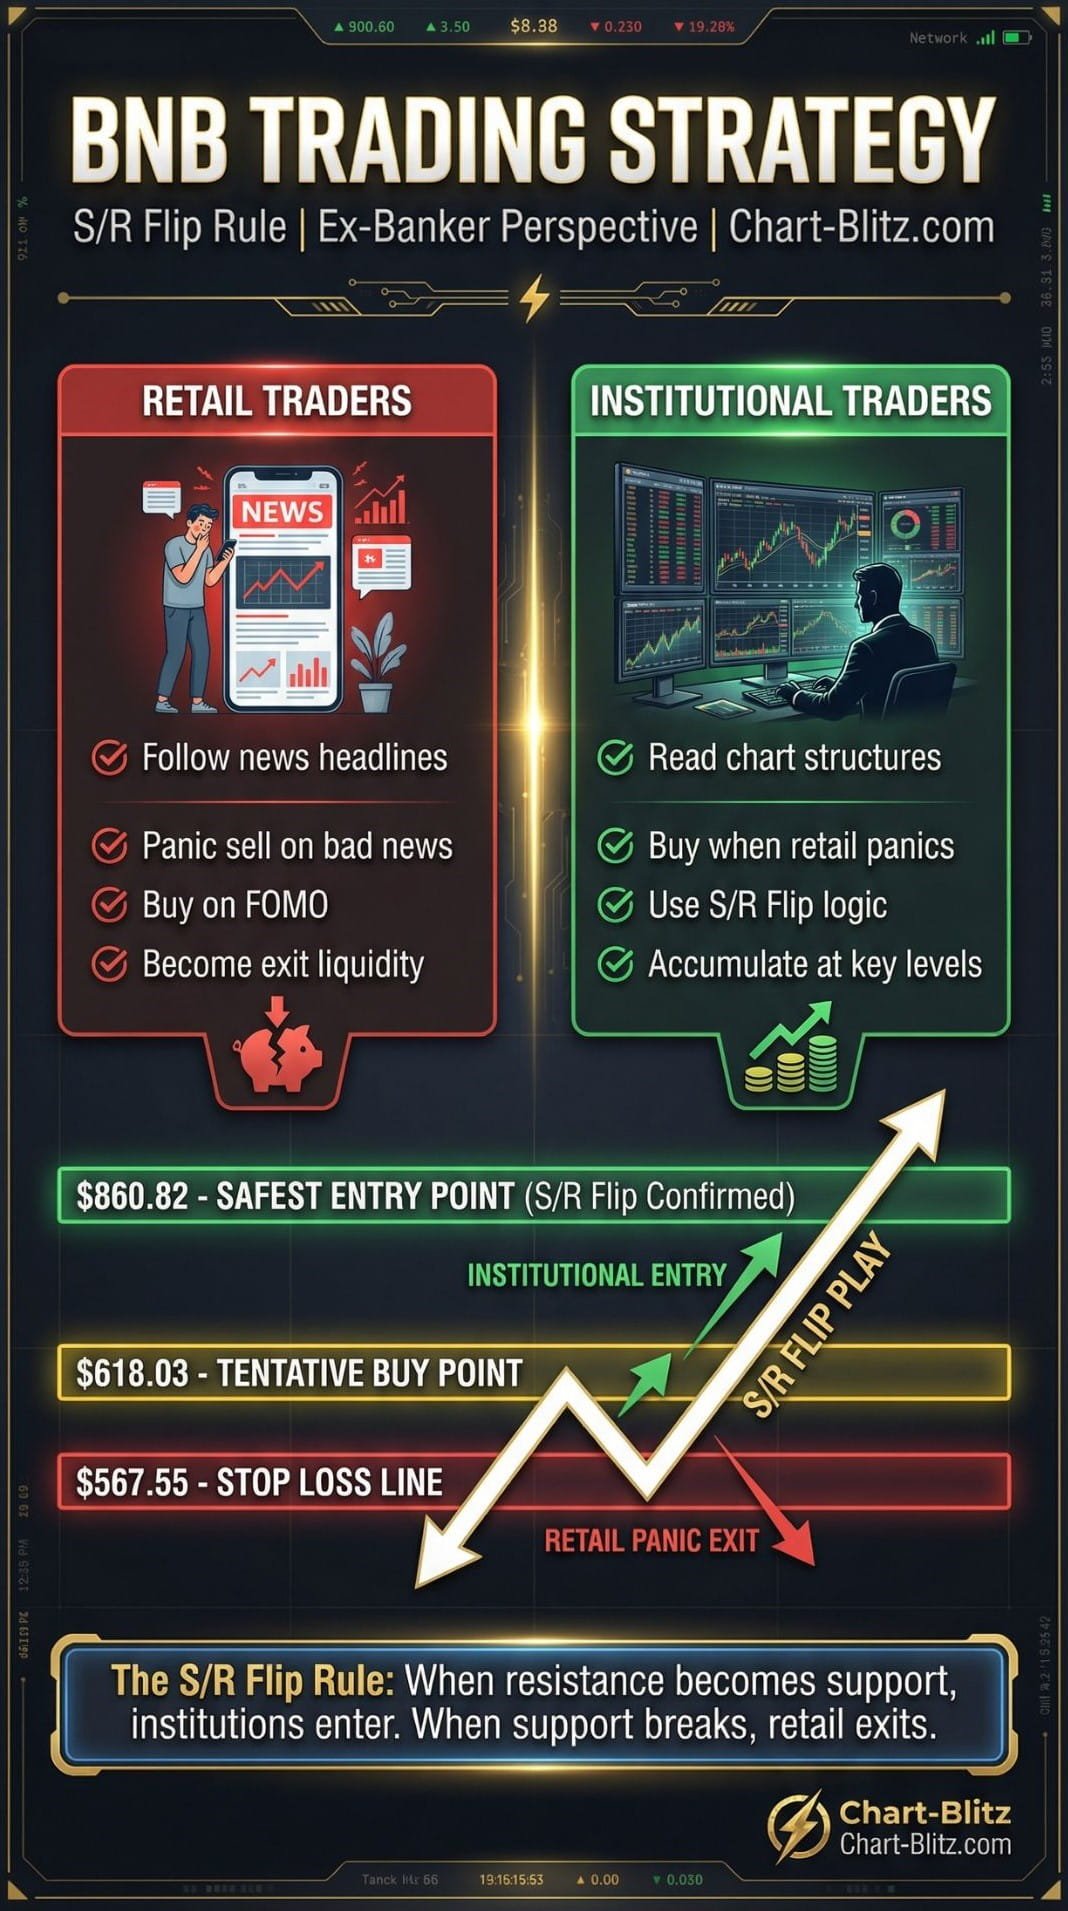
💡Ex-Banker Perspective: The Information Asymmetry Game Between Retail and Institutions
In 20 years of working in bank trading rooms, I’ve seen too many cases of retail investors losing everything by “trading on news.” Let me share a real scenario:
In late 2025, BNB began falling from its high of $1,375. With each drop, the market would produce various “bullish news” — BNB Chain’s technical upgrades, Binance’s new partnerships, BSC ecosystem’s explosive growth. Retail investors, seeing this news, excitedly “bottom-fished.” However, institutional algorithms were quietly selling, using retail buying as exit liquidity.
This is the cruel reality of information asymmetry. Retail investors only see the “news” card, while institutions are calculating all possibilities on the entire table. In bank trading rooms, we have a saying: “Retail buys news, institutions buy charts.”
Today, the news of BNB Chain’s 33% RWA growth is “bullish” for retail investors, but for institutions, this may just be “an opportunity to create exit liquidity.” Before the charts give a clear reversal signal, any bullish news could be a trap
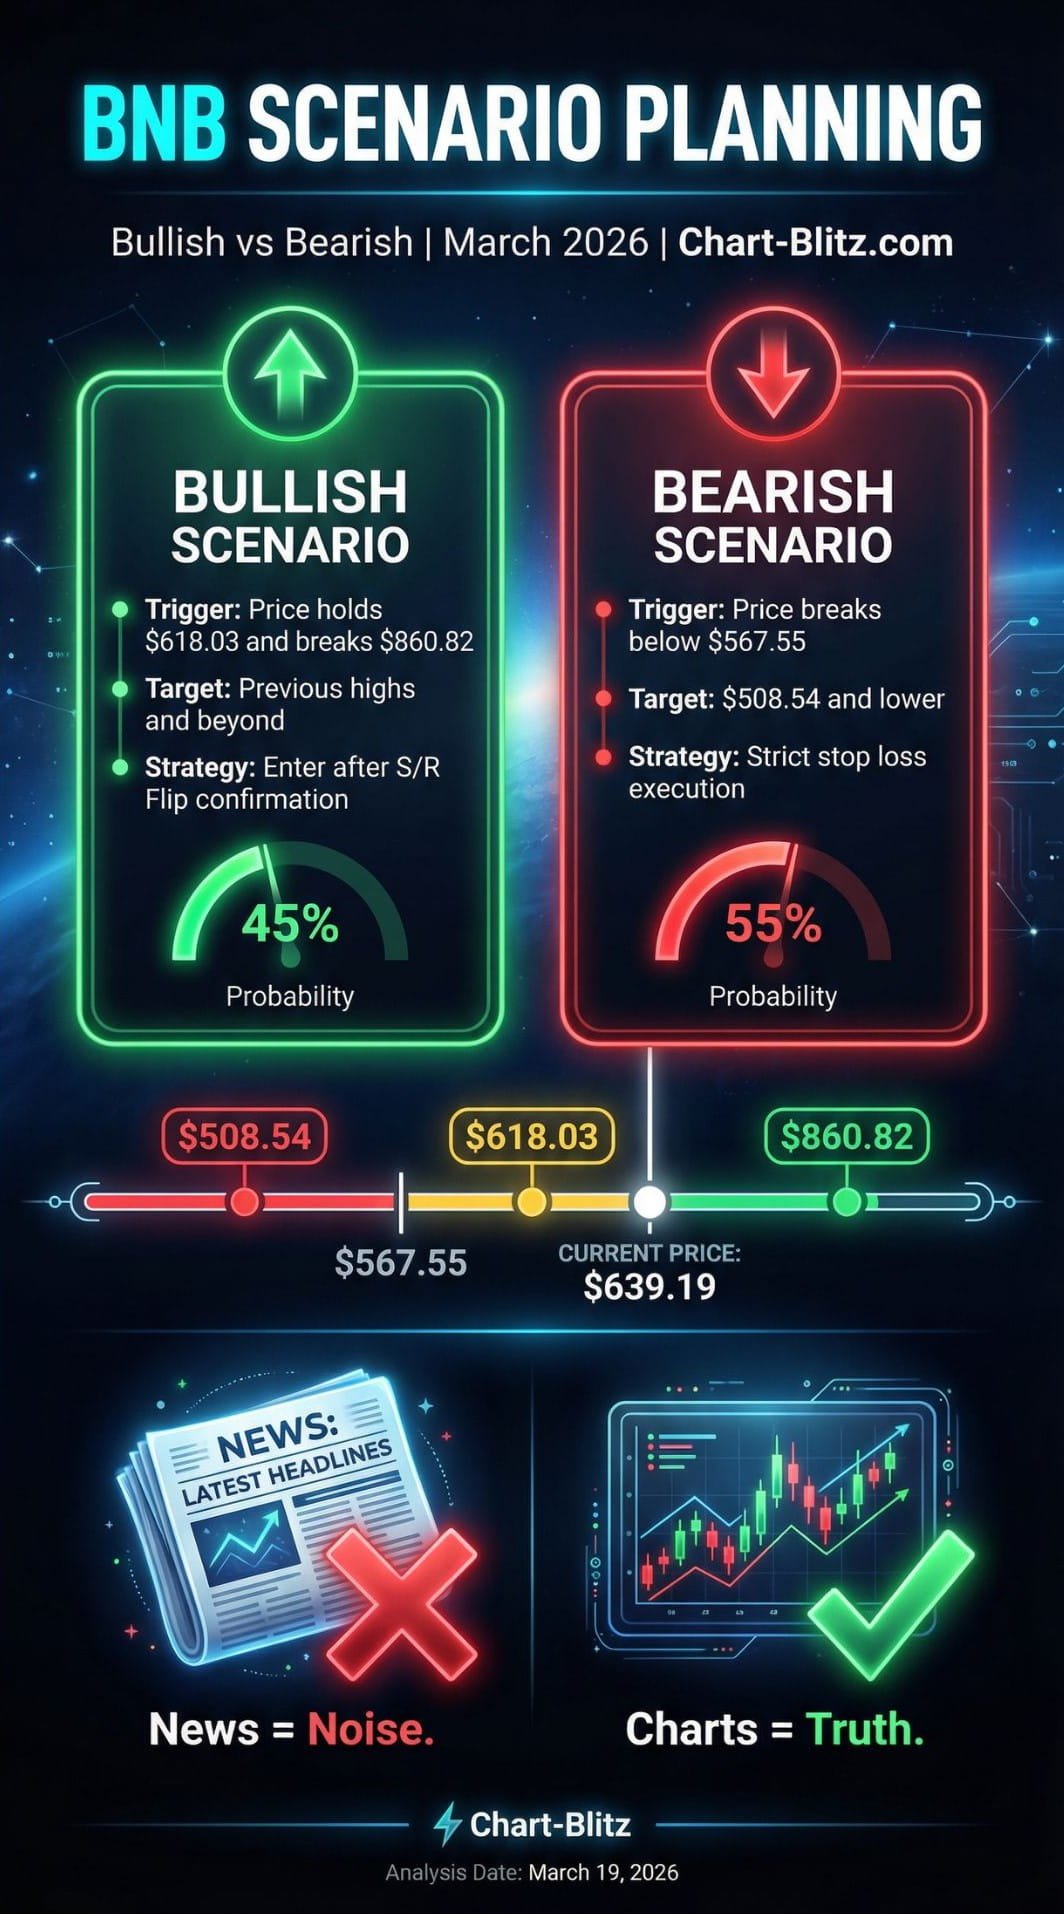
🎯S/R Flip Rule and Multi-Scenario Planning
The Core Logic of S/R Flip (Support/Resistance Flip)
S/R Flip is one of the most powerful concepts in technical analysis. Its core logic is: a previously strong support level, once effectively broken, transforms into a strong resistance level; and vice versa.
When projecting BNB’s future price movements and formulating trading plans, we must apply the S/R Flip rule:
Theoretically, BNB’s downtrend should not be over yet, but if the BNB price does not continue to fall and instead turns upward and explodes, we need to see if it can break through the resistance zone ($860.82). If it breaks above and holds, enter the market; otherwise, if it hits the stop loss ($567.55), sell and exit immediately.
a) Bullish Scenario
Trigger Condition: The price forms a double bottom or other reversal pattern at $618.03 (Tentative Buy Point), accompanied by increased volume, then strongly breaks through $860.82 (Safest Entry Point) and stabilizes above this level.
Target Price: First target $942.01 (Fibonacci 50% retracement), second target $1,044.31 (Fibonacci 38.2% retracement), long-term target challenges previous highs.
Entry Strategy: Wait for S/R Flip confirmation at $860.82 before entering, i.e., wait for the price to break through $860.82 and then pull back to this level, confirming its transformation from resistance to support, before entering the market to reduce risk.
Stop Loss: Stop loss if price falls below $800.
b) Bearish Scenario
Trigger Condition: The price falls below $567.55 (Stop Loss) and cannot recover this level within 3 trading days.
Target Price: First target $508.54 (Fibonacci 100% retracement); if this level is broken, it may further test $400 or even lower levels.
Strategy: Strictly execute the stop loss; do not attempt to “bottom-fish” during the decline. Wait for a clear reversal signal on the monthly chart (such as DMI golden cross, Supertrend turning bullish) before re-evaluating entry opportunities.
c) Re-Entry Strategy After Stop Loss
If the $567.55 stop loss is triggered, it does not mean BNB is finished. After the stop loss, remain calm and wait for the following signals before re-evaluating:
- The monthly chart’s Supertrend indicator turns bullish (green) again.
- The weekly chart’s MACD forms a golden cross and is above the zero axis.
- The daily chart’s EMA Ribbon turns bullish again.
- Volume significantly increases at key support levels, showing signs of institutional accumulation.
📰 Comprehensive Conclusion and Trading Plan Summary
| Item | Value | Notes |
| Analysis Baseline Price | $639.19 USD | 2026-03-19 09:00 EST |
| Tentative Buy Point | $618.03 | Requires volume confirmation |
| Safest Entry Point | $860.82 | After S/R Flip confirmation |
| Stop Loss | $567.55 | Elliott Wave Iron Rule defense |
| Bullish Target 1 | $942.01 | Fibonacci 50% |
| Bullish Target 2 | $1,044.31 | Fibonacci 38.2% |
| Bearish Target | $508.54 | Fibonacci 100% |
| Weekly Trend | Bearish | In Wave 4 correction |
| Monthly Trend | Bearish | DMI bearish dominant |
| Short-term Trend | Bearish | Within descending channel |
Remember, in the financial markets, surviving is always more important than making big money.
I will continue to closely follow the price action of this crypto. Once I spot a critical reversal signal on the chart, I will update my analysis and views here immediately. Remember to bookmark this page and come back anytime to check the latest updates!
Charts don’t lie, but you have to learn their language.
Want to see our full, interactive chart breakdown? If you want to learn how to draw Fibonacci Retracement Ratio yourself, identify S/R Flips, and stop trading blind. Please browse the following『Further Reading』links. Fundamental news tells you what happened. Technical analysis predicts what will happen. To master the professional framework that separates market signal from noise, explore our exclusive models at www.chart-blitz.com.
📚Further Reading:
- Complete Guide to Fibonacci Retracement — The magical application of Fibonacci sequences in financial markets, and how to combine them with other indicators to improve the accuracy of Fibonacci levels.
- Elliott Wave Theory for Beginners — Learn the counting methods for 1-2-3-4-5 impulse waves and A-B-C corrective waves, as well as the four iron rules of Elliott Wave theory. Master this tool and you’ll be able to see the “roadmap” that retail investors cannot.
- Volume Profile (VPFR) Tutorial — Learn how to use VPFR to identify POC (Point of Control) and “vacuum zones,” thereby predicting market maker layouts and retail liquidity traps.
- S/R Flip Support and Resistance Swap Strategy — S/R Flip is one of the most powerful concepts in technical analysis. This article uses real cases to teach you how to use S/R Flip to capture the highest win-rate trading opportunities.
【Disclaimer】 The content herein is for educational purposes and reflects the author’s personal opinion only; it is not investment advice. All financial investments, including cryptocurrencies, carry significant risk, and you could lose your entire capital. To support this site, this article may contain affiliate links. While we strive for accuracy, we cannot guarantee all information is complete or error-free. Please conduct your own research and be fully responsible for your own investment decisions.