The speculator’s chief enemies are always boring from within. It is inseparable from human nature to hope and to fear
William Delbert Gann – 1949
Opening Bitcoin Cash (BCH) has recently re-entered the market spotlight, with reports of growing retail interest fueling significant intraday price movements. However, while fundamental news provides the “what” for market attention, only rigorous technical analysis can predict the “when” and “how” of future price action. This article provides a deep dive into BCH’s multi-timeframe charts to explore whether a fundamental structural shift is occurring beneath the surface of the current news-driven excitement.
Analysis Benchmark Statement All subsequent technical analysis is based on a price snapshot locked in on October 10, 2025, 15:15 (UTC+8): BCH = $594.57 USD. This price snapshot provides a stable reference point for the analysis. All support, resistance, and projected paths are relative to this benchmark. As market prices are in constant flux, readers should treat this report as an “analytical map,” not as a real-time price feed.
The Catalyst and Fundamental View (The Rear-view Mirror) Over the past 24 hours, the most prominent news has been about BCH’s breakout potential fueled by “growing retail interest.” Such narratives effectively explain the source of capital inflows and market attention, acting as a catalyst for short-term volatility. However, the sustainability of this sentiment-driven focus must be validated by the chart structure. Viewing news as “context” rather than a predictive tool is the first step in professional analysis.
The Predictive Lens: A Multi-Timeframe Technical Deep Dive
Multi-Timeframe Technical Deep Dive (The Predictive Lens) This is the core of the analysis, integrating your accurate initial observations into a broader structural narrative.
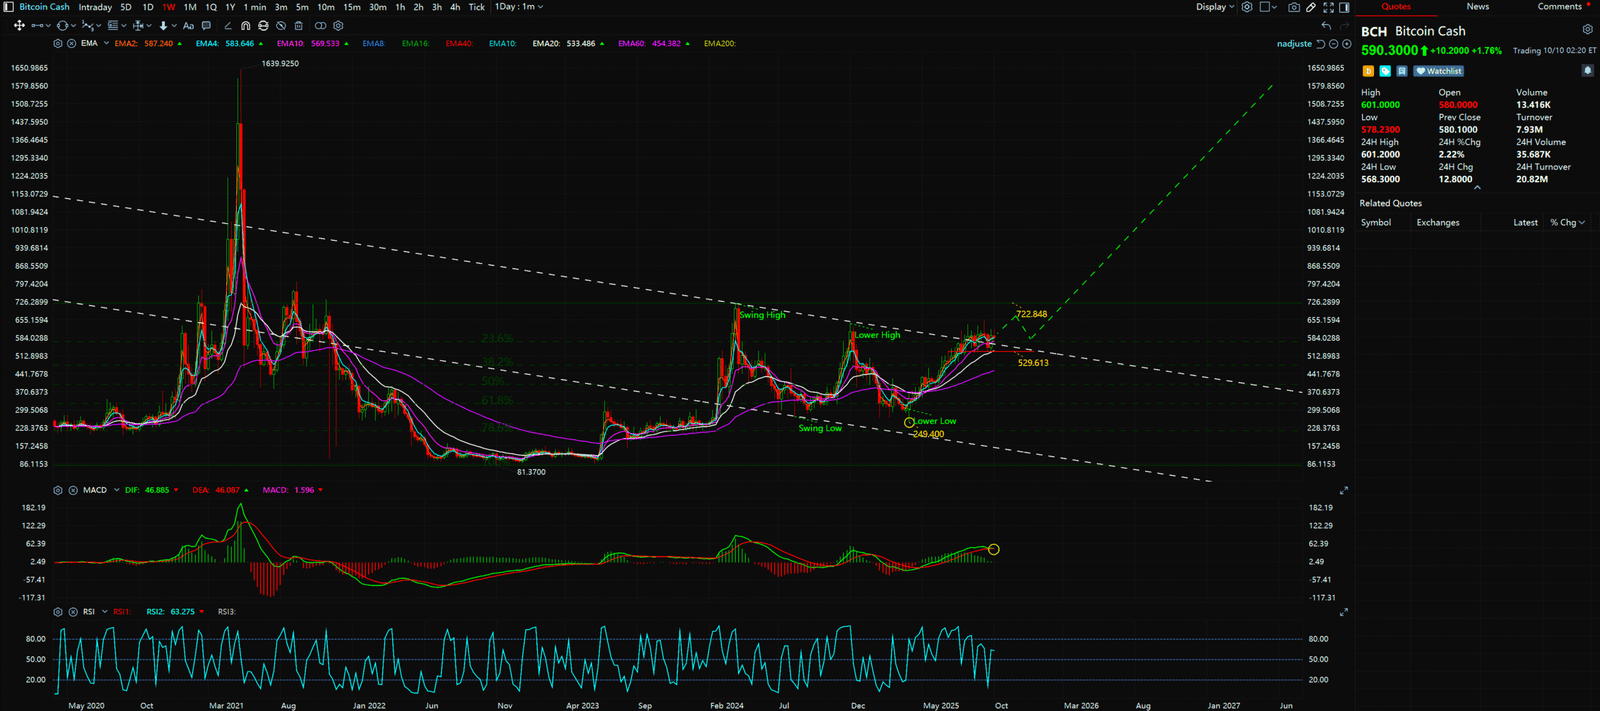
- Weekly Chart Analysis (The Macro Structural Shift): From the user-provided weekly chart, a multi-year descending trend channel is clearly visible. However, the most critical event has already occurred: the price not only found support at the crucial 78.6% Fibonacci retracement level (around $249.4) of the entire impulse wave from the November 2022 low (approx. $81.37) to the 2024 high (approx. $719.5), but it has also powerfully rallied to break out above the top of this long-term descending channel (approx. $587.3). This is an exceptionally strong bullish signal, indicating a market structure shift from a bear market of “Lower Highs and Lower Lows” to a potential new uptrend. The MACD indicator on the weekly chart, with both its lines running above the zero line, confirms the current macro strong-market environment.
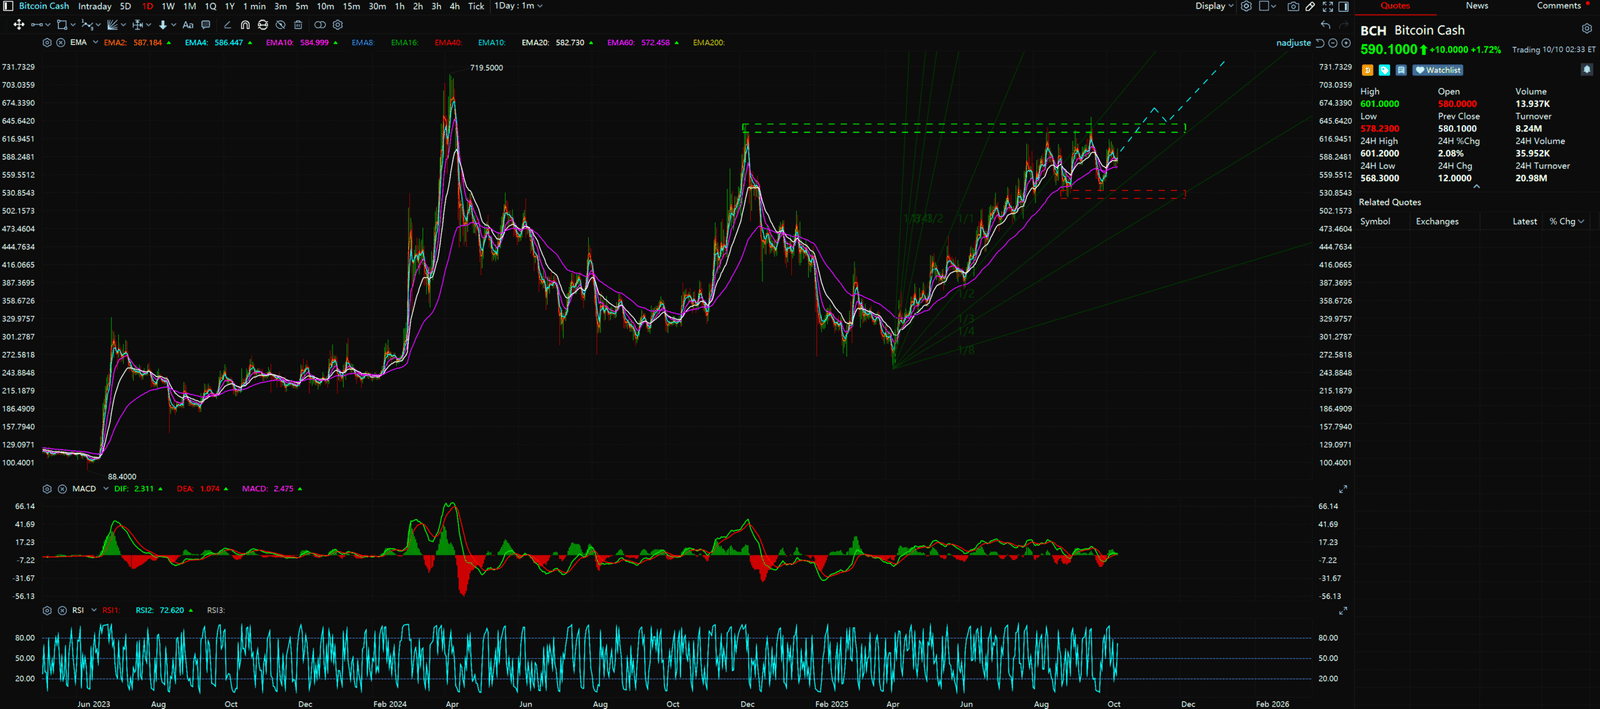
- Daily Chart Analysis (Short-Term Consolidation & Confirmation): Switching to the daily chart, we see the price undergoing a healthy consolidation after the long-term channel breakout. The chart shows that the price met significant resistance near $640 and has found solid support around $524. The recent successful retest of the $524 support zone, followed by a bounce, demonstrates buyer strength. More importantly, the price is holding above a key ascending trendline (Gann angle 1×3), which provides dynamic support for any short-term pullbacks. The daily MACD is also above the zero line; although the MACD line is temporarily below the signal line, this is typically interpreted as a brief pause or energy accumulation within an uptrend, not a reversal.
Synthesis Analysis & Unique Insight
There is no “trend divergence” between the weekly and daily charts. Instead, they present a classic picture of “trend alignment” but with a “rhythm difference.” The weekly chart tells the grand story of a “long-term trend reversal,” while the daily chart shows the “first post-breakout confirmation pullback” that the market is currently executing.
The conclusion is clear: BCH has broken free from its long-term bearish shackles. The current consolidation is a preparation for the next leg up. The true test lies in whether the price can decisively break the previous swing high of $719.5. A break above this level would confirm a new bull market structure of “Higher Highs and Higher Lows,” at which point a more powerful and sustained uptrend can be reasonably expected. Conversely, if the price fails to break out and instead breaks down below the key daily support at $524 and the weekly pink support line at $529.613, it would signify a failed breakout. The bullish thesis would be invalidated, and strict risk management must be enforced.


Key Takeaways
Summary / Key Price Levels:
- Primary Resistance (Bull Market Confirmation): $719.5 USD
- Secondary Resistance: $640.0 USD
- Primary Support (Bullish Invalidation Point): $524.0 – $529.6 USD
- Secondary Support (Trendline): Approx. $570 USD (Daily ascending trendline)
For continuous, real-time analysis of these developing market structures, visit www.chart-blitz.com.
Fundamental news tells you what happened. Technical analysis predicts what will happen. To master the professional framework that separates market signal from noise, explore our exclusive models at www.chart-blitz.com.
Sources:
- https://www.fxstreet.com/cryptocurrencies/news/bitcoin-cash-price-forecast-bch-flashes-breakout-potential-as-retail-interest-grows-202510100546
- https://www.coindesk.com/markets/2025/10/09/aave-plunges-below-key-support-levels-amid-broader-crypto-weakness
- https://decrypt.co/343617/bitcoin-cools-gold-stocks-all-time-highs
- https://cointelegraph.com/news/eth-sells-off-alongside-bitcoin-but-ether-adoption-pace-still-supports-rally-to-dollar10k
Unlocking Technical Analysis: Power Moves with Diagrams !
Monthly Timeframe for Bitcoin Cash (BCH)
Daily Timeframe for Bitcoin Cash (BCH)