The speculator’s chief enemies are always boring from within. It is inseparable from human nature to hope and to fear
William Delbert Gann – 1949
Recently, news of the Japanese firm Metaplanet investing hundreds of millions to increase its Bitcoin holdings has captured the market’s attention, injecting a dose of optimism into the crypto space. However, when we shift our focus from the noisy headlines to the cold, hard data of the price charts, a different story unfolds. Fundamental news provides the “what” to analyze, but only rigorous technical analysis can reveal the “when” and “how” of future market movements.
Analysis Benchmark Statement: All subsequent technical analysis is based on a price snapshot locked in on September 22, 2025, 14:41 (UTC+8): Bitcoin (BTC) = $113,641.86 USD. This price snapshot provides a stable reference point for analysis. All support, resistance, and projected paths are relative to this benchmark. Market prices are volatile; readers should treat this report as an “analytical map,” not a real-time quote.
Catalysts & Fundamental View (The Rear-view Mirror): The most heated discussion in the last 24 hours has been Metaplanet’s acquisition of over 5,400 BTC. On the surface, this is an unequivocally bullish signal. It not only signifies institutional validation of Bitcoin as a store of value but could also inspire FOMO-driven buying from the broader market. However, a seasoned analyst must ask: is this “good news” potent enough to reverse a pre-existing trend on the charts?
The Predictive Lens: A Multi-Timeframe Technical Deep Dive
Multi-Timeframe Technical Deep Dive (The Predictive Lens) This is the core section. Our analysis is strictly based on the user-provided charts:
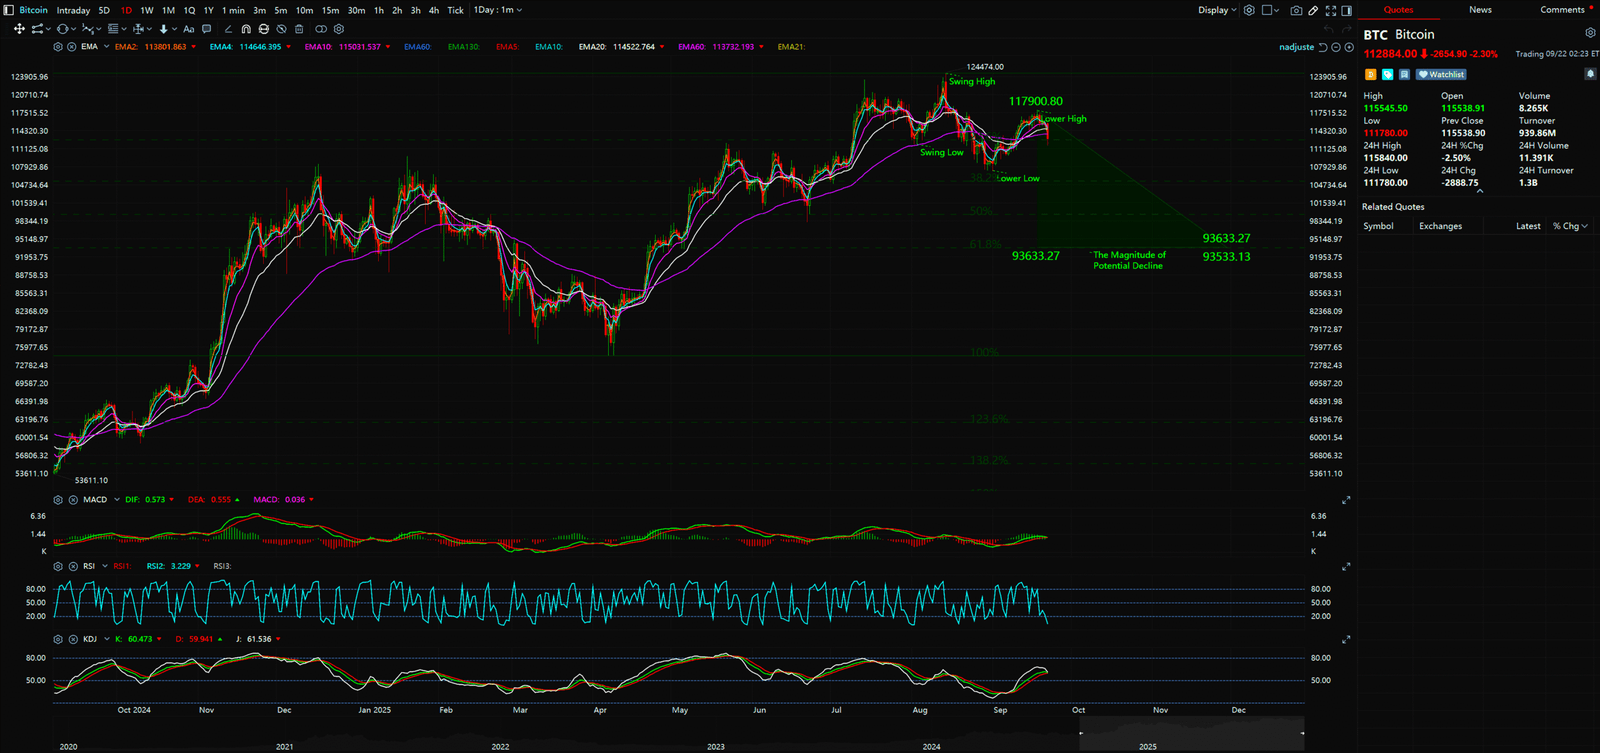
- The Daily Chart – Dominance of the Macro Downtrend: The provided daily chart clearly illustrates a textbook bearish trend structure, characterized by a series of Lower Highs and Lower Lows. Since hitting a swing high around $117,500 USD, the price failed to push higher, instead forming a Lower High. Subsequently, the price continued its descent, confirming the Lower Low pattern. The moving averages are in a bearish formation, further validating the market’s weakness. The chart even highlights a potential downside target zone around $93,500 – $93,600 USD, indicating significant potential for further decline. Within this macro structure, any rally should be treated as temporary unless the price can decisively break and hold above previous highs.
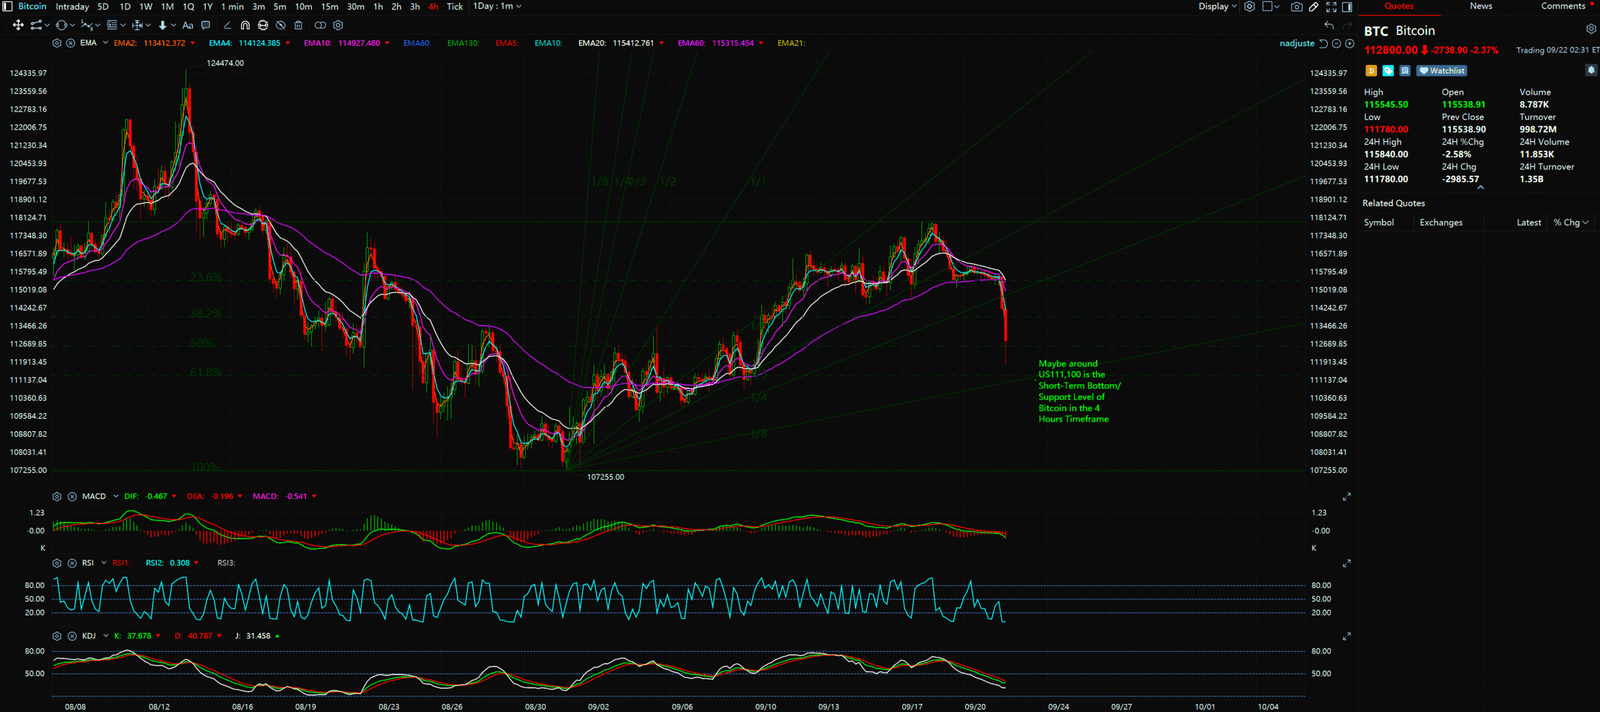
- The 4-Hour Chart – Signal of a Short-Term Rally’s End: Switching to the 4-hour chart, we see more granular details of the recent price action. After a multi-day rebound, the price met resistance around $118,900 USD and was rejected. Critically, the subsequent drop was substantial, breaking below the support of the previous rally and creating a new Lower Low. This is preliminary but crucial evidence that the short-term bullish momentum has exhausted and is potentially realigning with the larger downtrend of the daily timeframe. A note on the chart points to $111,100 USD as a potential short-term support level, but a decisive break below this level would further confirm the bearish structure.
Synthesis and The Professional’s Viewpoint
The current “chart story” and “news background” are in clear conflict. The macro downtrend on the daily chart is the dominant force at play, and the structural break on the 4-hour chart acts as fresh confirmation for this prevailing trend. The Metaplanet buying news, while providing short-term liquidity and attention, appears on the chart as a mere ripple in a pre-existing downtrend, rather than a tidal wave capable of changing its course.
The conclusion is that the weight of the technical signals currently far outweighs that of a single fundamental news event. As long as the price operates within the bearish structure of the daily chart, the overall strategy should lean towards caution. Traders should watch the short-term support at $111,100 USD closely, as well as the resistance zone formed by previous highs (approx. $117,500 – $118,900 USD).


Key Takeaways
Summary / Key Price Levels:
- Major Resistance: $117,500 USD (Previous swing high on the daily chart)
- Minor Resistance: $118,900 USD (Recent high on the 4-hour chart)
- Short-Term Support: $111,100 USD (Potential support on the 4-hour chart)
- Macro Potential Target: $93,600 USD (Indicated downside target on the daily chart)
For continuous, real-time analysis of these developing market structures, visit www.chart-blitz.com.
Fundamental news tells you what happened. Technical analysis predicts what will happen. To master the professional framework that separates market signal from noise, explore our exclusive models at www.chart-blitz.com.
Sources:
- https://www.fxstreet.com/cryptocurrencies/news/crypto-market-dips-wiping-out-over-630-million-in-liquidations-while-metaplanet-adds-5-419-btc-202509220447
- https://coingape.com/metaplanet-climbs-fifth-largest-corporate-bitcoin-treasury-5419-btc-purchase/
Unlocking Technical Analysis: Power Moves with Diagrams !
Daily Timeframe for Bitcoin (BTC)
4-Hour Timeframe for Bitcoin (BTC)