The speculator’s chief enemies are always boring from within. It is inseparable from human nature to hope and to fear
William Delbert Gann – 1949
While Bitcoin, the market’s bellwether, is showing signs of a short-term pullback, a curious strength is emerging in Ethereum. This divergence between the two crypto giants presents a complex picture, suggesting that the market’s next major move may not be as straightforward as it seems.
Top Stories at a Glance
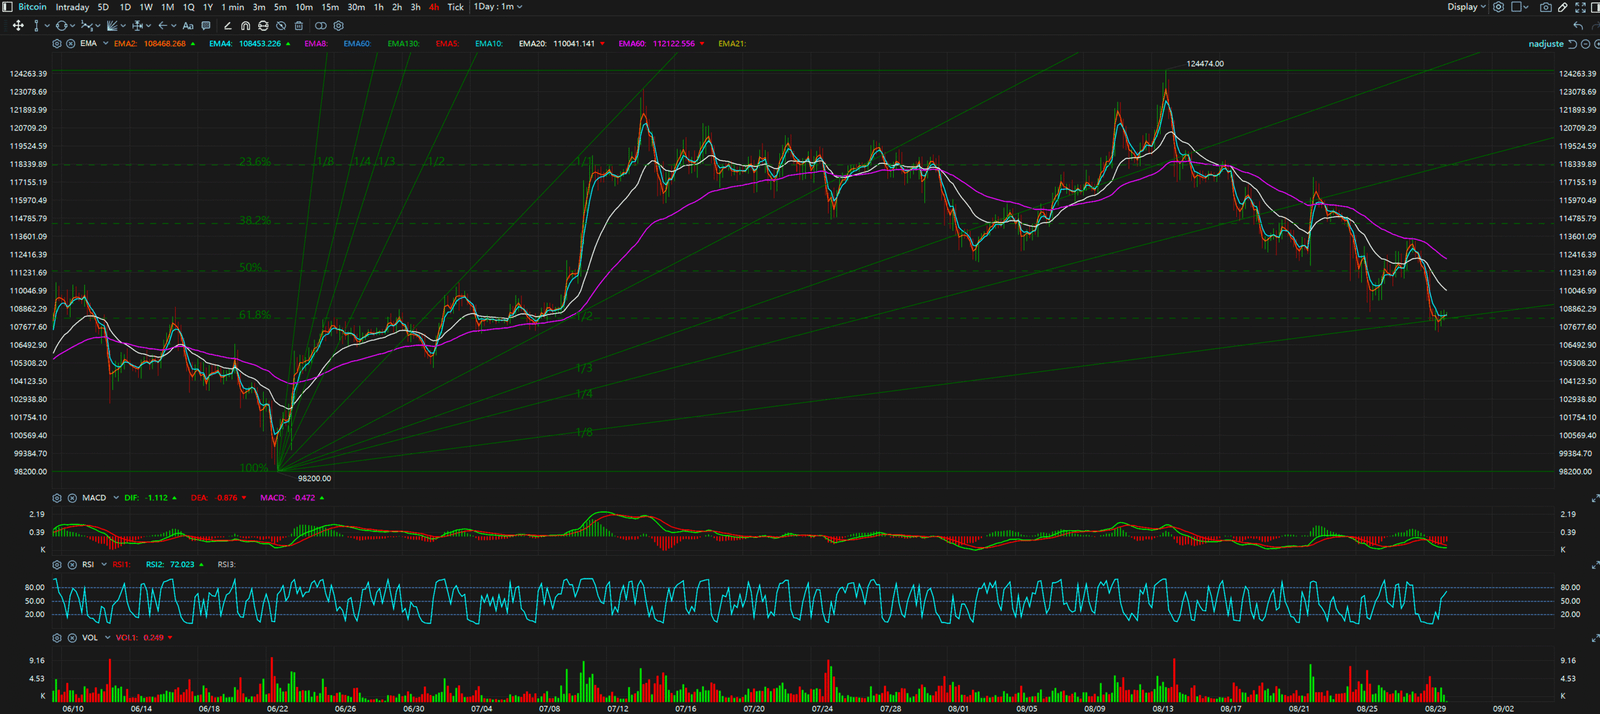
The Bear Case / The Obvious Story: Bitcoin is currently facing downward pressure, having fallen 1.53% over the past 24 hours to a price of $108,489. This price action has brought BTC to a critical juncture. The immediate support level to watch is $108,000; a break below this could signal a deeper correction. On the upside, resistance is firmly established at $110,000, a level Bitcoin must reclaim to restore bullish momentum. This bearish sentiment in the market leader is causing many to proceed with caution.
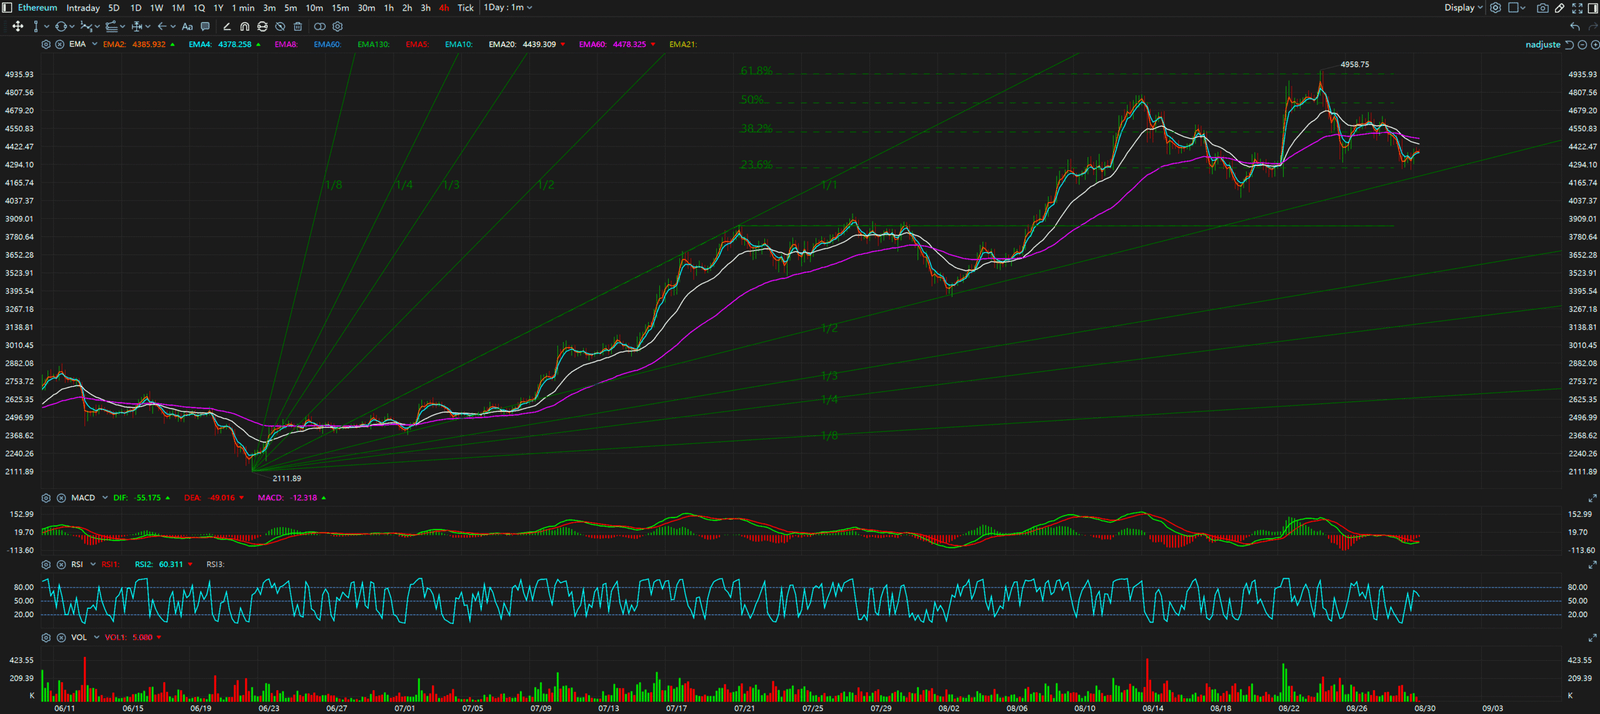
The Bull Case / The Hidden Signal: In stark contrast, Ethereum has climbed 1.02% in the same 24-hour period, reaching $4,393. This rally in the face of Bitcoin’s decline is a significant development. It suggests that a portion of the market’s capital may be rotating into major altcoins, with traders potentially seeking opportunities outside of a stagnating Bitcoin. This resilience makes Ethereum a key indicator for the market’s overall health.
Synthesis & Implication: This divergence between Bitcoin and Ethereum could have several implications for traders. It might be the early sign of an “altcoin season,” where alternative cryptocurrencies outperform Bitcoin. Alternatively, it could be a temporary decoupling, with the two assets soon to realign. A more bearish interpretation would be that Ethereum’s strength is a “bull trap,” luring in optimistic buyers before a broader market downturn.


Key Takeaways
In summary, the market is at a crossroads, defined by the conflict between a dipping Bitcoin and a rallying Ethereum. Traders should closely monitor the key levels. For Bitcoin, the crucial range is between support at $108,000 and resistance at $110,000. For Ethereum, the levels to watch are support at $4,300 and resistance at $4,500. The resolution of this divergence will likely set the tone for the market in the coming days.
For continuous, real-time analysis of these developing market structures, visit www.chart-blitz.com.
True trading advantage comes from decoding these conflicting signals. To learn the professional-grade framework for seeing the market’s real intentions, explore our exclusive models on www.chart-blitz.com.
Sources:
Unlocking Technical Analysis: Power Moves with Diagrams
4-Hour Timeframe for Bitcoin
4-Hour Timeframe for Ethereum