The speculator’s chief enemies are always boring from within. It is inseparable from human nature to hope and to fear
William Delbert Gann – 1949
While Bitcoin appears robust, maintaining its position near all-time highs, a critical indicator in Ethereum suggests the market’s current rally may be deceptive. This divergence between the market’s two biggest assets presents a core conflict that traders must not ignore.
Top Stories at a Glance
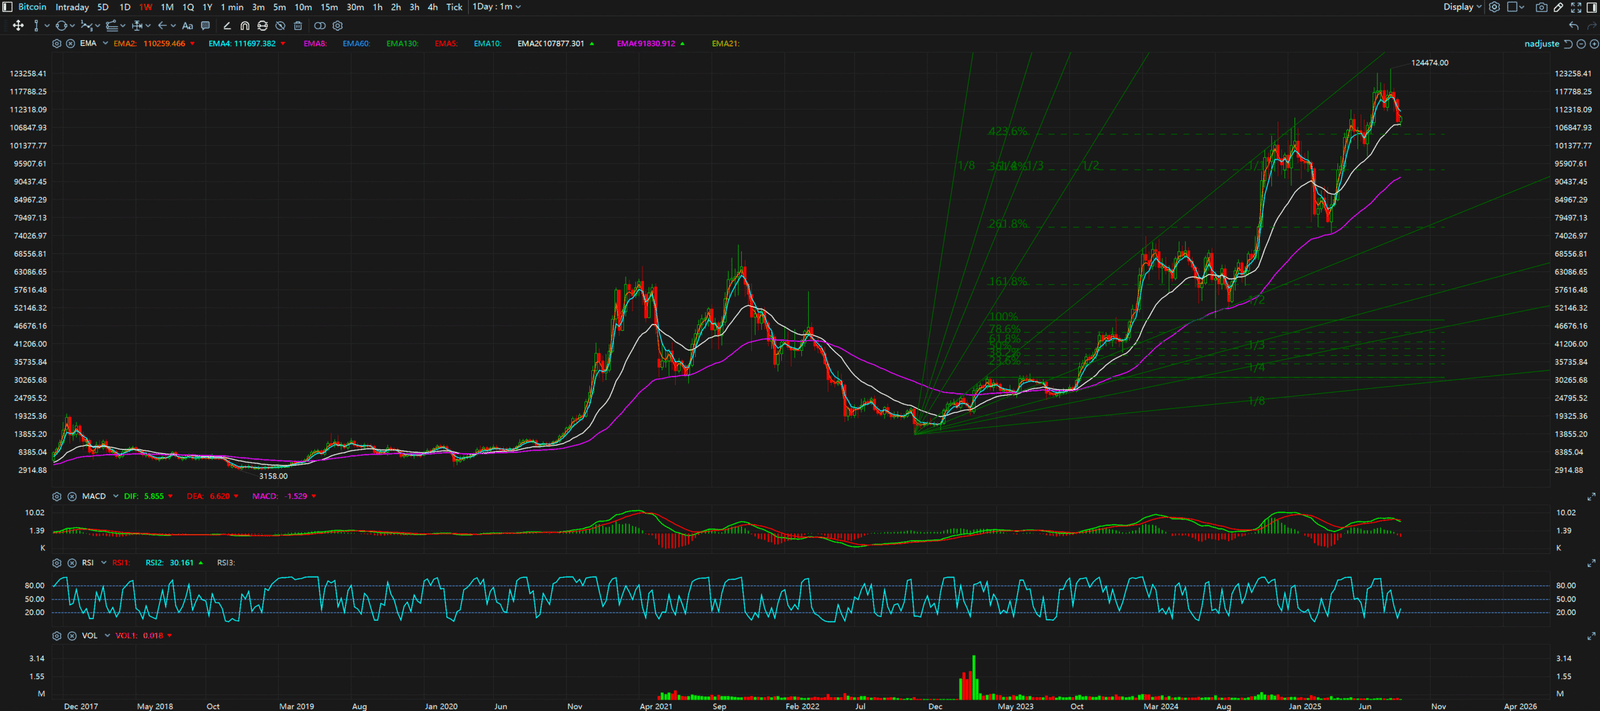
The Bull Case / The Obvious Story: The narrative for Bitcoin remains overtly bullish. The price is consolidating in a tight range around the $110,000 mark after recently setting a new record high. From a market structure perspective, Bitcoin is maintaining a clear “higher highs, higher lows” formation on the daily chart, a textbook sign of a healthy uptrend. This price action is widely interpreted as accumulation, where strong hands absorb supply in preparation for the next leg up.
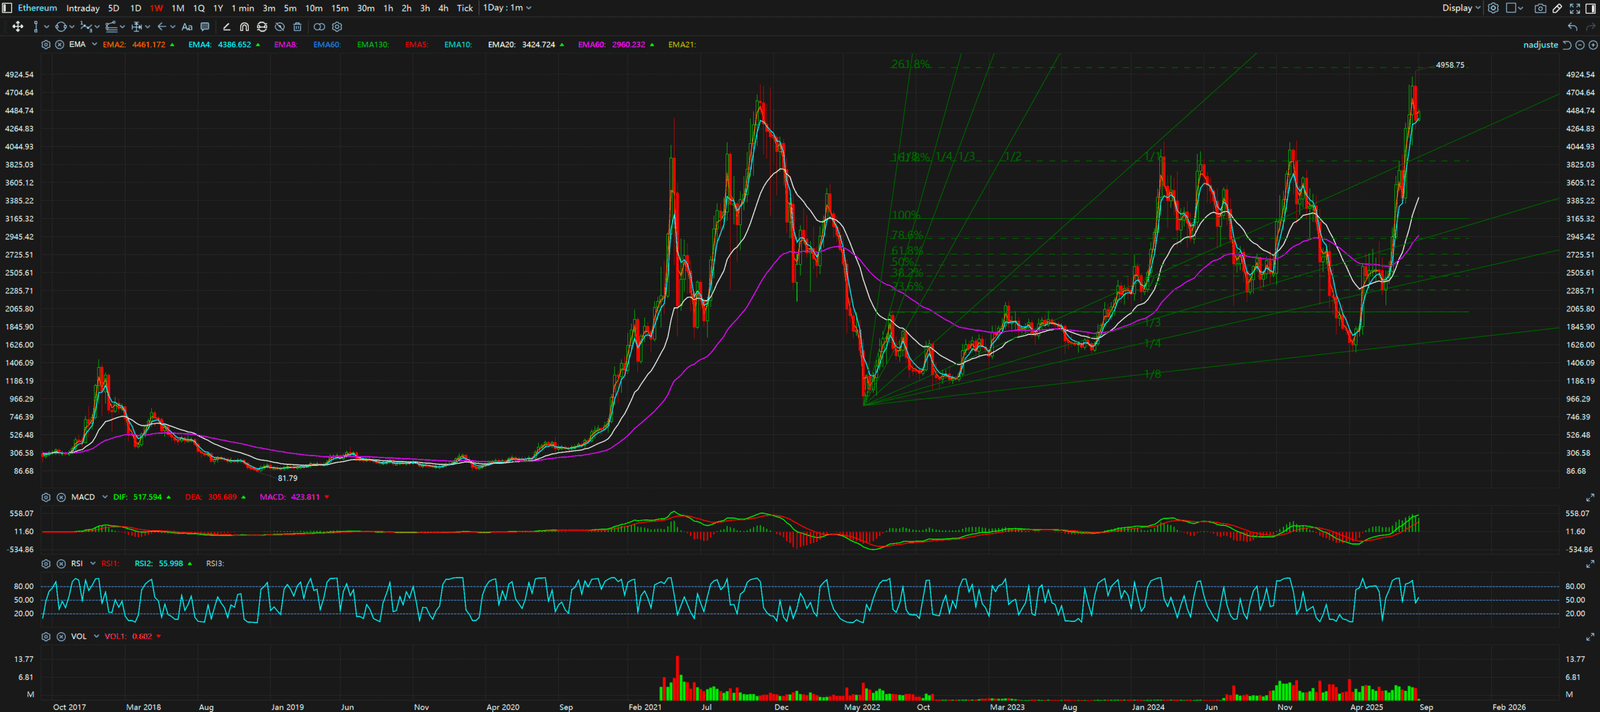
The Bear Case / The Hidden Signal: However, a look at Ethereum’s 4-hour and daily charts reveals a significant MACD Bearish Divergence. While the price of ETH pushed to a new high in lockstep with the market, the MACD histogram printed a lower high. This is a classic technical sign of weakening momentum. It indicates that despite the new price peak, the underlying buying pressure is fading, which could be a precursor to a significant correction or reversal.
Synthesis & Implication: This conflict—Bitcoin’s apparent strength versus Ethereum’s hidden weakness—creates a precarious situation. Often, Ethereum and major altcoins act as a leading indicator for the broader market’s risk appetite. The bearish divergence in ETH could be the “canary in the coal mine,” signaling that the fuel for this rally is running low, even if Bitcoin’s chart doesn’t show it yet. This suggests that traders should exercise caution and not be lulled into a false sense of security by Bitcoin’s stability.


Key Takeaways
In summary, the market is at a critical juncture defined by conflicting signals. While the bullish trend in Bitcoin remains technically intact, the bearish divergence in Ethereum serves as a potent warning. Traders should closely monitor the following key levels: for Bitcoin, resistance at $115,000 and support at $108,000. For Ethereum, a break below the $4,350 support level could confirm the divergence and trigger a broader market downturn.
For continuous, real-time analysis of these developing market structures, visit www.chart-blitz.com.
True trading advantage comes from decoding these conflicting signals. To learn the professional-grade framework for seeing the market’s real intentions, explore our exclusive models on www.chart-blitz.com.
Sources:
Unlocking Technical Analysis: Power Moves with Diagrams
Weekly Timeframe for Bitcoin
Weekly Timeframe for Ethereum