Physical Address
304 North Cardinal St.
Dorchester Center, MA 02124
Physical Address
304 North Cardinal St.
Dorchester Center, MA 02124
The trend is your friend, except at the end where it bends
Jesse Livermore – 1923
While Bitcoin’s recent price action appears robust, a critical divergence in Ethereum’s performance suggests the current market rally may be deceptive. This growing gap between the top two cryptocurrencies warrants a deeper look into the market’s underlying health.
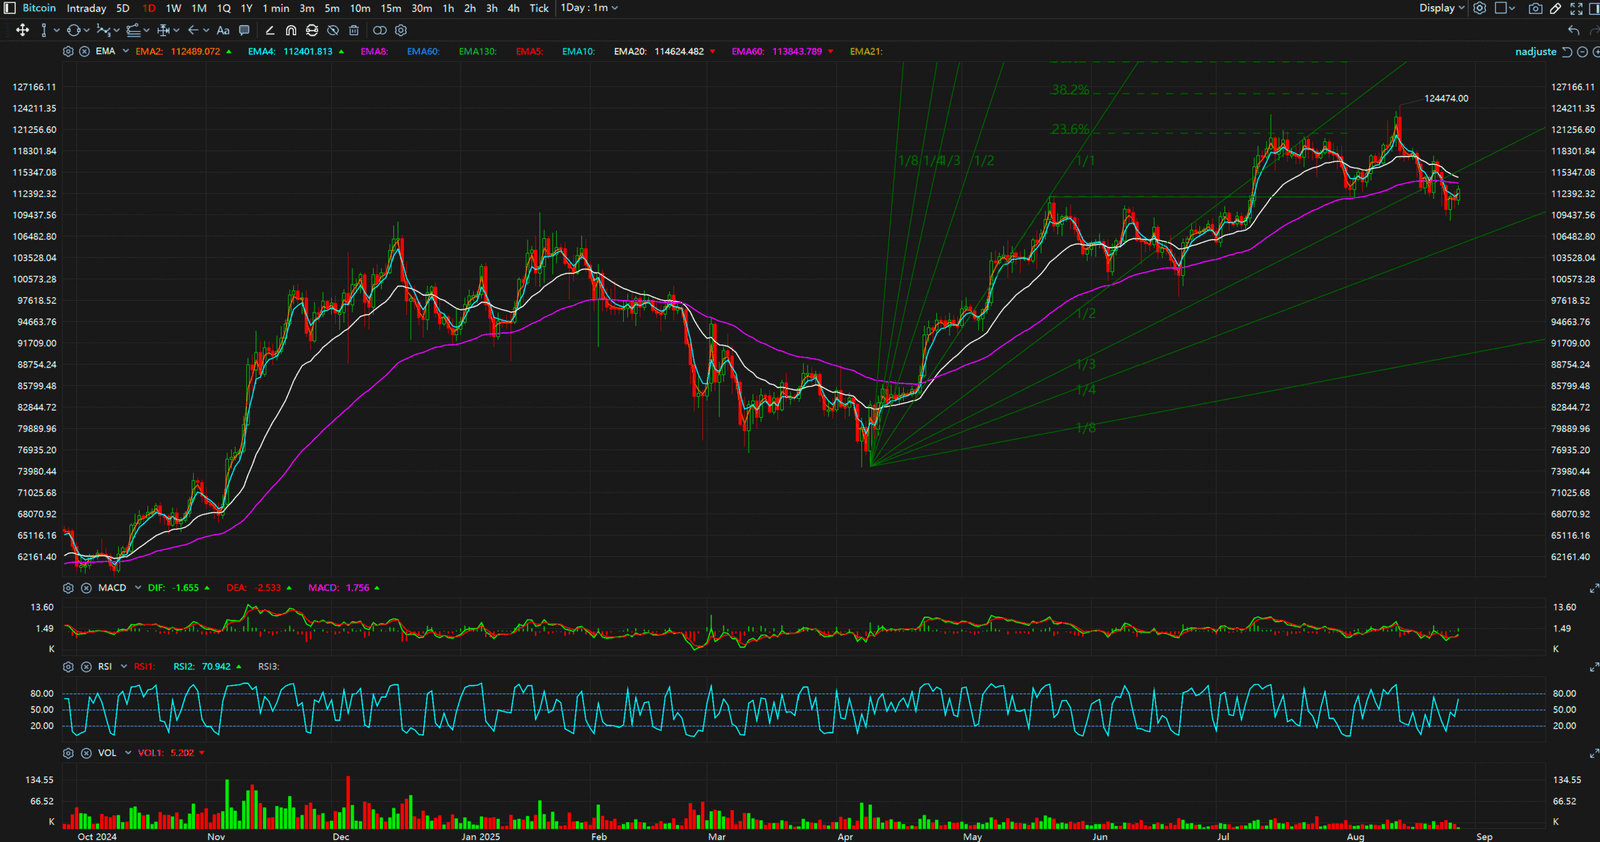
The Bull Case / The Obvious Story: Bitcoin is demonstrating a clear bullish market structure, establishing what appears to be a pattern of ‘higher highs and higher lows.’ The price has confidently broken above former resistance levels and is currently holding strong above the key psychological level of $113,000, fueling optimistic sentiment across the market.
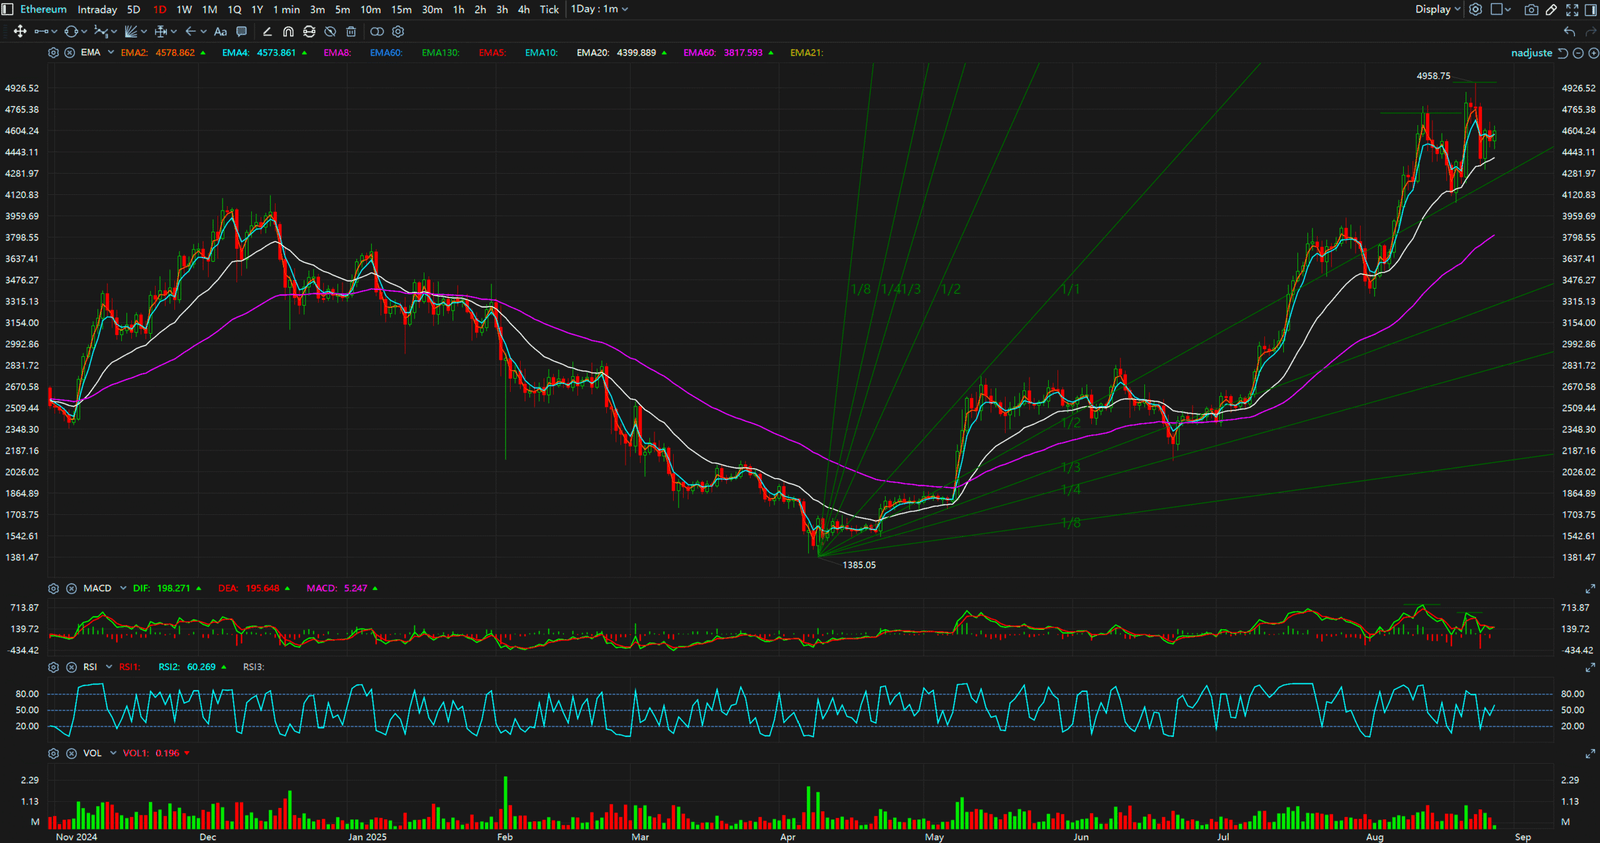
The Bear Case / The Hidden Signal: However, a closer examination of Ethereum’s charts reveals a concerning signal: a classic Bearish Divergence. While Bitcoin is forging new highs, ETH has failed to follow suit, showing a slight decline of -0.19% over the past 24 hours. This divergence, where the market leader’s strength is not confirmed by major altcoins, is often a precursor to a broader market correction, signaling weakening momentum and investor hesitation.
Synthesis & Implication: This conflict between Bitcoin’s ascent and Ethereum’s stagnation implies that the current rally may be narrower than it appears. For traders, this is a critical warning sign. It suggests that “smart money” may be taking profits on altcoins while retail investors chase Bitcoin’s upward trend, a scenario that could lead to a sudden reversal if Bitcoin’s momentum falters.


In summary, the market presents a conflicting picture. While Bitcoin’s trajectory is positive, the bearish divergence shown by Ethereum cannot be ignored. Traders should exercise caution. Key levels to watch for Bitcoin are support at $110,000 and resistance at $115,000. A break below this support could confirm the bearish signal from Ethereum and trigger a wider market downturn.
For continuous, real-time analysis of these developing market structures, visit www.chart-blitz.com.
True trading advantage comes from interpreting these conflicting technical signals. To learn how to apply a professional-grade analytical framework to decode the market’s real intentions, visit www.chart-blitz.com to explore our exclusive chart breakdowns and models.
Sources:
Daily Timeframe for BTC

Daily Timeframe for ETH
