The speculator’s chief enemies are always boring from within. It is inseparable from human nature to hope and to fear
William Delbert Gann – 1949
While Bitcoin’s price action appears robust, climbing steadily above the $112,000 mark, a critical divergence in Ethereum’s chart suggests the market’s current rally may be deceptive. This lack of confirmation from the market’s second-largest asset could be a significant warning sign for traders.
Top Stories at a Glance
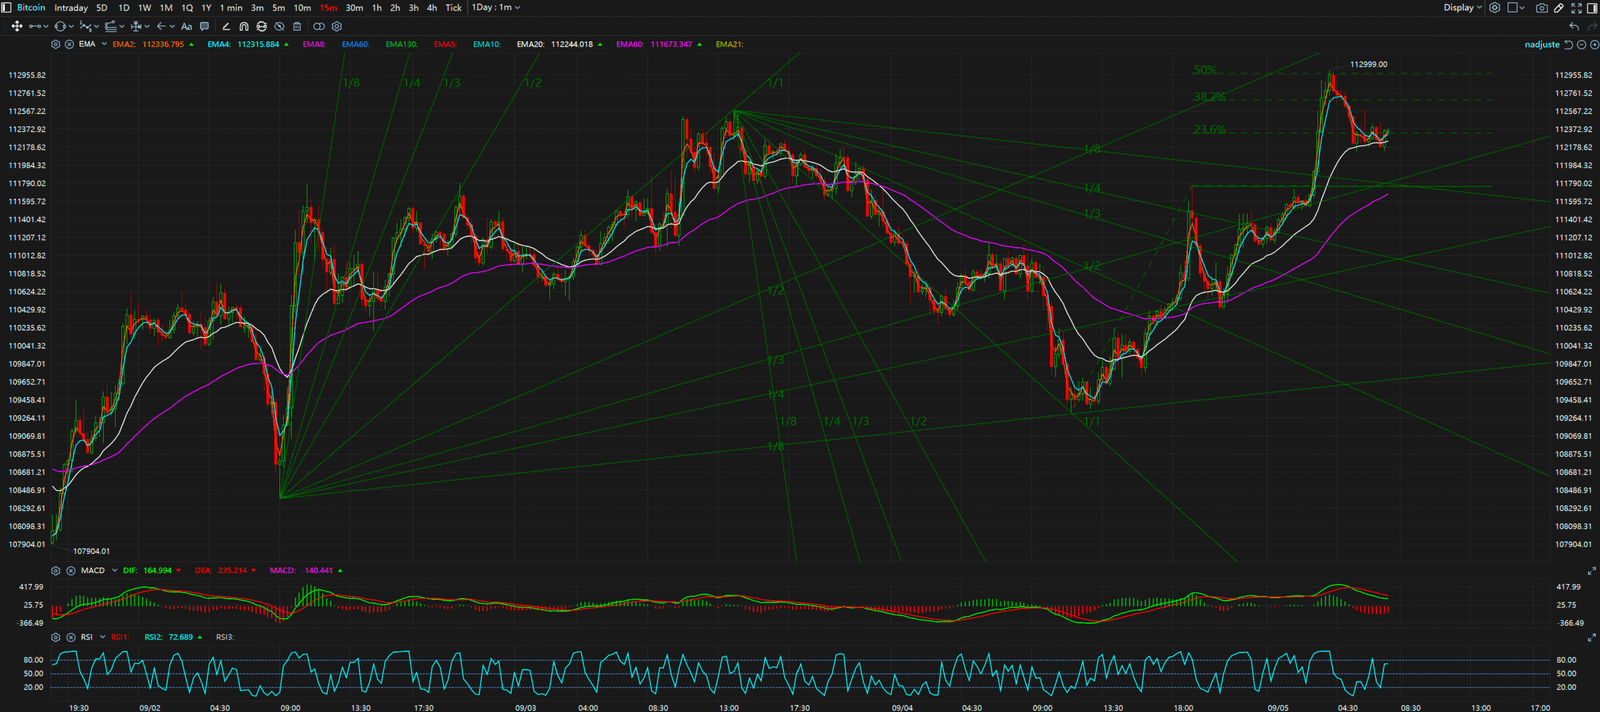
The Bull Case / The Obvious Story: The market narrative is currently dominated by Bitcoin’s strength. The primary cryptocurrency is maintaining a clear “higher highs, higher lows” market structure, demonstrating sustained bullish momentum. Breaking past previous resistance levels, it has established strong support around $110,000, leading many to believe a broader market breakout is imminent.
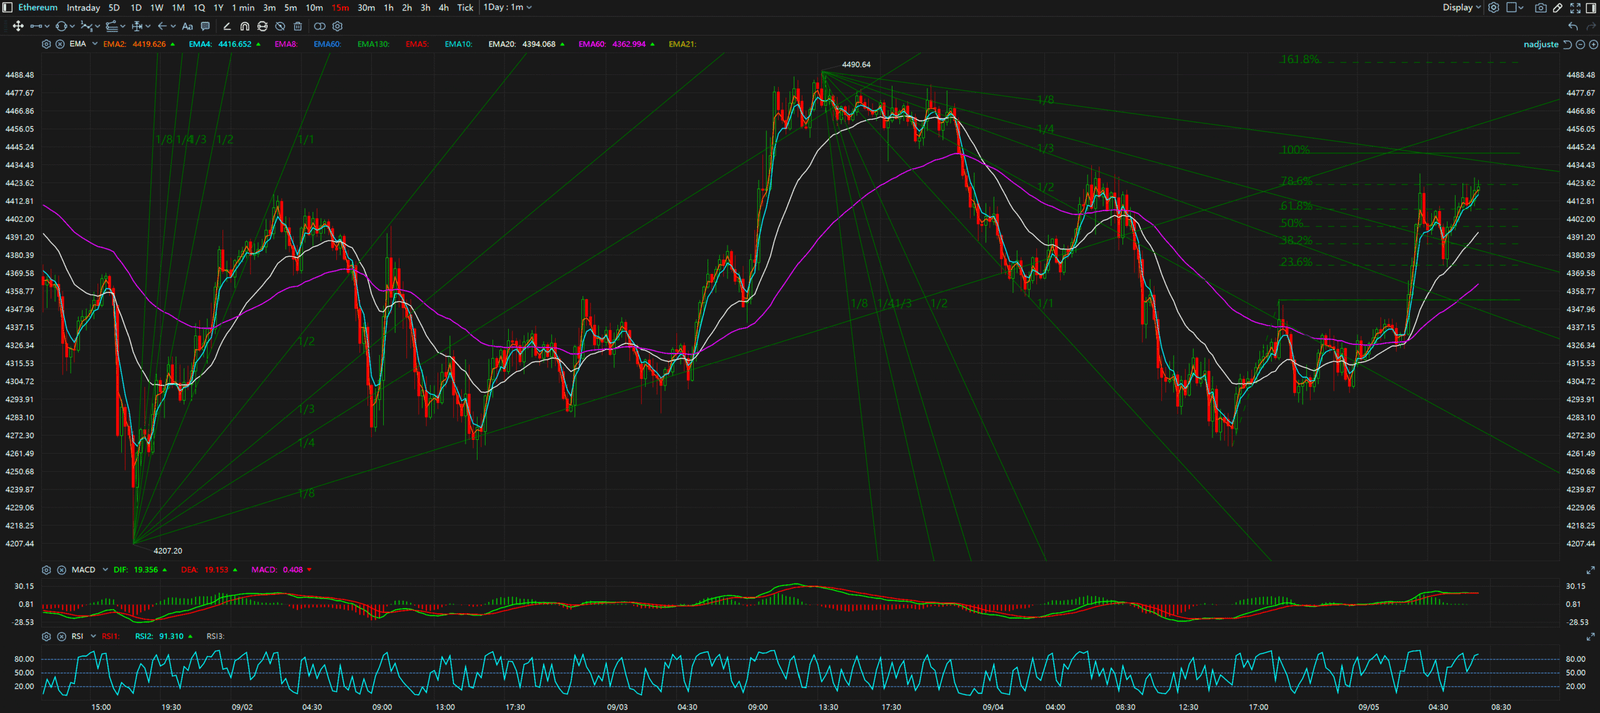
The Bear Case / The Hidden Signal: However, a closer look at the charts reveals a worrying counter-narrative. Ethereum, which typically moves in tandem with Bitcoin, has completely stalled. While Bitcoin printed a new high, ETH’s price remained stagnant, failing to show any significant upward momentum. This creates a clear “Bearish Divergence” between the two assets. This is a classic signal that the underlying strength of the market is weak, and the rally is being driven by a narrowing group of assets, not broad participation.
Synthesis & Implication: This conflict between Bitcoin’s ascent and Ethereum’s stagnation implies that the current market enthusiasm is fragile. It suggests that “smart money” may be consolidating into Bitcoin as a perceived safe haven, while conviction in the wider altcoin market, led by ETH, is waning. For traders, this indicates a high risk of a “bull trap,” where the market appears strong just before a potential sharp correction.


Key Takeaways
In summary, while Bitcoin’s price is bullish, the divergence from Ethereum is a significant red flag that should not be ignored. The key levels to watch are critical. For Bitcoin, the immediate resistance is the psychological $115,000 level, with support firmly at $110,000. For Ethereum, it must overcome resistance at $4,500 to invalidate this bearish signal, while a break below the $4,200 support level could trigger a wider market sell-off.
For continuous, real-time analysis of these developing market structures, visit www.chart-blitz.com.
True trading advantage comes from decoding these conflicting signals. To learn the professional-grade framework for seeing the market’s real intentions, explore our exclusive models on www.chart-blitz.com.
Sources:
Unlocking Technical Analysis: Power Moves with Diagrams
15–Minute Timeframe for Bitcoin
15–Minute Timeframe for Ethereum