The stock market is never obvious. It is designed to fool most of the people, most of the time.
Jesse Livermore – 1923
Bitcoin is firmly holding its ground above the critical $110,000 mark, a picture of stability that is capturing the market’s attention. On the surface, this consolidation appears bullish. However, a deeper look at the charts reveals a classic technical conflict. While Bitcoin’s structure still suggests a broader uptrend, major altcoins like Ethereum are showing initial signs of a trend reversal, including a textbook MACD bearish divergence. Is Bitcoin’s price action a healthy consolidation before the next leg up, or is the weakness in altcoins the first signal of a market-wide correction?
Top Stories at a Glance
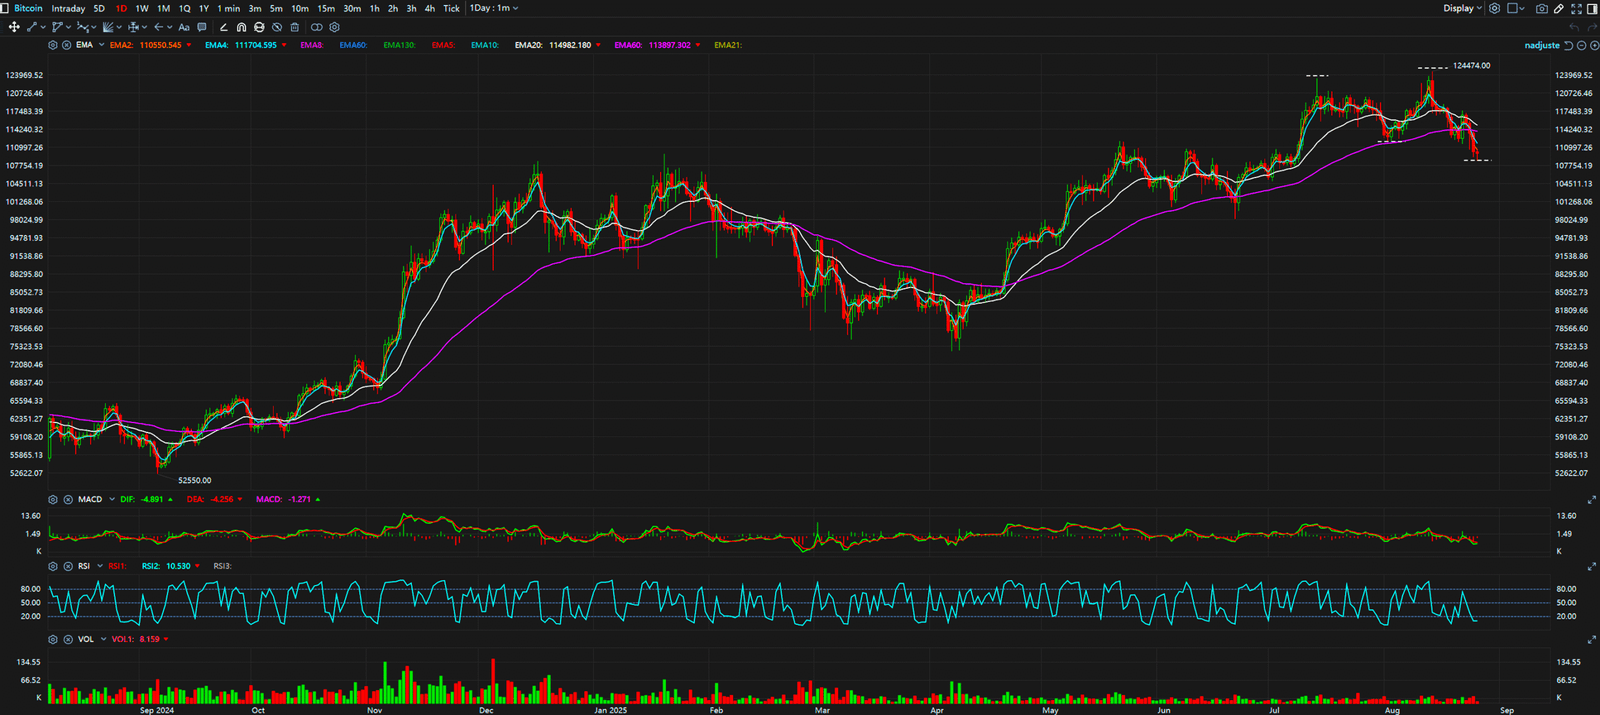
The Bull Case: A Textbook Uptrend in Consolidation From a purely structural perspective, Bitcoin’s dominant trend remains bullish. The chart clearly displays a pattern of higher highs and higher lows on the daily timeframe, the very definition of a healthy uptrend. The current price action is best described as a high-level consolidation or a potential “bull flag.” After a strong impulsive move up, the market is now moving sideways, building a support base above the $105,000 level. This is not a sign of weakness, but rather a typical sideways movement where the market digests gains before continuing the primary trend. As long as the price holds above the previous “higher low,” the bullish structure remains intact.
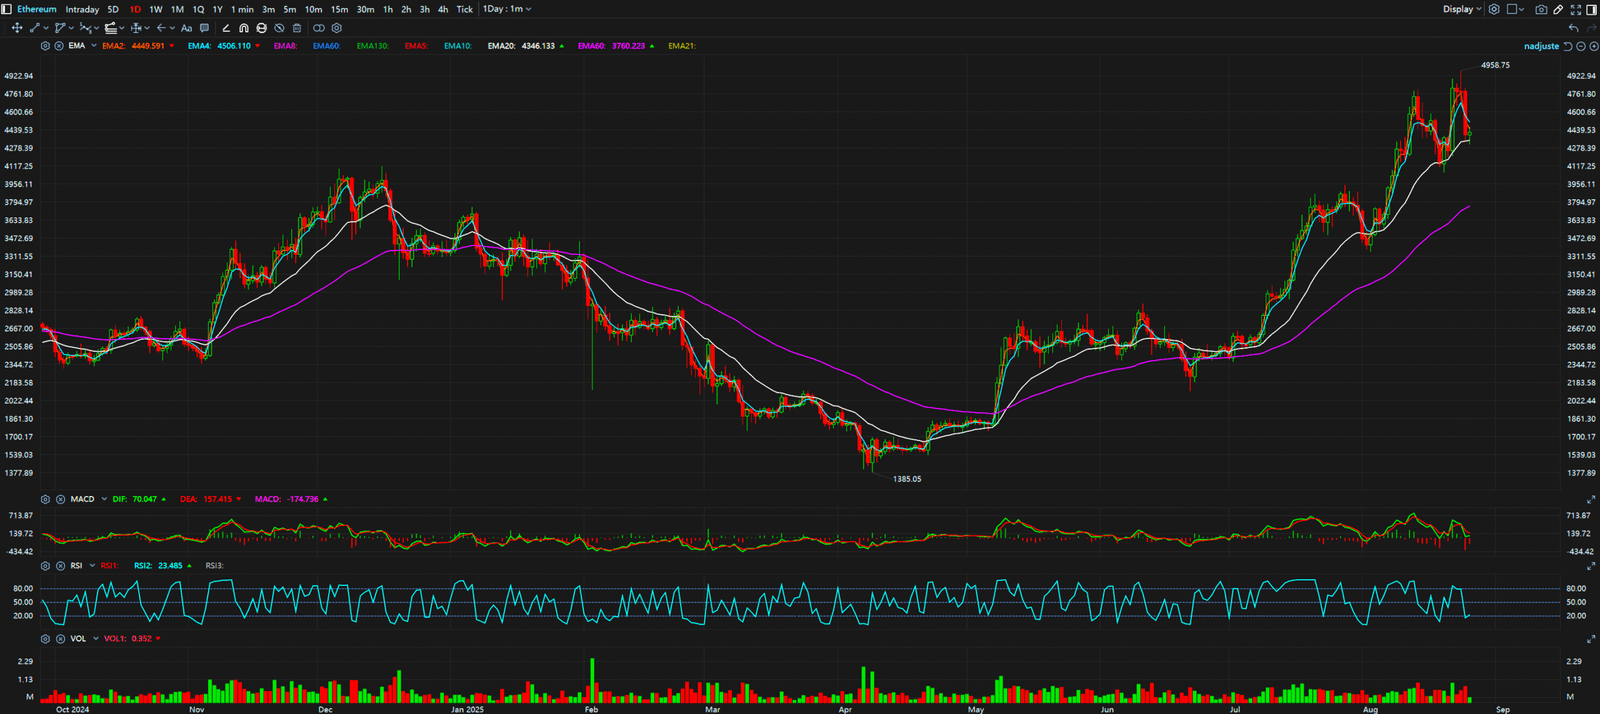
The Bear Case: Altcoins Signal MACD Bearish Divergence The bearish argument is more nuanced and is being telegraphed by the altcoin market. Ethereum’s chart provides a compelling case study. Prior to its recent 4-5% drop, ETH’s price pushed to a new local high. However, the MACD indicator failed to confirm this move, printing a lower high. This created a classic MACD bearish divergence, a powerful signal that upward momentum was fading. The subsequent price drop confirmed this signal and has now potentially initiated a new, short-term downtrend structure of lower highs and lower lows. This is a significant warning that speculative capital is rotating out of the market, a trend that could eventually impact Bitcoin.


Key Takeaways
The market is at a fascinating technical crossroads. Bitcoin’s chart shows a strong uptrend followed by healthy consolidation, while Ethereum’s chart warns of weakening momentum and a potential trend reversal via MACD divergence. The key price levels to watch for Bitcoin are the support zone around $105,000 (the line in the sand for the current bullish structure) and the resistance at $115,000. A decisive break below support would validate the bearish signals from the altcoin market. Conversely, a strong push through resistance would indicate that Bitcoin’s underlying trend strength is overpowering the altcoin weakness.
For continuous, real-time analysis of these developing market structures, visit www.chart-blitz.com.
True trading advantage comes from interpreting these conflicting technical signals. To learn how to apply a professional-grade analytical framework to decode the market’s real intentions, visit www.chart-blitz.com to explore our exclusive chart breakdowns and models.
Sources:
Unlocking Technical Analysis: Power Moves with Diagrams
Daily Timeframe for Bitcoin
Daily Timeframe for Ethereum