The speculator’s chief enemies are always boring from within. It is inseparable from human nature to hope and to fear
William Delbert Gann – 1949
Feeling the FOMO as friends share their crypto gains, but get a headache just looking at a price chart? You’re not alone. Today, we’re skipping the complex jargon. All you need to remember are two magic numbers that could help you catch Bitcoin’s (BTC) next big wave.
Analysis Benchmark Statement
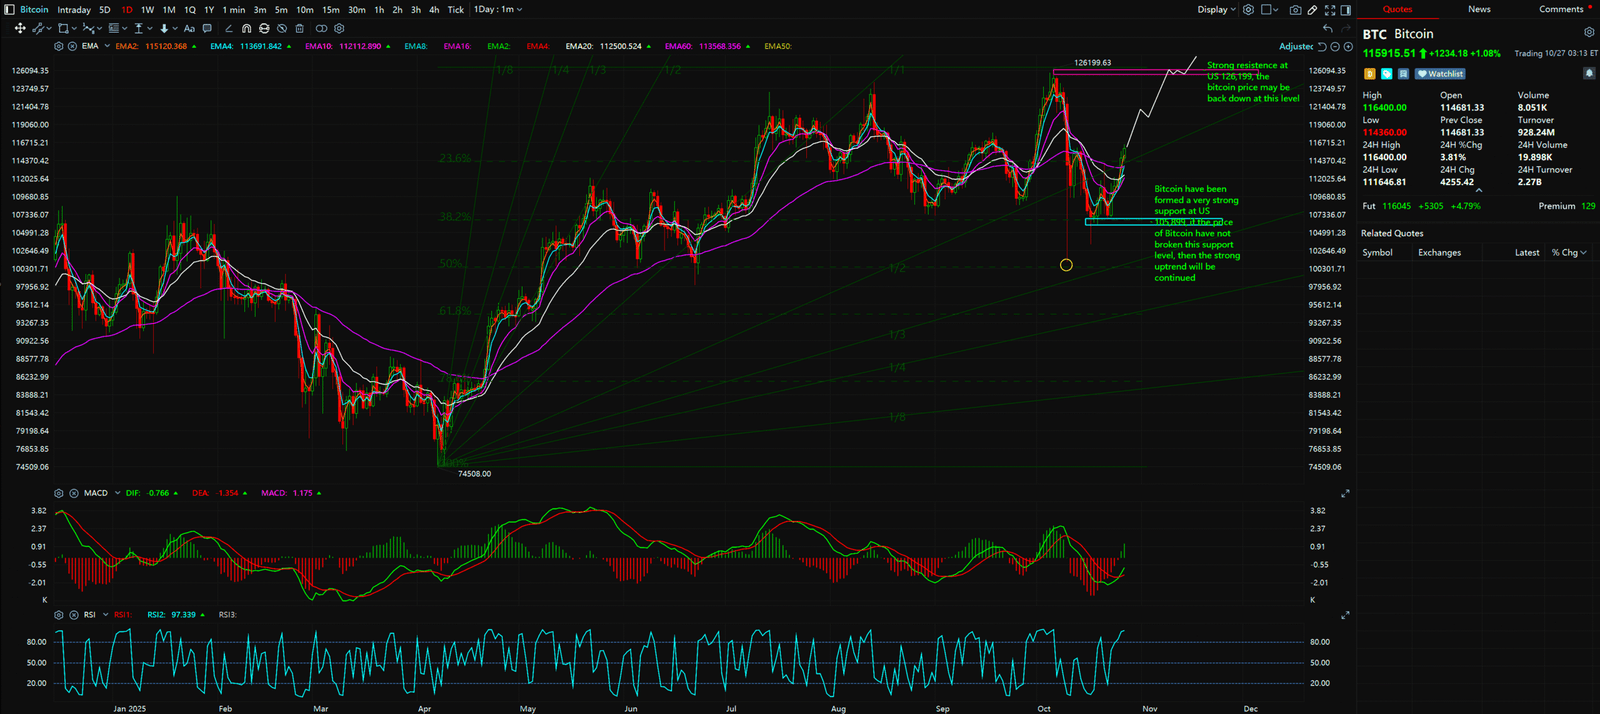
- All technical analysis below is based on a price snapshot locked in on October 27, 2025: BTC = $115,950 USD.
- This price snapshot provides a stable reference point for analysis. All support, resistance, and projected paths are relative to this benchmark. Market prices are highly volatile; readers should treat this report as an “analytical map,” not a real-time quote.
The Catalyst & Fundamental View (What You ‘re Hearing) You’ve likely seen the news: fuelled by optimism in the macroeconomic outlook, Bitcoin has surged past the $115,000 mark. The market is buzzing with talk of a new bull run. But this news only tells you what happened. Is it too late to jump in, or is an even bigger rally waiting for us? To answer that, we need to look at the real story on the chart.
Multi-Timeframe Technical Deep Dive (The Secret You Need to Know)
Forget the messy charts. You only need to know one “Rocket Launch Point” and one “Escape Hatch.”
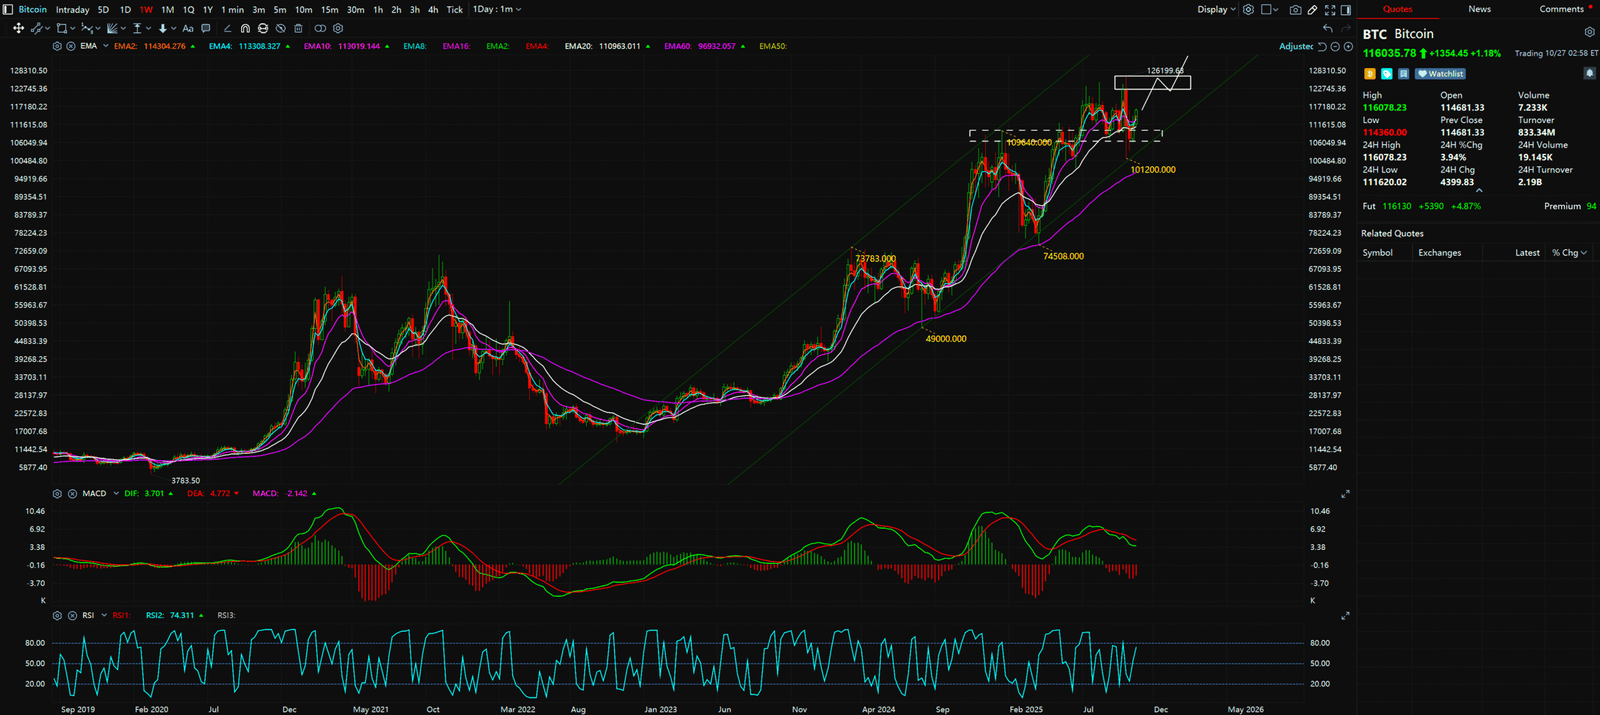
Imagine BTC’s current movement as a rocket preparing for takeoff. It has already fueled up (finding support around $101,200) and successfully ignited its engines (bouncing back to the current $115,950). But before the rocket can truly soar, it must pass one final “safety check.”
- 🚀 The Rocket Launch Point: $126,199
Why is this price critical? On the chart, this is the “ceiling” that has stopped previous rallies in their tracks. If BTC can decisively break through and “stay above” this level, it’s like the rocket clearing its final check and blasting off into orbit. Historically, such a breakout often triggers a powerful upward trend, with targets that could be much higher than you think.
- 🛡️ The Danger Escape Hatch: $105,899
For every launch point, there’s an “abort mission” signal. If BTC fails to break $126,199 and instead turns back down, falling through our “escape hatch” at $105,899, the game changes.
Why remember this price? This has been a crucial “floor” of support recently. If the price can’t even hold this level, it signals a problem with the rocket’s engines. The launch mission could be scrubbed, potentially leading to a period of decline. At that point, cutting losses might be the smartest move.
Synthesized Analysis & Unique Insight (Your Action Plan for Beginners)
So, what’s the move now?
At the current price of $115,950, we are in the “no-man’s-land” between the ceiling and the floor. The smartest move is to be patient, and set your alerts.
- Set Price Alerts: Go to your trading app and set two alerts: one at $126,199 (the potential liftoff signal) and one at $105,899 (the danger alarm).
- Wait for a Clear Signal: Don’t rush into a trade in this middle zone. Wait for the price to tell you where it wants to go.
- Plan for the Breakout: If the price successfully breaks $126,199, consider entering the market. But remember, breakouts are often followed by a few days of consolidation (sideways movement). Don’t get shaken out by small dips. Patience is key to riding the rocket’s full journey.


Key Takeaways
Summary / Key Price Levels:
The crypto market is full of opportunities, but also significant risks. Instead of chasing vague “insider tips,” it’s better to learn one or two key signals. Now you know BTC’s “rocket launch point” ($126,199) and its “escape hatch” ($105,899). The next step is to wait for the market to give a clear signal.
- Key Level to Watch (Defense): Is the price holding strong above the $105,899 “escape hatch”?
- Liftoff Signal (Offense): Wait for a decisive breakout and hold above the $126,199 “rocket launch point”
For continuous, real-time analysis of these developing market structures, visit www.chart-blitz.com.
Fundamental news tells you what happened. Technical analysis predicts what will happen. To master the professional framework that separates market signal from noise, explore our exclusive models at www.chart-blitz.com.
Sources:
Unlocking Technical Analysis: Power Moves with Diagrams !
Weekly Timeframe for Bitcoin (BTC)
Daily Timeframe for Bitcoin (BTC)