The speculator’s chief enemies are always boring from within. It is inseparable from human nature to hope and to fear
William Delbert Gann – 1949
“It’s pumping! Should I chase it?” “It’s dumping! Is this the bear market?”
If you’re a crypto newcomer, do these questions haunt your every trading day? Staring at the red and green electrocardiogram-like K-line charts, littered with indicators you don’t understand, can make investing feel like deciphering an ancient, forgotten language.
But what if I told you that, according to senior technical analysts, the current movement of BNB (Binance Coin) might be setting the stage for a critical “golden entry point” before its next potential rally? And what if the core logic to spot this opportunity doesn’t require you to master complex technical analysis, but simply to understand one simple concept: the “Powerful Trampoline.”
In the last 24 hours, the market went through a bloodbath, with over $1 billion liquidated, followed by a swift rebound. In this chaos, BNB’s price fell precisely near the key zone we’re about to discuss. This article will break down, in the simplest terms, why this crash might actually be an opportunity and the key price levels and “game plan” you need to watch. The goal here isn’t to tell you to rush into a trade, but to provide a professional yet easy-to-digest perspective, equipping you with more calm and strategy the next time you face market volatility.
【Analysis Benchmark Statement】
All technical analysis below is based on a price snapshot locked in on November 19, 2025: BNB = $935 USD.
This price snapshot provides a stable reference point for analysis. All support, resistance, and projected paths are relative to this benchmark. Market prices are highly volatile; readers should treat this report as an “analytical map,” not a real-time quote.
The News Hype (The Rear-view Mirror): Is the Crash “Noise” or a “Signal”?
In the past 24 hours, you were likely spooked by headlines screaming “Crypto Market Crash.” It’s true, the market saw massive liquidations and a price nosedive. For many novices, this is a signal to panic. But for professional analysts, these volatilities are the best moments to test the market’s structure. The questions we ask are: Where did the price stop? Where did the buying pressure emerge?
During this crash, BNB’s price briefly touched below $900 but was quickly bought back up. This action is like throwing a ball hard at the ground; our focus isn’t on how fast it falls, but at what level it bounces. That bounce point was right at the upper edge of our “Powerful Trampoline” zone. This isn’t a coincidence; it’s a manifestation of market structure. Therefore, for us, this news is a “signal” that confirms our analytical framework, not “noise” to be feared.
Multi-Timeframe Technical Deep Dive (The Predictive Lens): Deconstructing the “Powerful Trampoline”
To understand why we place so much importance on this “trampoline,” we need to combine different chart timeframes.
- The Core Concept: The Magic of Turning an Old Ceiling into a New Floor
In technical analysis, there’s a powerful concept called the “Support-Resistance Flip.” Sounds professional? Let’s use an analogy. Imagine you’re trying to jump, but a ceiling (Resistance level) keeps stopping you. This ceiling is a psychological price barrier. For example, earlier this year, BNB repeatedly failed to break above the ~$834 – $900 region, proving a strong “ceiling” of sellers existed.
But then one day, you finally break through the ceiling and land on the second floor! Now, the “ceiling” that was once above you becomes the “floor” (Support level) beneath your feet. This is the essence of a Support-Resistance Flip. A previously tough resistance zone, once decisively broken, has a high probability of turning into very strong support when the price pulls back to test it. It acts like a “Powerful Trampoline,” bouncing the price back up.
Right now, BNB is acting out this exact script. It has already broken through the old $900 ceiling, and is now pulling back to test this very “Powerful Trampoline” located between US$834 and US$900.
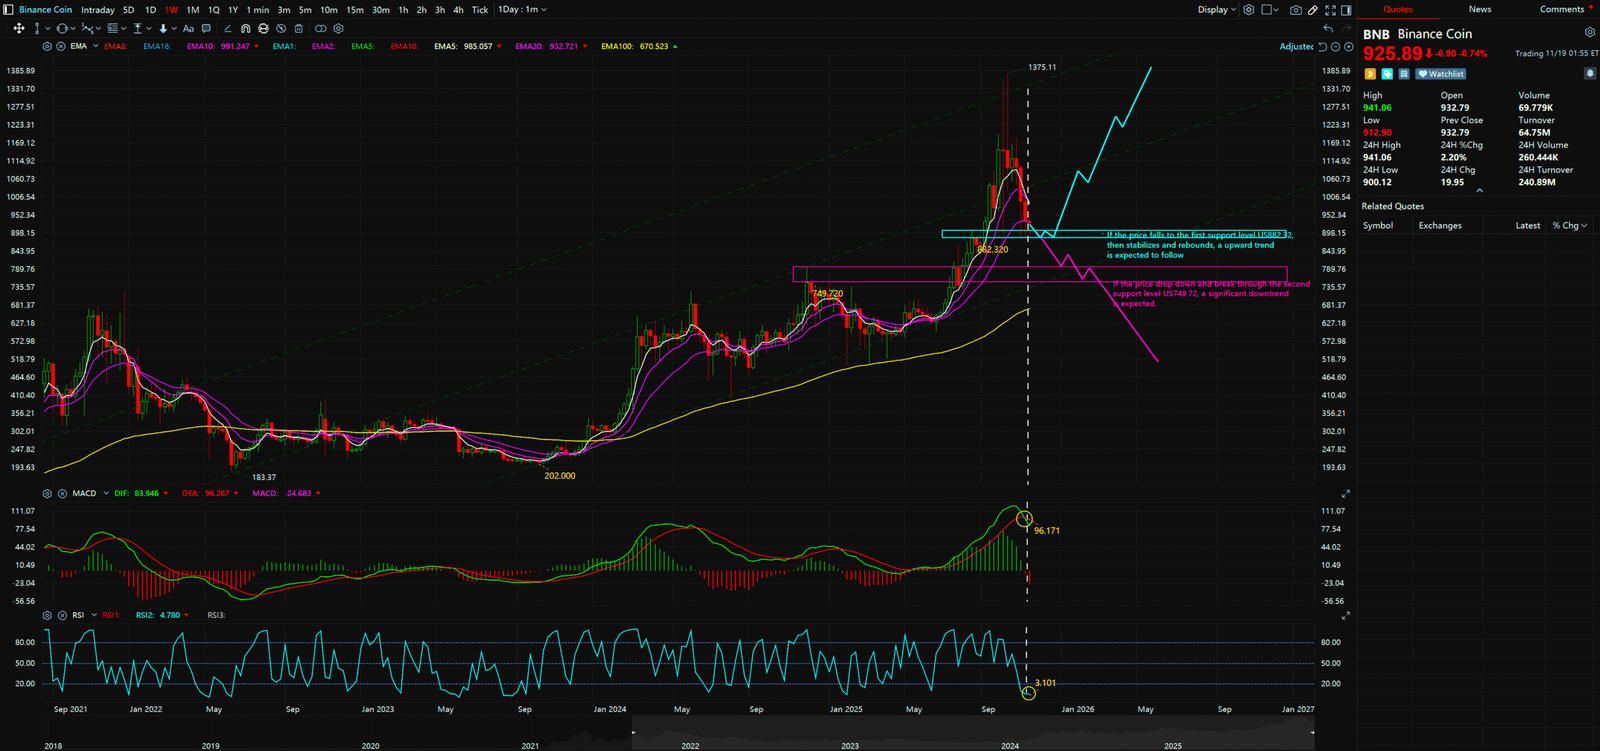
- The Big Picture (Weekly Chart): BNB is Still on the Uptrend Highway
Let’s zoom out to the weekly chart. It’s clear that BNB is in a pattern of “Higher Highs and Higher Lows.” This is the most classic characteristic of an uptrend, meaning its long-term health is bullish. The MACD indicator below, with both lines above the zero axis, confirms this long-term strength.
The current pullback is like a car on a highway temporarily pulling into a rest stop to refuel. It hasn’t exited the main highway of its uptrend. And our “Powerful Trampoline” (~$834 – $900) is the core area of this “rest stop.”
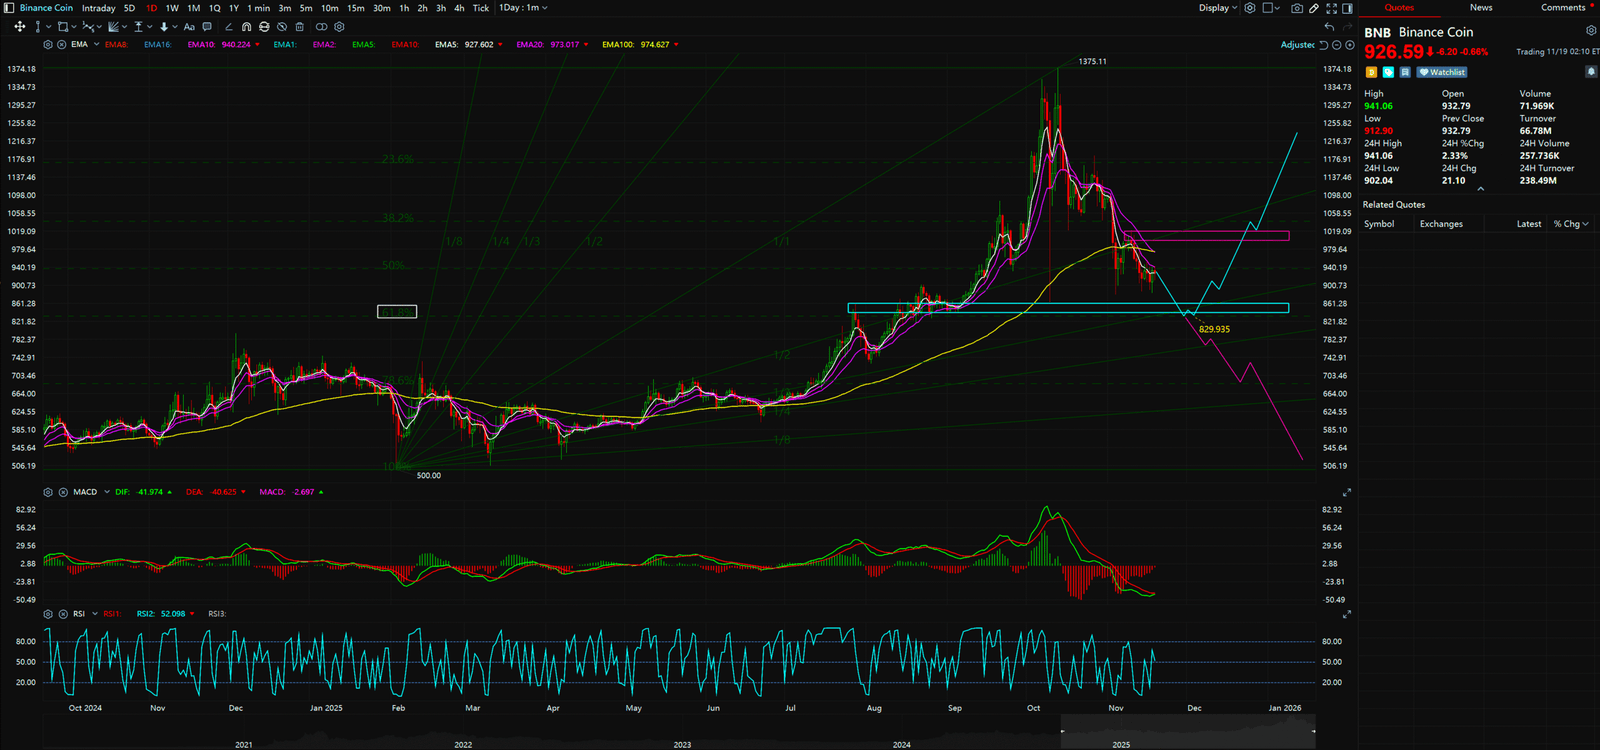
- The Finer Details (Daily Chart): Evidence of Weakening Downward Momentum
Using the daily chart as a magnifying glass, we see that while the price did drop significantly, the downward force may be nearing its end.
- A Healthy Retracement: BNB’s current pullback to around $935 is at the 50% Fibonacci retracement level of the prior up-move, a very common and healthy correction. The next, more critical “Powerful Trampoline” support zone lies near $834, corresponding to the more significant 61.8% retracement level.
- Slowing Decline: The “Gann Angle Lines” on the chart show the slope of the decline is flattening. This is like a car speeding downhill, but the driver has started to apply the brakes. The downward momentum is fading.
Synthesized Analysis & Unique Insight: The Game Plan & Risk Management
Alright, putting all this “cheat sheet” analysis together, we can lay out a clear game plan:
- Key Observation Zone: US$834 – US$900. This is our most important “Powerful Trampoline” zone.
- Bullish Scenario: The BNB price continues to correct downwards into the $834 – $900 range and then successfully holds firm (e.g., closes for several consecutive days above this level without further major drops). This would be an extremely strong signal that the short-term correction is over, and the mid-to-long-term uptrend is likely to resume. This is the potential “golden entry point.”
- Risk Management Scenario: We must have a “safety net.” Analysts emphasize that US$834.21 is a critical stop-loss reference point, our “trampoline’s safety net.” If the price breaks decisively below this level, it’s like the trampoline has a giant hole in it. The wise move might be to exit and observe. It’s far better than not having a stop-loss and being forced to “hold the bag” for years.


Key Takeaways
In summary, BNB is at a fascinating and pivotal crossroads. The long-term uptrend remains intact, and the short-term correction appears to be nearing its conclusion. Whether the price can successfully bounce off the “$834 – $900 Powerful Trampoline” will be key.
- Primary Support Zone (Powerful Trampoline): $834 – $900
- Critical Support Level (Safety Net): $834.21
- Initial Resistance: $1000 (Psychological Level)
- Major Resistance (Previous High): ~$1375
Our goal is not to provide a crystal ball, but to offer a clear, logical, and actionable framework by simplifying professional analysis.
Unlocking Technical Analysis: Power Moves with Diagrams !
Weekly Timeframe for (BNB) Binance Coin
Daily Timeframe for (BNB) Binance Coin
For continuous, real-time analysis of these developing market structures, visit www.chart-blitz.com.
Fundamental news tells you what happened. Technical analysis predicts what will happen. To master the professional framework that separates market signal from noise, explore our exclusive models at www.chart-blitz.com.
Sources:
- https://finance.yahoo.com/news/crypto-market-crash-deepens-1-071823038.html
- https://blockonomi.com/binance-coin-bnb-price-token-drops-below-910-as-market-volatility-continues/
- https://invezz.com/news/2025/11/19/crypto-market-rebounds-after-sharp-sell-off-bitcoin-at-91k/
【Disclaimer】 The content herein is for educational purposes and reflects the author’s personal opinion only; it is not investment advice. All financial investments, including cryptocurrencies, carry significant risk, and you could lose your entire capital. To support this site, this article may contain affiliate links. While we strive for accuracy, we cannot guarantee all information is complete or error-free. Please conduct your own research and be fully responsible for your own investment decisions.


