Alright, all you Market Surfers, Crypto Volatility Riders, and friends looking to master the market’s “elasticity”! Today, we’re dissecting an extremely common, critically important indicator that comes with a built-in “risk detector” – the legendary Bollinger Bands® (BB)! Think of them as drawing a “rubber band” around the price, helping you see if the price has stretched too far relative to recent volatility, and even signaling when the market might be about to “explode”!
What the heck are Bollinger Bands (BB)? How are they different from regular channels?
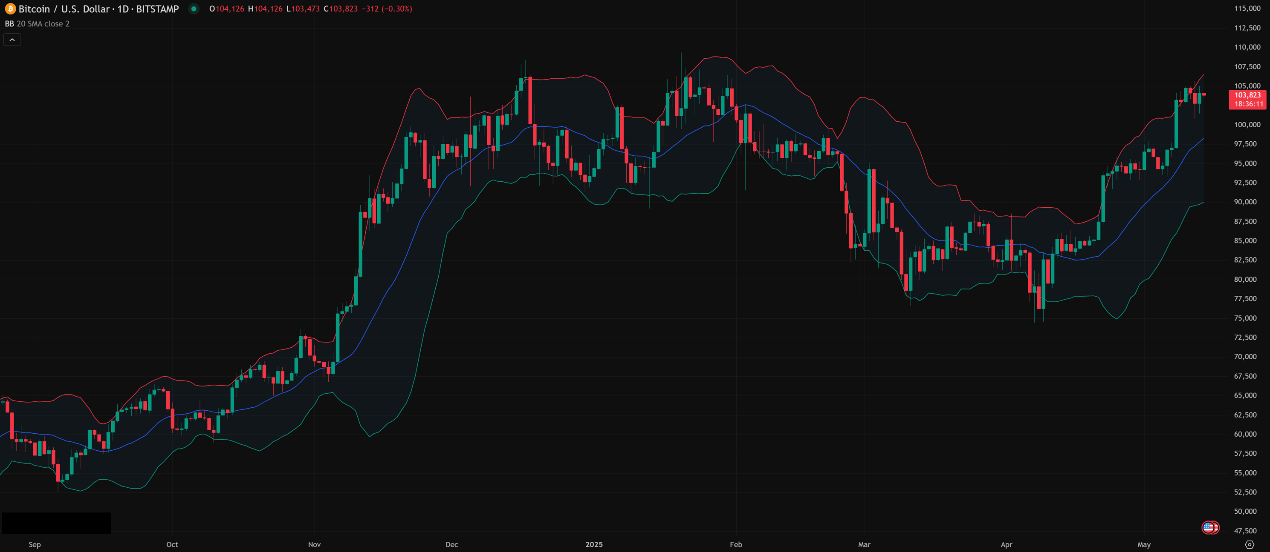
BB was invented by John Bollinger in the 1980s. It’s a Volatility Channel Indicator. Unlike channels with fixed distances, BB is a dynamic channel whose width automatically adjusts based on market volatility!
It consists of three lines:
- Middle Band: Usually an N-period Simple Moving Average (SMA), representing the recent average price level or trend.
- Upper Band: Middle Band + K times the N-period Standard Deviation.
- Lower Band: Middle Band – K times the N-period Standard Deviation.
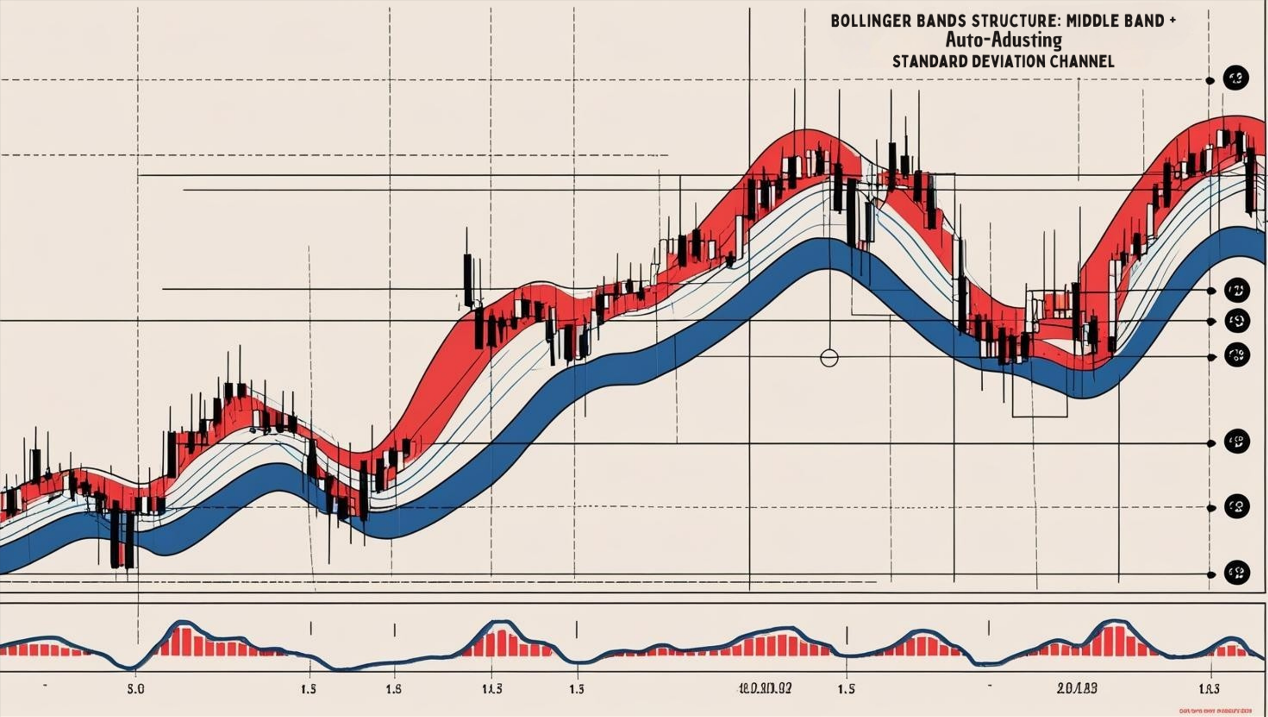
- Standard Deviation: A statistical measure of how dispersed data points (here, prices) are relative to their average (the middle band SMA). Higher volatility = larger standard deviation; lower volatility = smaller standard deviation.
- Core Feature: Auto-Adapting Width!
- When market volatility increases (big price swings) → Standard deviation increases → Upper/Lower bands widen.
- When market volatility decreases (price consolidates tightly) → Standard deviation decreases → Upper/Lower bands narrow (The Squeeze!).
「Bollinger Bands Structure: Middle Band + Auto-Adjusting Std Dev Channel」
The biggest difference from fixed-width channels (like some versions of Donchian or Keltner Channels) is that BB’s width is statistically derived from standard deviation, automatically adapting to market volatility.
BB’s Origin Story & Design: Measuring Relative Highs & Lows
John Bollinger developed BBs to create a tool that could tell traders whether the current price is relatively high or relatively low compared to its recent volatility range. He wasn’t trying to predict absolute tops or bottoms, but rather “relative value.”
- Design Philosophy:
- Price Stays Within Bands (Mostly): Based on statistics, if prices follow a normal distribution (though markets aren’t perfectly normal), most price action (approx. 95% when using 2 standard deviations) should occur within the Bollinger Bands.
- Touching Bands = Relative Extreme: When price touches the upper or lower band, it means the price is at a relatively extreme level compared to its recent volatility.
- Volatility Itself is Information: The changing width of the bands (expansion/contraction) reflects increases or decreases in market volatility, which is crucial information itself (especially the Squeeze).
- Core Calculation: SMA + Standard Deviation
- Calculate N-period SMA (Middle Band).
- Calculate N-period Standard Deviation of price.
- Upper Band = SMA + (K * Std Dev)
- Lower Band = SMA – (K * Std Dev)
「Bollinger Bands Logic: Relative Highs/Lows Based on Statistical Std Dev」
BB Basic Plays (Beginner’s Standard Plays):
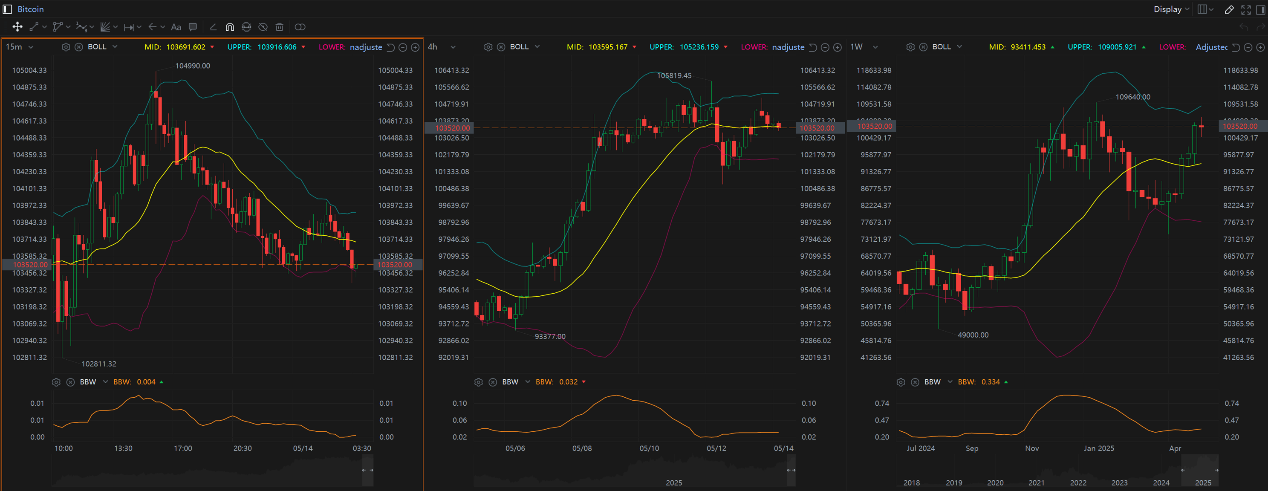
- As a Volatility Gauge:
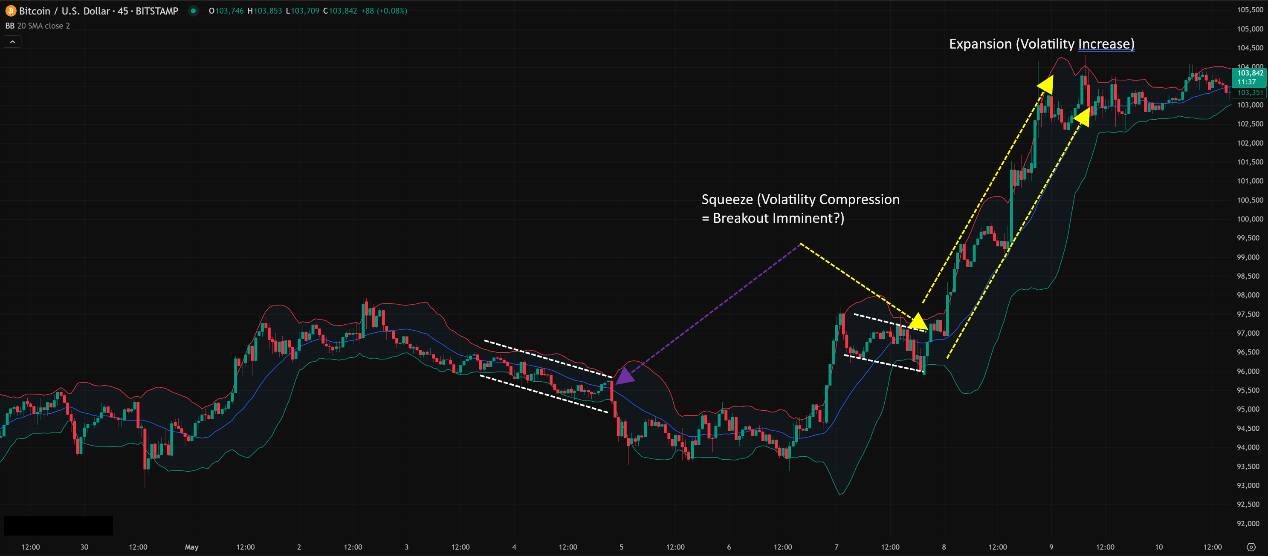
- Bollinger Band Squeeze: The distance between the upper and lower bands becomes very narrow. Indicates extremely low volatility, like the calm before a storm. Often foreshadows an impending significant price move (breakout) (direction unknown!). This is a critically important BB signal!
- Bands Expansion: Upper and lower bands rapidly move apart. Indicates a sharp increase in volatility, usually occurring after a Squeeze during a breakout move.
「BB Volatility Signals: Squeeze & Expansion」
2. Relative Highs/Lows / Potential OB/OS (CRITICAL to Combine with Trend!):
-
- Price touches Upper Band → Price is relatively high compared to recent volatility. Possibly Overbought?
- Price touches Lower Band → Price is relatively low compared to recent volatility. Possibly Oversold?
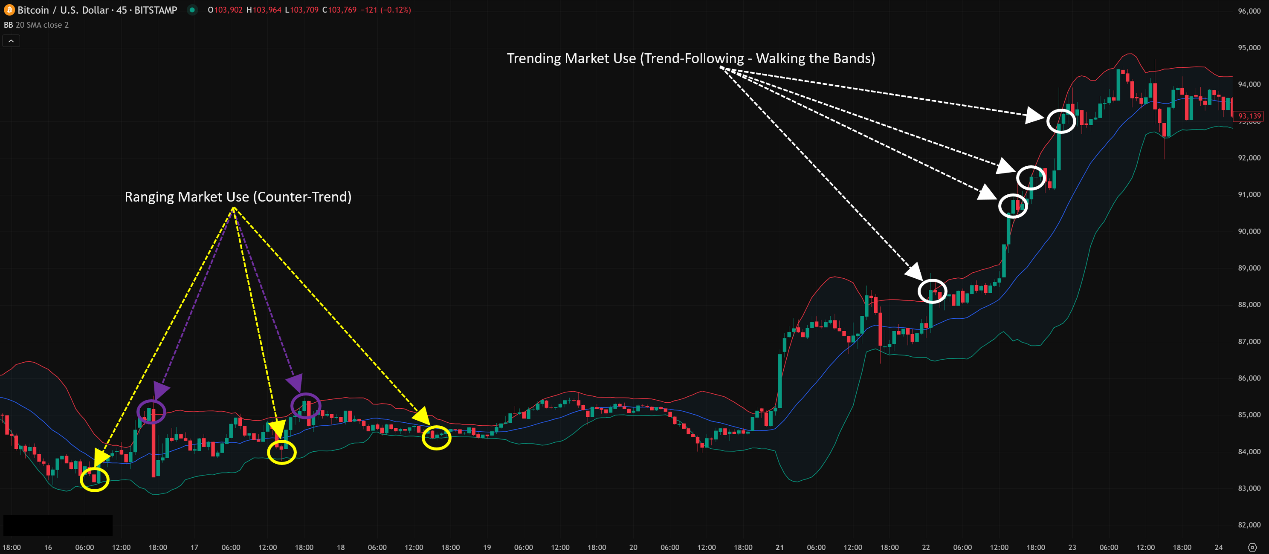
- SUPER MEGA IMPORTANT WARNING! (Biggest Beginner Mistake!): NEVER blindly short just because price touches the upper band, or buy just because it touches the lower band! In strong trending markets, price can “walk the bands” / “ride the bands” for extended periods, constantly touching or slightly exceeding the upper band while rising, or hugging the lower band while falling! In these cases, touching the band is actually a sign of trend continuation!
- Correct Usage:
- Ranging Market: Price hitting the upper band might be resistance; hitting the lower band might be support. Consider counter-trend scalps (with confirmation).
- Trending Market: Price “walking the bands” is a trend-following signal! Only when price significantly pulls away from the band (e.g., falls sharply from the upper band below the middle band in an uptrend) is it a warning the trend might be weakening.
「BB Relative High/Low: Range vs. Trend Usage is CRITICAL!」
BB Advanced Plays (Pro Level – Decoding Volatility’s Code):
- Bollinger Band Width Indicator (BBW):
- This is a separate indicator that directly measures the distance between the upper and lower bands (usually (Upper Band – Lower Band) / Middle Band).
- How to Use:
- BBW drops to historically low levels → Confirms an extreme Squeeze, setting up for potential breakout trades.
- BBW spikes upwards sharply from lows → Confirms a volatility explosion.
- BBW reaches historically high levels and starts turning down → Might suggest the recent move was exhaustive, volatility could contract.
- %B Indicator:
- This indicator measures the closing price’s relative position within the Bollinger Bands.
- %B = (Close – Lower Band) / (Upper Band – Lower Band)
- How to Use:
- %B > 1 → Price closed above the Upper Band (extreme strength, potentially overbought or strong trend continuation).
- %B < 0 → Price closed below the Lower Band (extreme weakness, potentially oversold or strong trend continuation).
- %B = 0.5 → Price closed at the Middle Band.
- %B > 0.8 → Relatively close to the upper band (overbought territory).
- %B < 0.2 → Relatively close to the lower band (oversold territory).
- You can look for divergence on the %B indicator! E.g., price makes a new high, but %B fails to reach a similar high – potential bearish divergence.
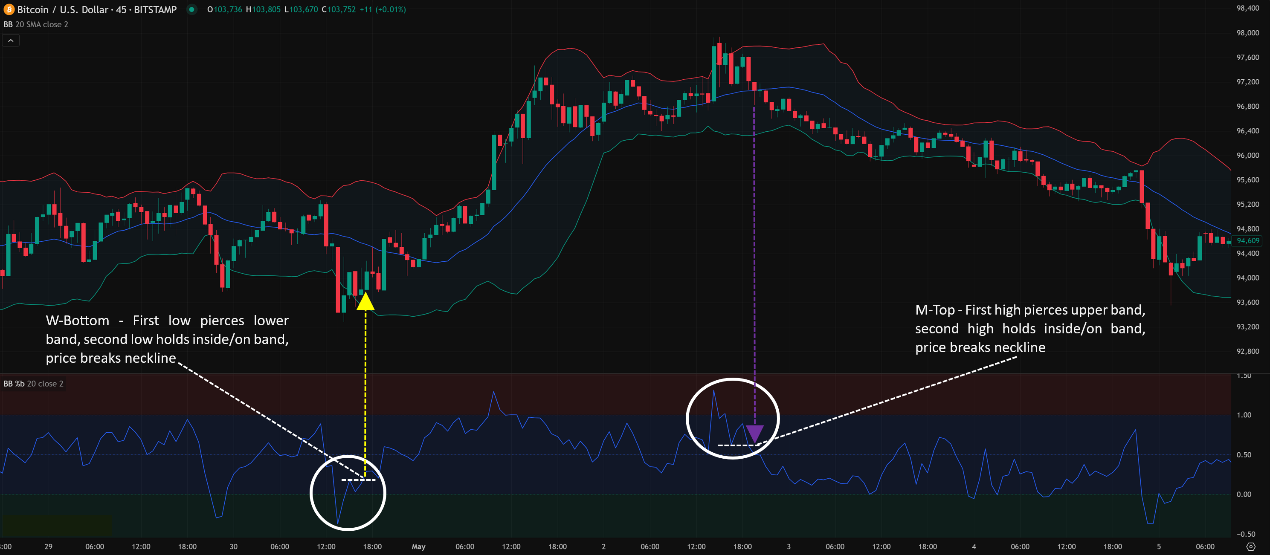
- W-Bottoms / M-Tops (Technique Taught by Bollinger Himself!):
- A pattern Bollinger often uses to identify potential reversals!
- W-Bottom (Bullish Reversal):
- Price drops below the lower band, forming the first low.
2. Price rallies back towards the middle band.
3. Price falls again, forming a second low, BUT this low must hold inside or on the lower band (doesn’t pierce below it again!).
4. If price then breaks above the high of the previous rally → Confirms the W-Bottom, stronger buy signal.
-
- M-Top (Bearish Reversal):
- Price rallies above the upper band, forming the first high.
2. Price pulls back towards the middle band.
3. Price rallies again, forming a second high, BUT this high must stay inside or on the upper band (doesn’t pierce above it again!).
4. If price then breaks below the low of the previous pullback → Confirms the M-Top, stronger sell signal.
-
- The Core Idea: The second peak/trough shows weakness relative to the bands!
「Bollinger Bands Advanced: W-Bottom & M-Top Reversals」
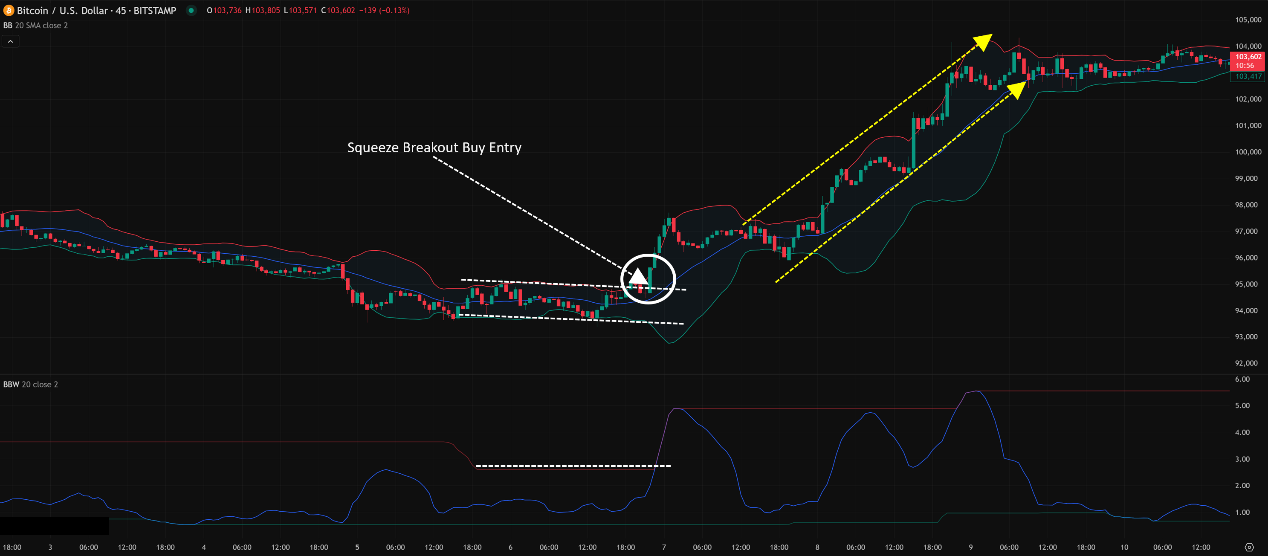
- Bollinger Band Squeeze Breakout Strategy (Classic):
- Identify a Squeeze (BBW at lows).
- Wait for price to break out above the upper band or below the lower band with volume confirmation.
- Trade in the direction of the breakout.
- Stop loss can be placed on the other side of the breakout candle or the middle band.
「Classic BB Strategy: Trading the Squeeze Breakout」
BB Parameter/Timeframe Breakdown (What Settings Offer Balance?):
Core Parameters: (N, K)
- N (SMA & Std Dev Period): Period for Middle Band SMA and Standard Deviation calculation. Default = 20.
- K (Std Dev Multiplier): Number of standard deviations for upper/lower bands. Default = 2.
- Standard Default: (20, 2)! Recommended by John Bollinger and used by the overwhelming majority of traders globally.
Parameter Settings Analysis & “Hottest” Combo Discussion:
- Why (20, 2) is the Gold Standard:
- Statistical Significance: 2 standard deviations encompass roughly 95% of price data (assuming normality). Touches represent relatively rare events.
- Balance: The 20-period SMA provides a stable mid-term trend reference, and the 2x StdDev width works well across most markets and timeframes.
- Effects of Changing Parameters:
- Shorter N (e.g., 10, 2):
- Effect: Middle band reacts faster, bands more sensitive to short-term volatility, more frequent squeezes/expansions.
- Use Case: Short-term traders wanting faster signals.
- Risk: More noise, more false squeezes/breakouts.
- Longer N (e.g., 50, 2):
- Effect: Middle band smoother, bands more stable, reflect longer-term trend and volatility.
- Use Case: Long-term traders identifying major consolidation zones (long squeezes) or trends.
- Smaller K (e.g., 20, 1 or 20, 1.5):
- Effect: Bands become narrower! Price touches them much more frequently.
- Use Case: Maybe for increasing signals (e.g., counter-trend in ranges) or getting earlier warnings of relative extremes.
- Risk: Floods of false signals! Will get killed in trends.
- Larger K (e.g., 20, 2.5 or 20, 3):
- Effect: Bands become wider! Price rarely touches them.
- Use Case: Filtering out almost all noise, only getting signals during extreme volatility events. Maybe for catching the start of very unusual moves.
- Risk: Very few signals, might miss most opportunities.
- Shorter N (e.g., 10, 2):
- Which “Unique” Combo is Hottest/Most Effective?
- None! The default (20, 2) IS the hottest and most effective! It has statistical backing and widespread use (consensus).
- Potential Minor Tweaks (Requires Extensive Testing!):
- High Volatility Crypto: Some might try (20, 2.1) or (20, 2.5) to slightly widen bands, reducing fakeouts from sharp wicks.
- Specific Short-Term Strategies: Might test (10, 1.9) or (10, 2) for faster reactions.
- Conclusion: Strongly advise beginners and most traders to start with and master the default (20, 2). Randomly changing parameters easily loses the statistical meaning of the bands.
「BB Parameters (20, 2): Stick with the Classic」
Timeframe Analysis:
- All Timeframes Applicable! BBs provide value across the spectrum.
- Usage Focus Changes with Timeframe:
- Ultra Short-Term (M1, M5, M15):
- Squeezes are still key! Short-term squeezes followed by breakouts offer good scalping opportunities.
- Touches of bands are very frequent; might mainly watch for extreme touches combined with reversal patterns.
- Intraday / Short Swing (H1, H4):
- Prime BB territory! Squeeze breakouts, Walking the Bands, range-bound S/R plays, W-Bottoms/M-Tops are all applicable strategies.
- Swing / Long-Term (Daily, Weekly):
- Signals are more reliable and significant! Daily/Weekly squeezes often precede major moves. Long-term Walking the Bands confirms strong trends. W-Bottoms/M-Tops are more trustworthy. Useful for gauging major trend volatility range.
- Ultra Short-Term (M1, M5, M15):
「BB Timeframes: Longer = More Macro/Reliable Signals」
Summary: Which Unique Parameter Combo + Timeframe is Hottest & Most Effective? How to Use It?
- Parameters: Default (20, 2)! It’s the classic for a reason.
- Timeframe: All usable, but Daily/Weekly/H4/H1 are most common and signals generally more reliable.
- Hottest / Most Effective Usage = Understand “Relativity” + Identify “State” + Combine with “Price Action”:
- Volatility is Core! Use the Squeeze to spot potential breakout points.
- Understand Relative High/Low! Touching bands isn’t an absolute signal; depends heavily on whether it’s a Trending Market (follow trend – Walking the Bands) or Ranging Market (consider counter-trend fades).
- Master W-Bottoms / M-Tops! These are reliable reversal patterns.
- Confirm! Volume (esp. on breakouts), Candlestick patterns (reversals near bands), S/R levels.
BB: Your Market “Elasticity” Gauge + “Pressure Cooker” Alarm
Bollinger Bands are an incredibly practical and widely used indicator. Their strengths:
- Dynamically Adapts to Volatility.
- Provides Relative High/Low Context.
- Squeeze Signals Potential Breakouts.
- W-Bottoms / M-Tops Offer Reliable Reversal Patterns.
But remember:
- Not a Directional Indicator Itself (look at middle band slope & price position).
- OB/OS Signals are Traps in Trends!
- Squeeze Breakout Direction is Unknown.
- Needs combination with other analysis.
「Bollinger Bands: The Market’s Elasticity & Pressure Gauge」
Mastering Bollinger Bands, especially understanding how they reflect volatility and how to interpret them in different market conditions, is an essential skill for practically every trader.
Next Steps:
- Add Bollinger Bands (use default 20, 2) to all your commonly used charts.
- Focus on observing Squeeze patterns and the subsequent breakout direction/magnitude.
- Watch for price “Walking the Bands” to feel trend strength.
- Practice identifying W-Bottoms and M-Tops.
- Combine BBs with your other favorite indicators or analysis methods.
- Backtest! Validate BB-based strategies (like Squeeze breakouts).
Hope you master market elasticity and pressure, catching every breakout opportunity! 💥📈📉✨