The speculator’s chief enemies are always boring from within. It is inseparable from human nature to hope and to fear
William Delbert Gann – 1949
Over the past 24 hours, a sudden, sharp drop in Bitcoin’s (BTC) price has ignited widespread market panic. As mainstream news and social media buzz with narratives of a “crash” and an impending “bear market,” a deeper question arises: Is this sell-off the end of the trend, or a calculated “shakeout” designed to push out weak hands? When fundamental news creates confusion, only technical charts can reveal the true intentions of major market players.
Analysis Benchmark Statement:
- All subsequent technical analysis is based on a price snapshot locked in on Oct 13, 2025, 14:02 (UTC+8): BTC = $114,950 USD.
- This price snapshot provides a stable reference point for analysis. All support, resistance, and projected paths are relative to this benchmark. Market prices are highly volatile; readers should treat this report as an “analytical map,” not a real-time quote.
The Catalyst & Fundamental View (The Rear-view Mirror): The recent market fear was largely fueled by macroeconomic news. Media reports pointed to a new tariff policy statement from the US, suggesting it dampened sentiment for risk assets and led to a broad sell-off, including in cryptocurrencies. Superficially, this is a plausible explanation that successfully created “background noise,” prompting many retail investors to exit in fear. However, such rearview-mirror interpretations often miss the market’s intrinsic structural forces.
The Predictive Lens: A Multi-Timeframe Technical Deep Dive
Multi-Timeframe Technical Deep Dive (The Predictive Lens) To see the full picture, we must tune out the noise from the news and focus on the clues provided by the charts themselves.
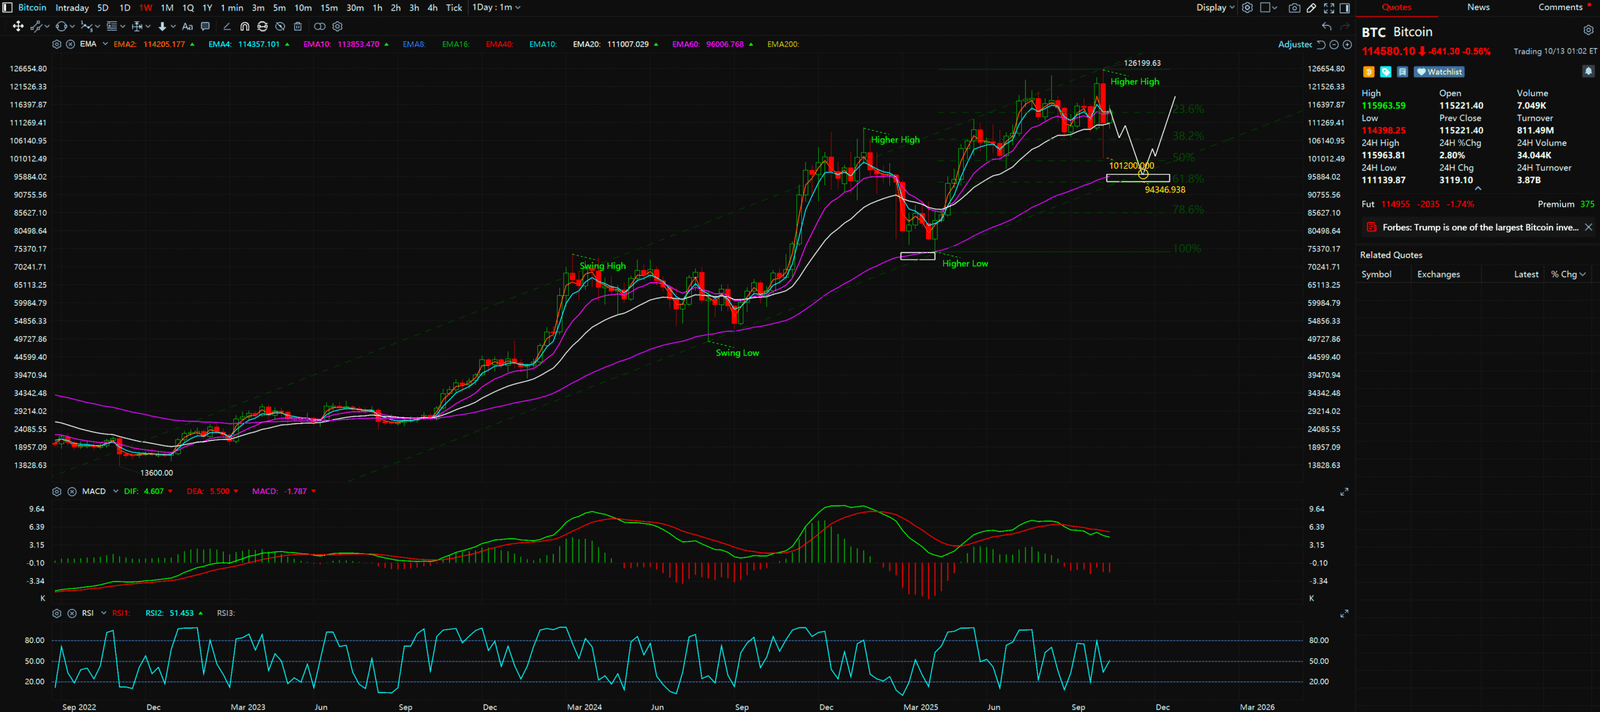
- The Macro Blueprint (Weekly Chart): From the user-provided weekly chart, it’s clear that BTC is operating within a very stable “Uptrend Highway” (an ascending channel). This structure, formed by a series of Higher Lows and Higher Highs, is the most classic and healthy pattern of a bull market. Despite the recent sharp decline, the price remains within the bounds of this macro uptrend.
- The Key Defense Line (Weekly Chart): The lower boundary of this “highway” is the core lifeline to watch. Based on the chart structure, this support zone is located at approximately $94,346 USD. As long as the price holds above this level, the overall bull market structure remains intact, and the recent drop can only be classified as a sharp correction, not a trend reversal.
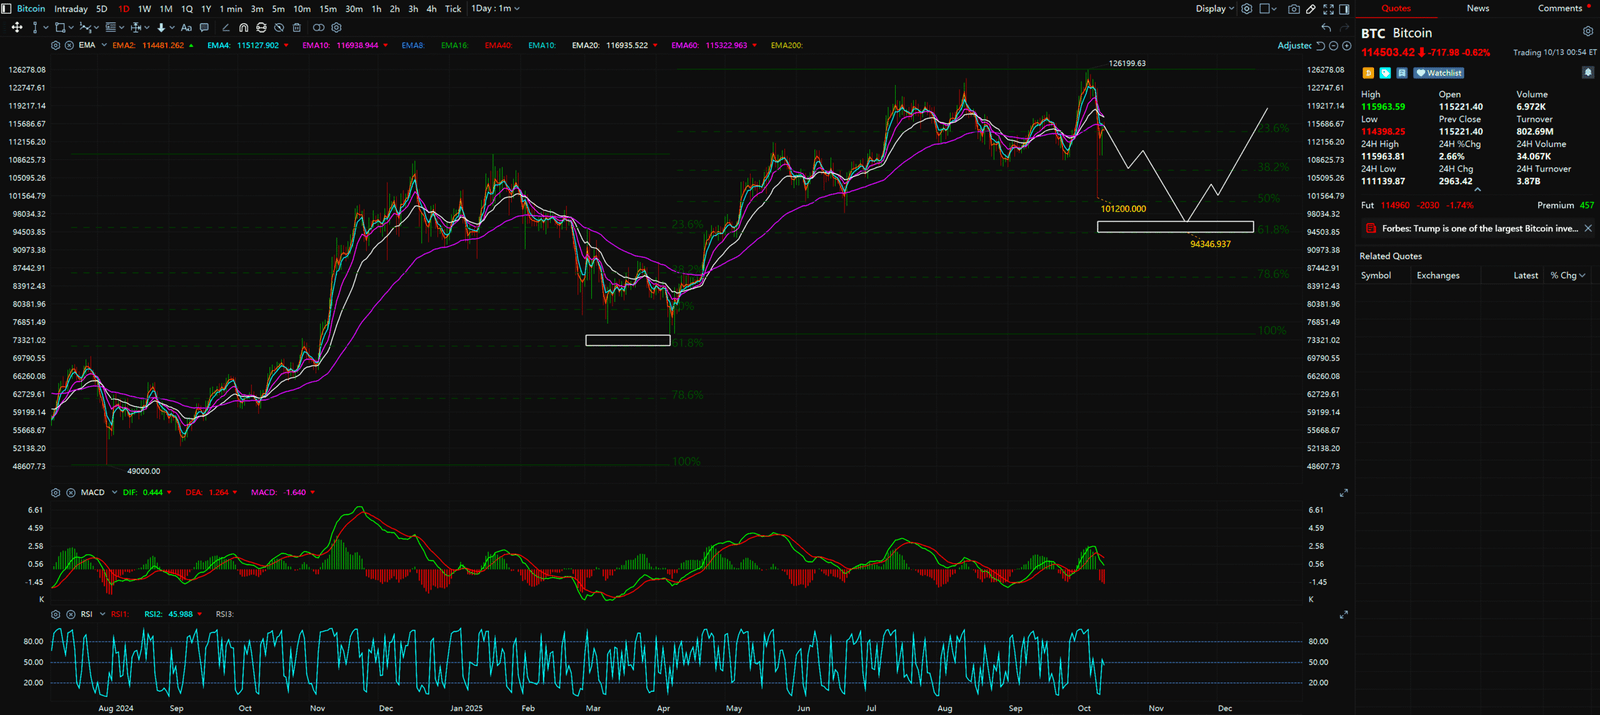
- The Tactical Map (Daily Chart): Switching to a shorter timeframe, BTC daily chart shows that after the panic sell-off, the price is attempting to find support at lower levels, with signs of a potential “V-shaped reversal” brewing. This is often a signal of the market quickly reclaiming ground after clearing out excess leverage and fear.
- Deeper Indicators (MACD): Corroborating this view, the MACD indicator on the weekly chart, despite pulling back due to the recent drop, remains firmly above the zero-axis. This indicates that long-term bullish momentum is still present and has not entered bear market territory.
Synthesis Analysis & Unique Insight
When news (fundamentals) and charts (technicals) diverge, smart investors choose to trust the charts. The current situation is a classic example: the news is creating panic, while the chart structure shows the bull market’s foundation is unshaken. This divergence is often the favorite playground for “Smart Money.” They can use the news-driven panic to accumulate assets at a lower price (e.g., near the channel’s lower bound around $94,346 USD) from retail investors who are selling in fear. Therefore, this seemingly terrifying drop is likely a healthy market correction and possibly a necessary setup for the next leg up towards price targets like $126,199 USD and beyond.


Key Takeaways
Summary / Key Price Levels:
- Core Support (Bull/Bear Line): $94,346 USD
- Short-term Resistance: Needs to reclaim the $115,000 – $120,000 USD zone.
- Long-term Targets: $126,199 USD and higher.
For continuous, real-time analysis of these developing market structures, visit www.chart-blitz.com.
Fundamental news tells you what happened. Technical analysis predicts what will happen. To master the professional framework that separates market signal from noise, explore our exclusive models at www.chart-blitz.com.
Sources:
- Cryptocurrency price today October 13: Bitcoin dips below $116,000 as top coins see bloodbath
- Crypto’s $200 billion crash: Can Bitcoin hope to recover?
- Bitcoin eyes $114K liquidity grab as traders bet on BTC price rebound
Unlocking Technical Analysis: Power Moves with Diagrams !
Monthly Timeframe for Bitcoin (BTC)
Daily Timeframe for Bitcoin (BTC)