The speculator’s chief enemies are always boring from within. It is inseparable from human nature to hope and to fear
William Delbert Gann – 1949
Scrolling through your social media, are you getting dizzy from Bitcoin’s (BTC) charts again? It goes up, you don’t know why; it goes down, you don’t know when to panic. Don’t worry. Today, we’re ditching the jargon. Using one simple analogy, we’ll explain why investors worldwide are getting excited right now and why the ~$101,200 level was so critical.
Analysis Benchmark Statement:
- All technical analysis below is based on a price snapshot locked in on October 20, 2025, at 14:34 (UTC+8): BTC = $110,500 USD.
- This price snapshot provides a stable reference for analysis. All support, resistance, and projected paths are relative to this benchmark. Market prices are volatile; please treat this report as an “analytical map,” not a real-time quote.
The Catalyst vs. The Real Story (Background Noise): You’ve probably seen the headlines: “BTC Recovers to $110K,” with market sentiment turning positive. This news explains why BTC is back in the spotlight, but it doesn’t tell you why the price bounced where it did or what comes next. That’s what the chart is for.
Multi-Timeframe Technical Deep Dive (The “Bull Market Runway” Theory): You don’t need to be a chart guru, just know this “Bull Market Runway.”
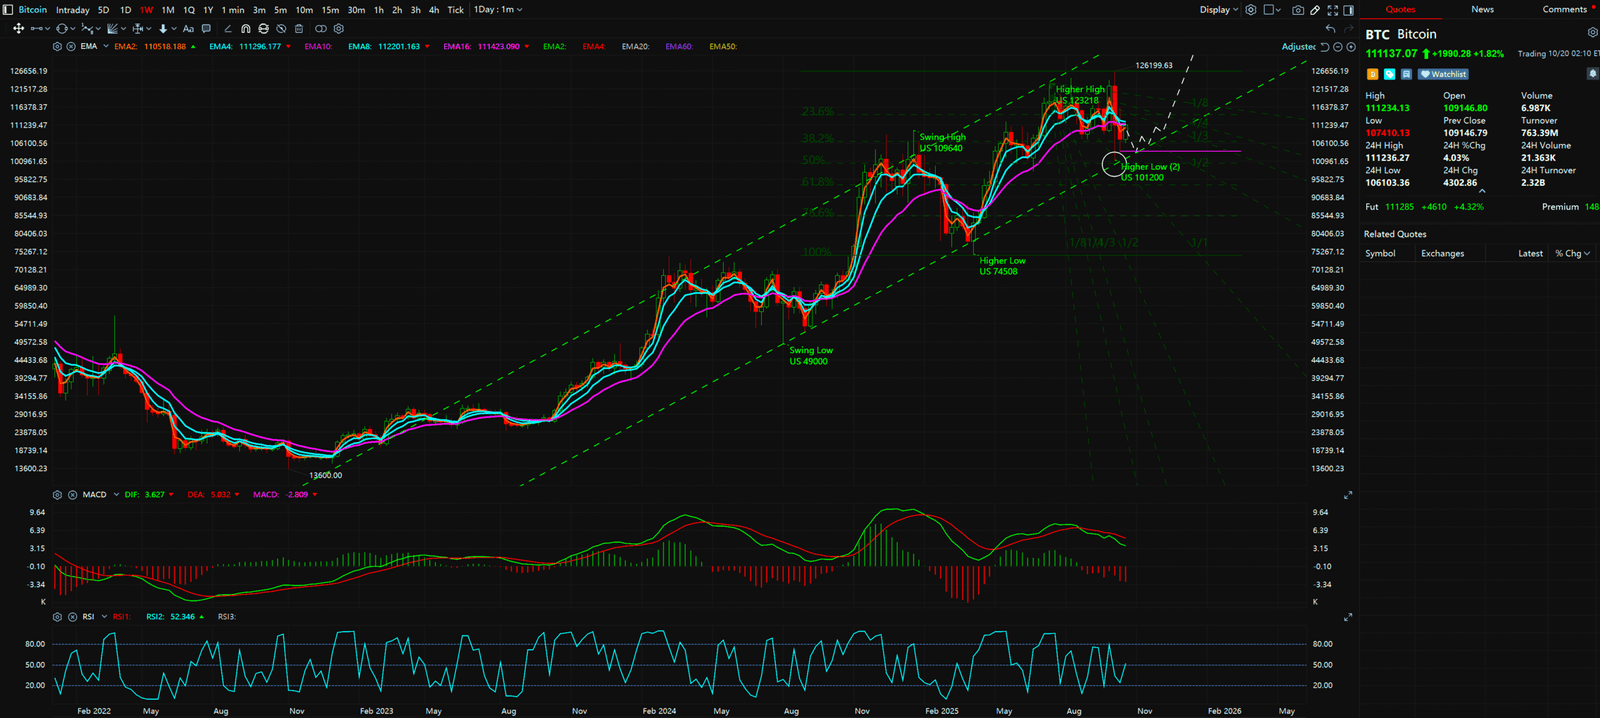
Imagine this: since late 2024, Bitcoin has been traveling on an upward-sloping “super runway.”
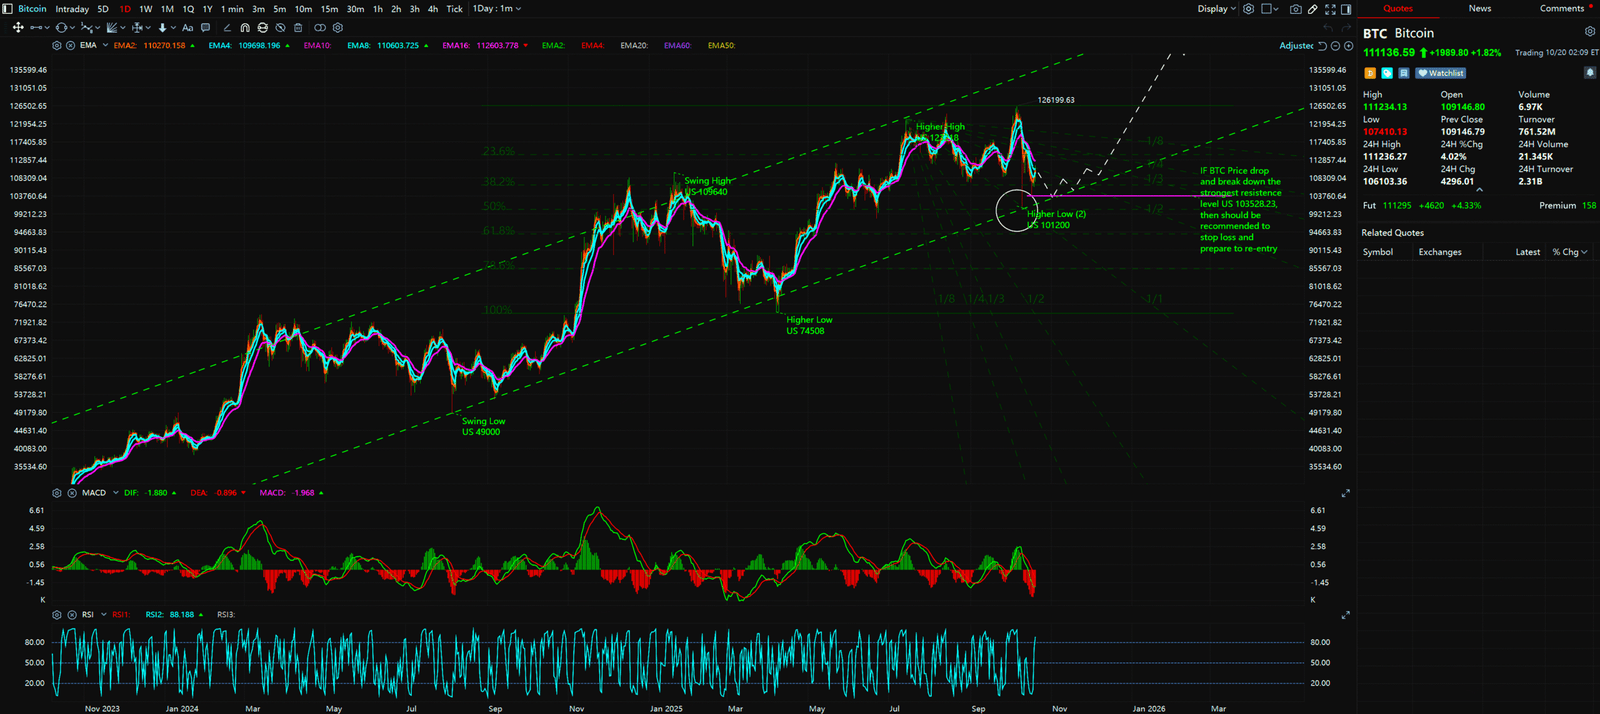
- Top of the Runway (~$123,200): This is where the plane might hit some turbulence and needs to pull back slightly.
- Bottom of the Runway (~$101,200): This is the plane’s “safety line.” As long as the price doesn’t crash through this floor, we are still on the bull market flight.
Last week, BTC suddenly plunged from its highs, causing many newcomers to panic-sell. But if you had the “runway” concept in mind, you’d have noticed that the price fell exactly to the bottom of the runway (around $101,200), stopped, and then bounced back aggressively.
In the eyes of professional investors, this wasn’t a disaster; it was a “health check” or an “in-flight refueling.” It tested the strength of the runway’s foundation, and the result was: it’s incredibly solid. This signals that buying pressure in the market remains strong, ready for the next push-off.
Synthesized Analysis & Unique Insight (So, What’s the “Takeoff Signal”?):
Alright, the plane is still on the runway. So when does it accelerate again? The answer lies in breaking through the immediate resistance level at $111,043.
- The Bullish Case: If BTC successfully breaks and holds above $111,043, this is a powerful “confirmation signal.” It suggests the correction is likely over, the engines are restarting, and the next stop could be challenging the top of the runway, or even a “moon shot” to new highs.
- The Bearish Case: Conversely, if BTC falls again and breaks below the entire runway (i.e., under $101,200), this is a “mission abort” danger signal! It means the engine has failed and the plane is veering off the runway. At that point, your first priority should be to consider cutting losses.


Key Takeaways
Summary / Key Price Levels: Stop letting complex charts intimidate you. For now, all you need to remember are these three points:
- Core Support (Runway Floor): $101,200
- Key Resistance (Takeoff Signal): $111,043
- Upper Target (Runway Top): $123,200
For continuous, real-time analysis of these developing market structures, visit www.chart-blitz.com.
Fundamental news tells you what happened. Technical analysis predicts what will happen. To master the professional framework that separates market signal from noise, explore our exclusive models at www.chart-blitz.com.
Sources:
- https://www.msn.com/en-in/technology/cryptocurrencies/bitcoin-trades-at-110k-ethereum-at-4-000-crypto-market-recovers-from-recent-crash/ar-AA1ONrjW
- https://coinmarketcap.com/currencies/bitcoin/
- https://www.coingecko.com/en/coins/bitcoin
Unlocking Technical Analysis: Power Moves with Diagrams !
Monthly Timeframe for Bitcoin (BTC)
Daily Timeframe for Bitcoin (BTC)