When you make a trade, you should have a clear target of where you expect to get out
William Delbert Gann – 1949
🌪️ Retail Panics While Whales Orchestrate Behind the Headlines
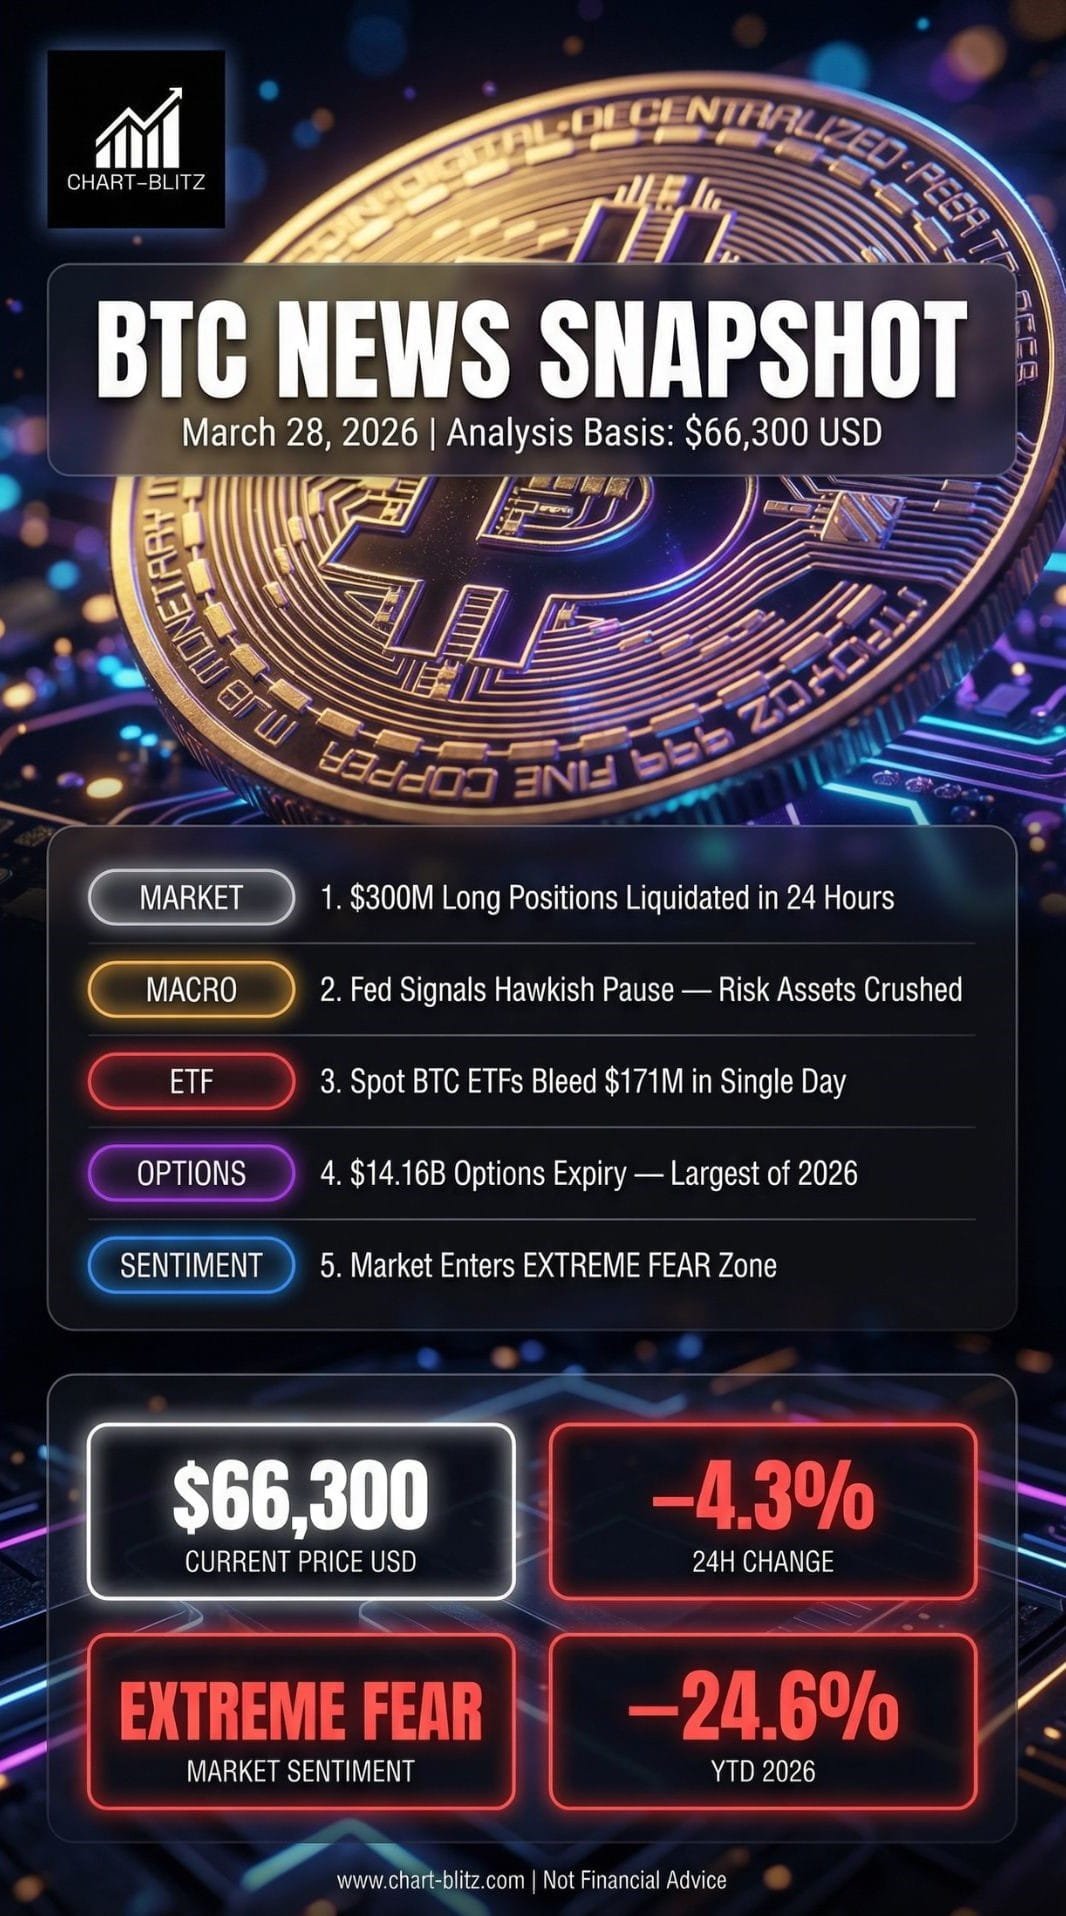
Over the past 24 hours, the crypto market has been an absolute bloodbath. If you’ve been following the major financial headlines, you’ve likely been bombarded by a relentless wave of panic-inducing news. First, a staggering $1.416 billion worth of Bitcoin options expired on Deribit. This massive options delivery event—the largest of the year—acted like a financial bombshell, instantly triggering a cascade of liquidations that wiped out over $300 million in long positions. Accompanying this carnage, spot Bitcoin ETFs recorded their largest single-day net outflow in three weeks, hemorrhaging $171 million. Add to that the Federal Reserve signaling a “hawkish pause” and escalating geopolitical tensions in the Middle East, and market sentiment plummeted from greed straight into the freezing depths of “Extreme Fear.”
For many retail investors, the immediate knee-jerk reaction is panic selling or blindly attempting to catch a falling knife at perceived “lows.” But as someone who spent 20 years surviving and thriving in traditional bank trading rooms, I must reveal a brutal truth: News is often just a smokescreen deployed by institutional whales, perfectly timed with chart patterns to manufacture “Exit Liquidity.”
During those years in the bank trading room, whenever a major news event hit the market, the seasoned traders would first open their charts—not the Bloomberg terminal’s news feed. Because we understood a fundamental truth: the market’s trajectory is often “spoiled” by the charts before the news even breaks. This “charts first, news confirms” mindset is the most fundamental information asymmetry between institutional traders and retail investors. While retail traders were hyperventilating over ETF outflows, true professional traders had already spotted the warning signs on the technical charts weeks ago.
Fundamental news might provide the “excuse” and the “subject of analysis,” but only rigorous technical analysis can accurately predict the “timing” and the “manner” of future market movements. Long before the market was intoxicated by the euphoria of breaking all-time highs, critical formations and technical indicators on the charts were already flashing red. Today, we are going to strip away the facade of the news. Using bank-grade technical analysis, we will meticulously dissect the true trajectory of BTC from the Weekly down to the 4-Hour chart, to determine whether this plunge is an opportunity to buy the dip or the beginning of a much deeper abyss.
【📊Analysis Baseline Statement】
All technical analyses below are based on a price snapshot locked at 18:00 (HKT) on March 28, 2026: BTC = 66,300 USD. Please treat this report as an “analytical map” rather than a real-time price feed.

📈 Weekly Chart: The Macro Perspective and the Brutal Test of Elliott Wave
Weekly Timeframe for BTC (Bitcoin)
In any professional trading system, the Weekly Chart is the absolute core of our macro trend judgment. Retail traders love the adrenaline rush of staring at the 15-minute chart, but institutions and market makers orchestrate their grand strategies on the weekly timeframe.
1. The Collapse of Trend Structure: Lower Highs and Lower Lows
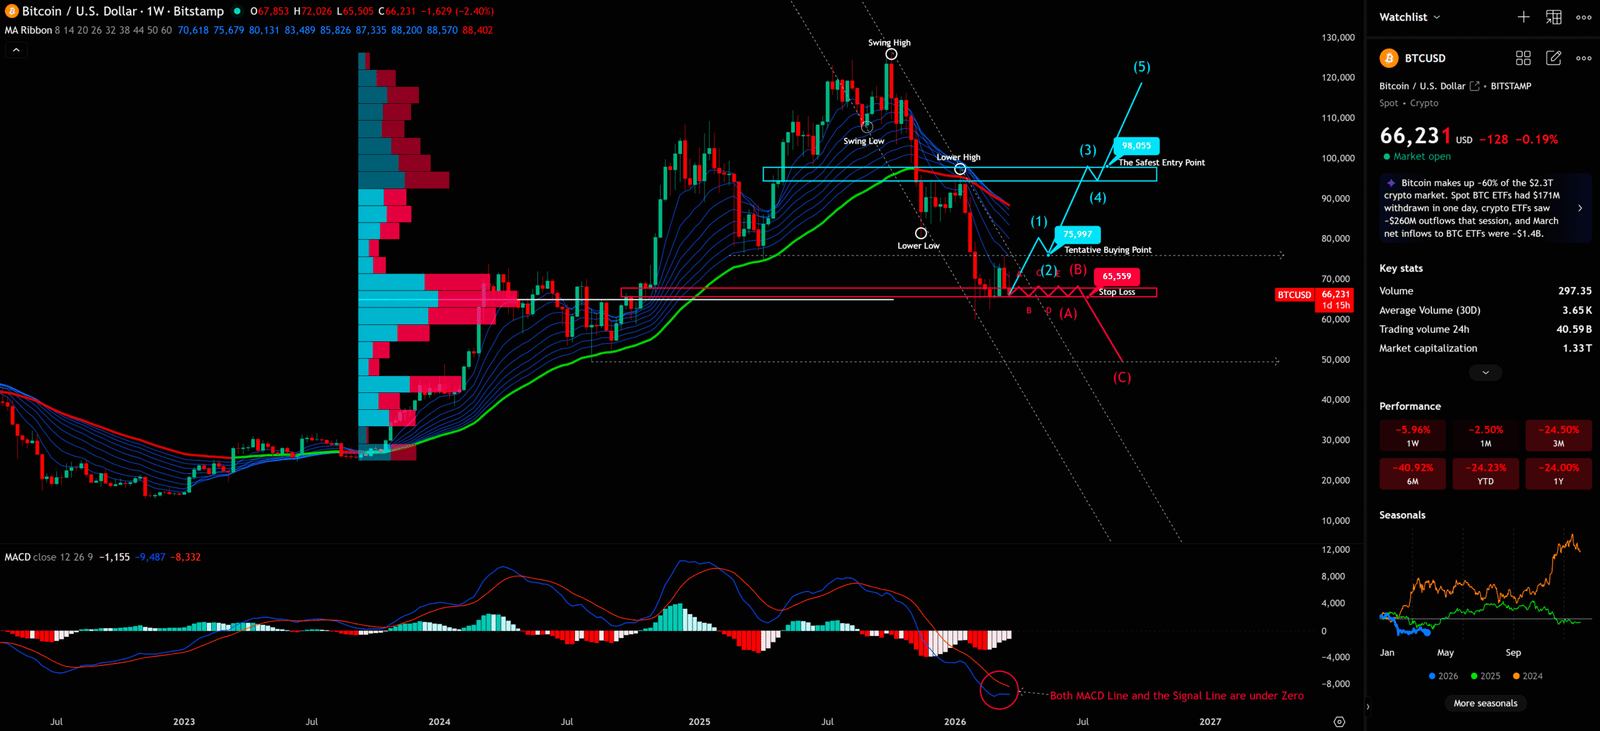
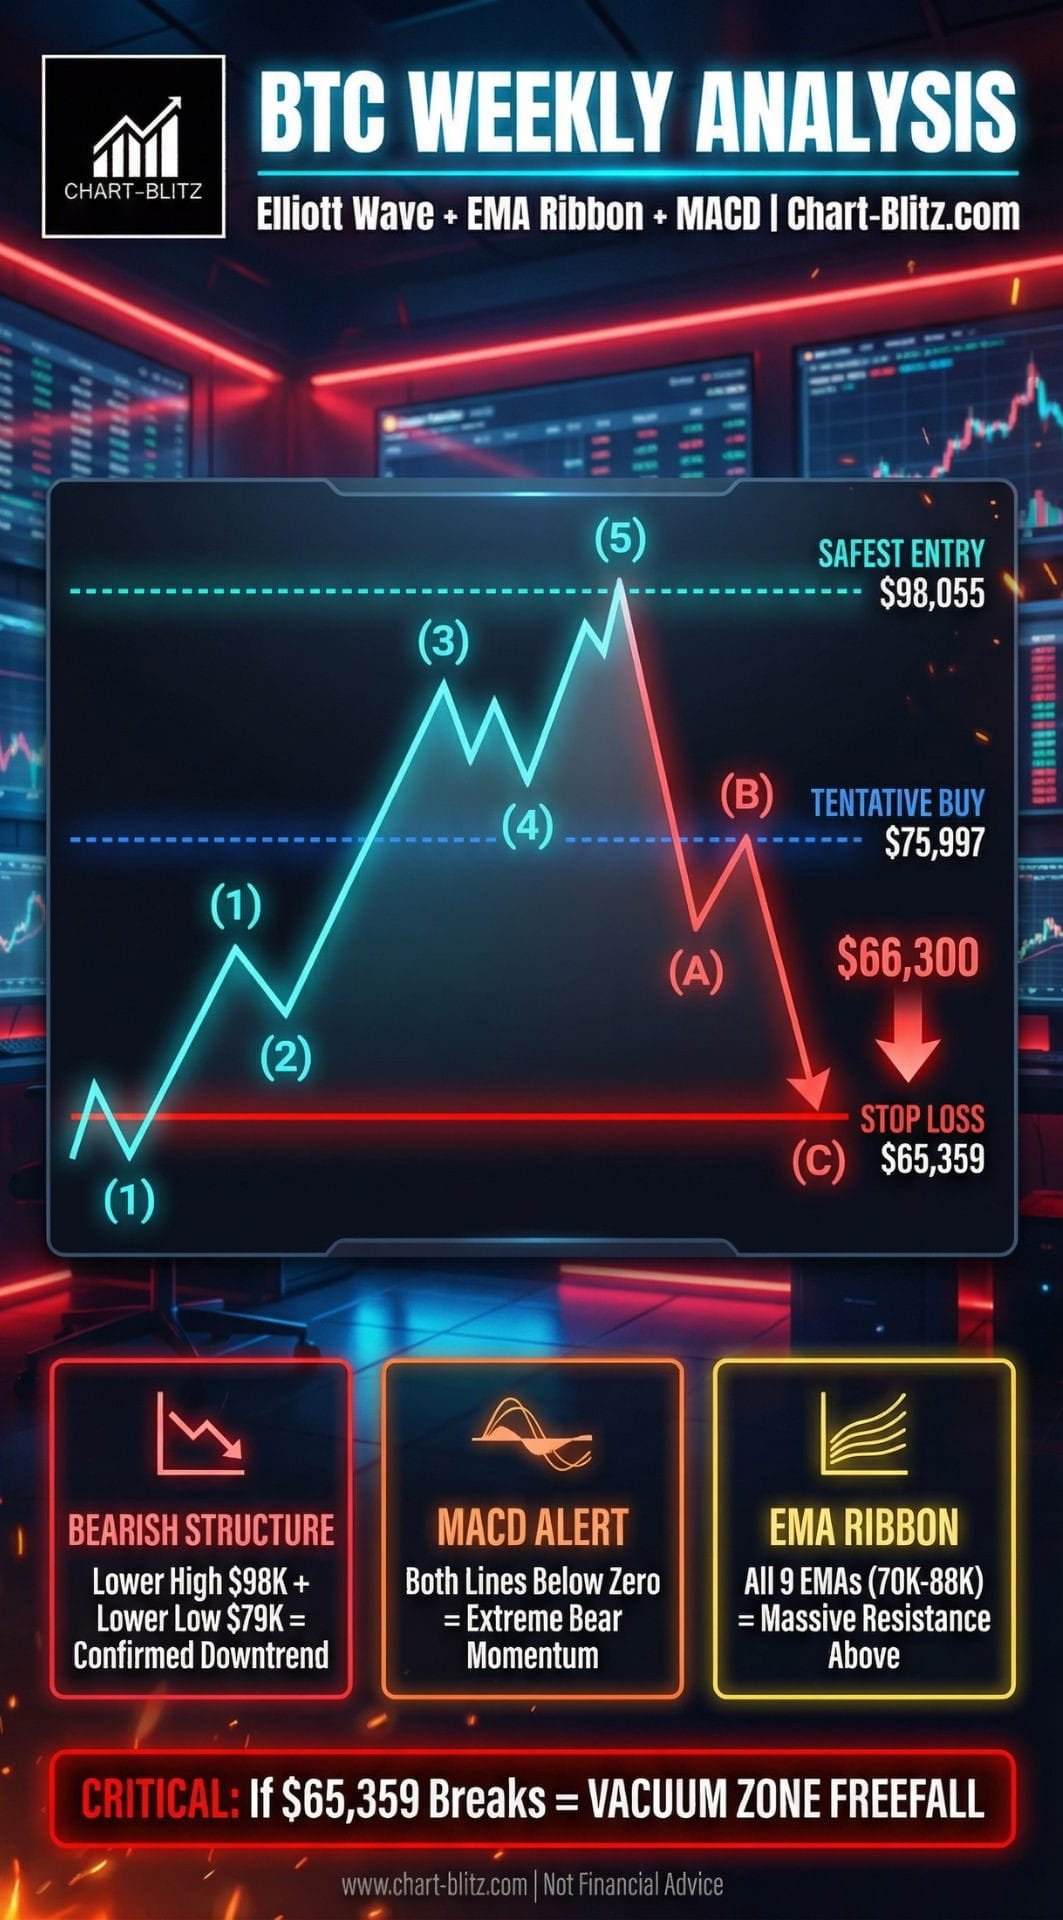
Looking at our annotated Weekly Chart, it is glaringly obvious that BTC’s price action has formed a textbook Downtrend. After retreating from the historical Swing High (around $126,000), the subsequent bounce was anemic, forming a Lower High near $98,000. The price then plunged further, slicing through the previous Swing Low (around $107,000) to establish a Lower Low near $80,500. This undeniable “Lower High, Lower Low” structure is the most direct evidence that the bears are in complete control. Those retail traders shouting “To the Moon” near $98,000 clearly failed to recognize this fatal structural reversal.
2. Elliott Wave: The Line Between Life and Death
The chart clearly maps out the potential path of the Elliott Wave theory. We hypothesize that the previous price action was an impulsive (1)-(2)-(3)-(4)-(5) wave upwards, and we are currently mired in a massive (A)-(B)-(C) corrective wave. The price is currently hovering near Wave (B), just above our red horizontal line marked Stop Loss ($65,359).
Here, I must emphasize an Iron Rule of Elliott Wave Theory: In a standard 5-wave impulsive structure, the bottom of Wave 4 absolutely cannot overlap with the top of Wave 1. If the price of BTC unfortunately crashes through our marked Tentative Buying Point ($75,997), or worse, breaks lower defensive lines, the entire assumption of a 1-2-3-4-5 upward impulsive wave will be completely shattered. This would mean the current decline is not a mere “bull market pullback,” but the onset of a much larger, macro-level bear market corrective wave.
3. VPFR and the EMA Ribbon: The Institutional Liquidity Trap
Direct your attention to the VPFR (Volume Profile Fixed Range) indicator on the left side of the chart. VPFR is the ultimate weapon used by institutions to locate volume clusters and the Point of Control (POC). By statistically mapping the volume distribution across different price levels within a fixed time range, VPFR reveals where the majority of market participants are holding their positions. We can see a massive volume peak between $60,000 and $80,000, indicating a massive accumulation of historical volume. However, below the current price, there exists a perilous “Vacuum Zone.” If the price breaches the $65,359 defense line, there will be insufficient volume support below, and the price could accelerate downwards in a freefall.
Furthermore, examine the EMA Ribbon (Exponential Moving Average Ribbon). The EMA Ribbon is a trend confirmation tool composed of multiple EMAs of different periods. By observing the arrangement and spacing of these moving averages, one can intuitively gauge the strength and direction of the trend. Currently, the 8 to 60-period EMAs are fanning out in a complete bearish alignment (ranging from 70,618 to 88,402), and the current price of $66,231 is severely suppressed below all of them. It’s as if several mountains are pressing down on the price; every attempted rally will be met with crushing selling pressure.
4. Staring into the Abyss with MACD
Finally, let’s look at the weekly MACD (Moving Average Convergence Divergence). MACD is calculated from the difference between a fast EMA and a slow EMA. By analyzing the crossover of the MACD line and the signal line, as well as the histogram’s position relative to the zero line, we can gauge the directional momentum of the market. The chart explicitly notes: “Both MACD Line and the Signal Line are under Zero.” The MACD lines have plunged below the zero line, and the Histogram is printing extreme negative values (-1,155 / -9,487 / -8,332). In traditional technical analysis, this is a fiercely strong, long-term bearish signal. It indicates that the long-term momentum of the market has completely inverted, giving the bears absolute dominance.
📉 Daily Chart: The Ruthless Slicing of Fibonacci
Daily Timeframe for BTC (Bitcoin)
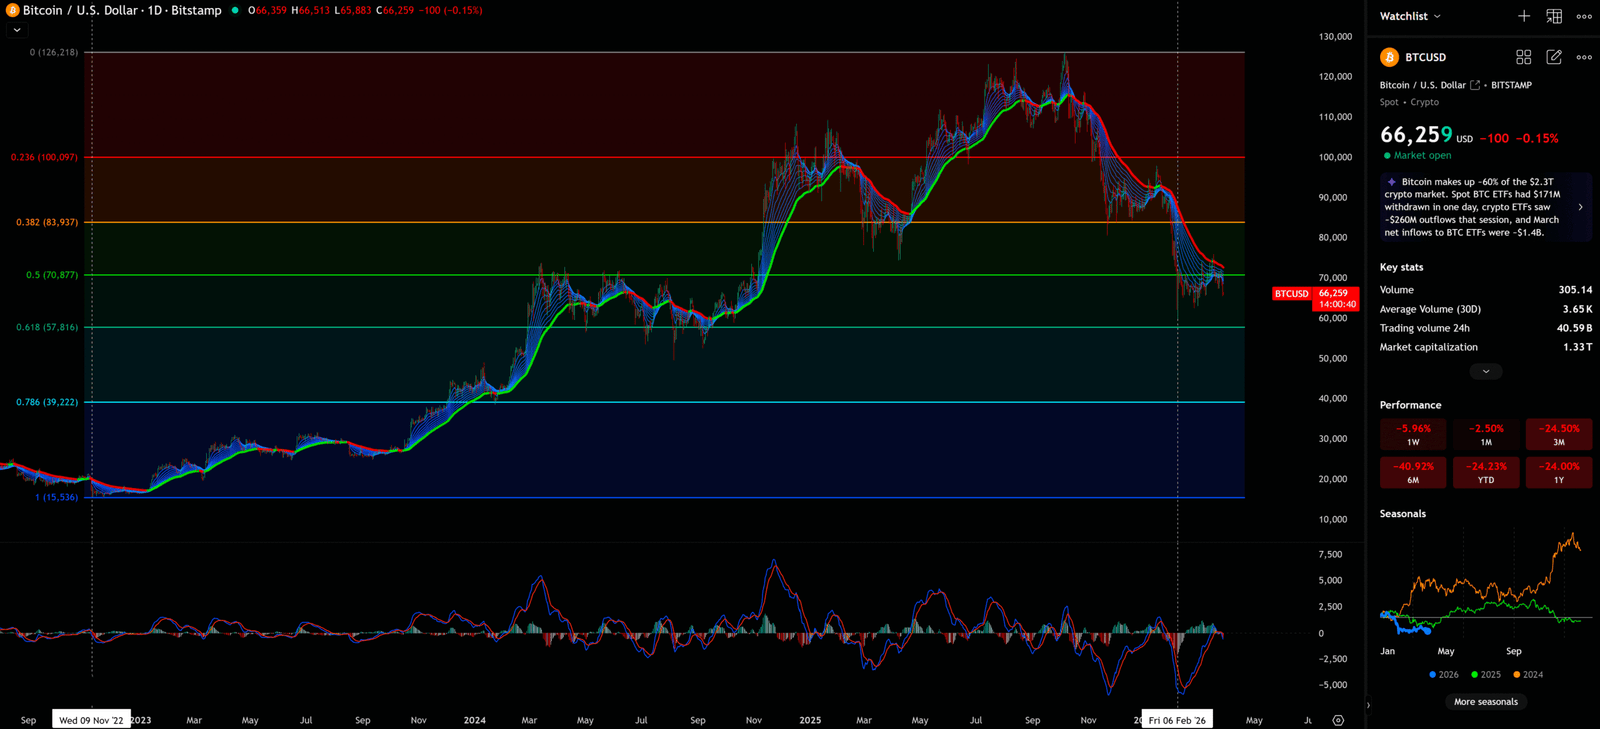
If the Weekly Chart tells us the macro trend is lost, the Daily Chart provides us with a precise tactical battle map.
The recent news of ETF outflows is perfectly validated on the Daily Chart. Fibonacci Retracement is a technical analysis tool based on the golden ratio sequence. By drawing horizontal lines between significant highs and lows, it identifies potential support and resistance levels. When we draw a Fibonacci Retracement from the bottom at $15,516 to the peak at $126,218, the magic numbers reveal themselves. The current price of $66,259 is trapped exactly between the 0.5 ($70,877) and the 0.618 ($57,816) golden ratio levels.
| Fibonacci Level | Price | Significance |
| 0.236 | $100,097 | Lost, now strong resistance |
| 0.382 | $83,937 | Key resistance zone |
| 0.5 | $70,877 | Current critical resistance |
| 0.618 | $57,816 | Bulls’ last line of defense (Golden Pocket) |
| 0.786 | $39,222 | Extreme bear market target |
The 0.5 level ($70,877) has transformed from early support into formidable resistance. The 0.618 level below ($57,816) is the absolute last line of defense the bulls must hold—commonly known as the “Golden Pocket.” If this level breaks, the market faces a devastating blow. Concurrently, the daily EMA Ribbon has formed a death cross, cascading above the price like a waterfall, and the MACD remains deep in negative territory. All these indicators are screaming a unified warning: Do not blindly attempt to buy the dip in the short termh.
🗓️ Monthly Chart: The Silent Warning of Long-Term Indicators
Monthly Timeframe for BTC (Bitcoin)
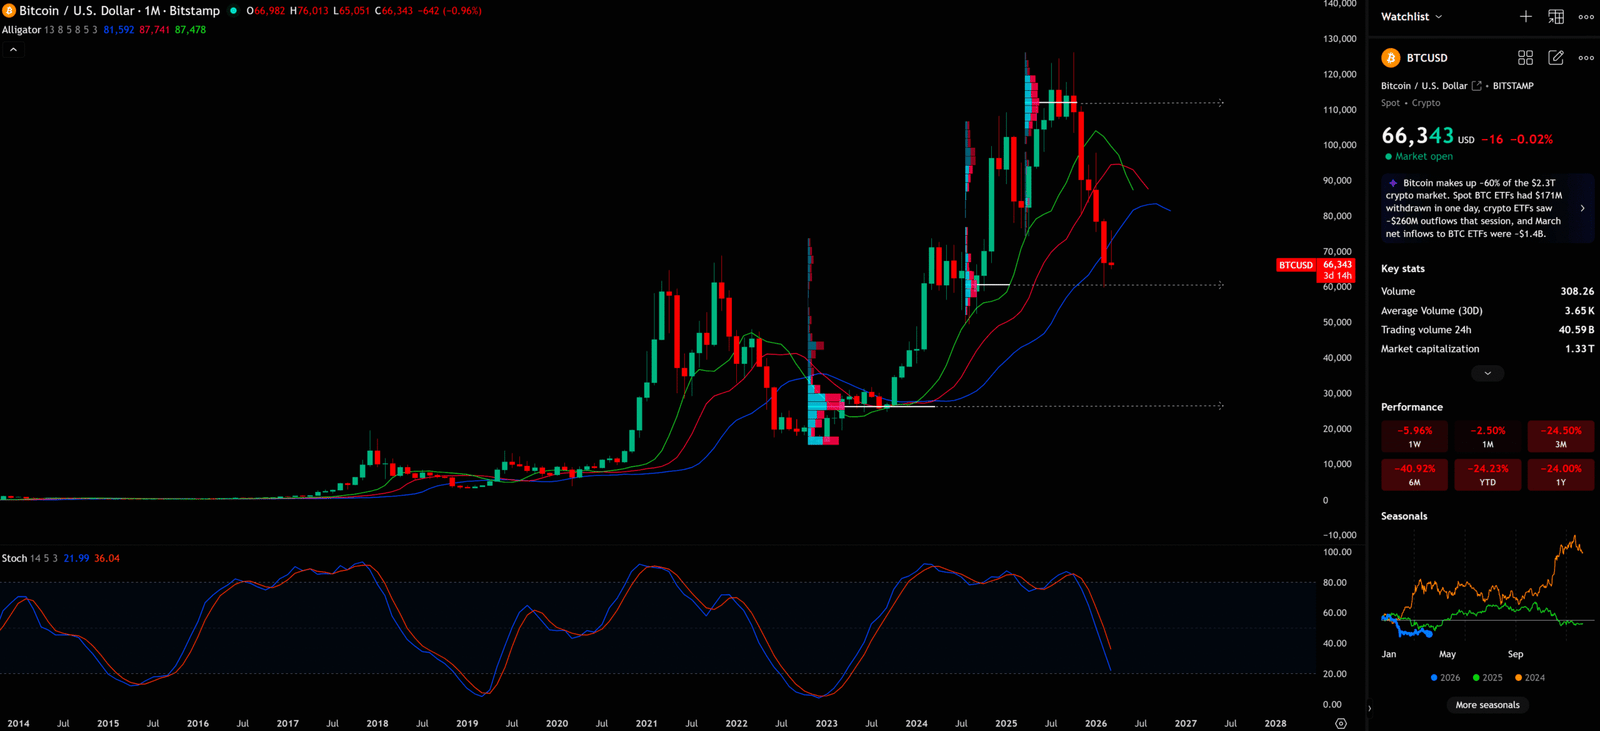
Zooming out, let’s examine the Monthly Chart. This is the ultimate perspective that filters out all short-term market noise.
The Bill Williams Alligator indicator applied to this chart paints a disturbing picture. Designed by Dr. Bill Williams, the Alligator consists of three Smoothed Moving Averages (SMMA) representing the Jaw (Blue), Teeth (Red), and Lips (Green) of an alligator. When the three lines are intertwined, the market is “sleeping”; when they fan out in the same direction, the trend is “awakening.” Currently, the Jaw (Blue: 81,592), Teeth (Red: 87,741), and Lips (Green: 87,478) have begun to open their jaws downwards, and the price of $66,343 is sitting right beneath the alligator’s mouth. This implies that a long-term downtrend is awakening.
Simultaneously, the Stochastic Oscillator below reads 21.99 / 36.04. The Stochastic Oscillator measures market momentum by comparing the closing price to the price range over a specific period, indicating overbought and oversold conditions. Both lines are rapidly approaching the oversold territory (below 20), yet there is absolutely no sign of a golden cross. This suggests that the long-term selling momentum is still being unleashed, and forming a true bottom may require several more months of painful consolidation.
⏱️ 4-Hour Chart: Short-Term Combat and the Confinement of the Channel
4-Hour Timeframe for BTC (Bitcoin)
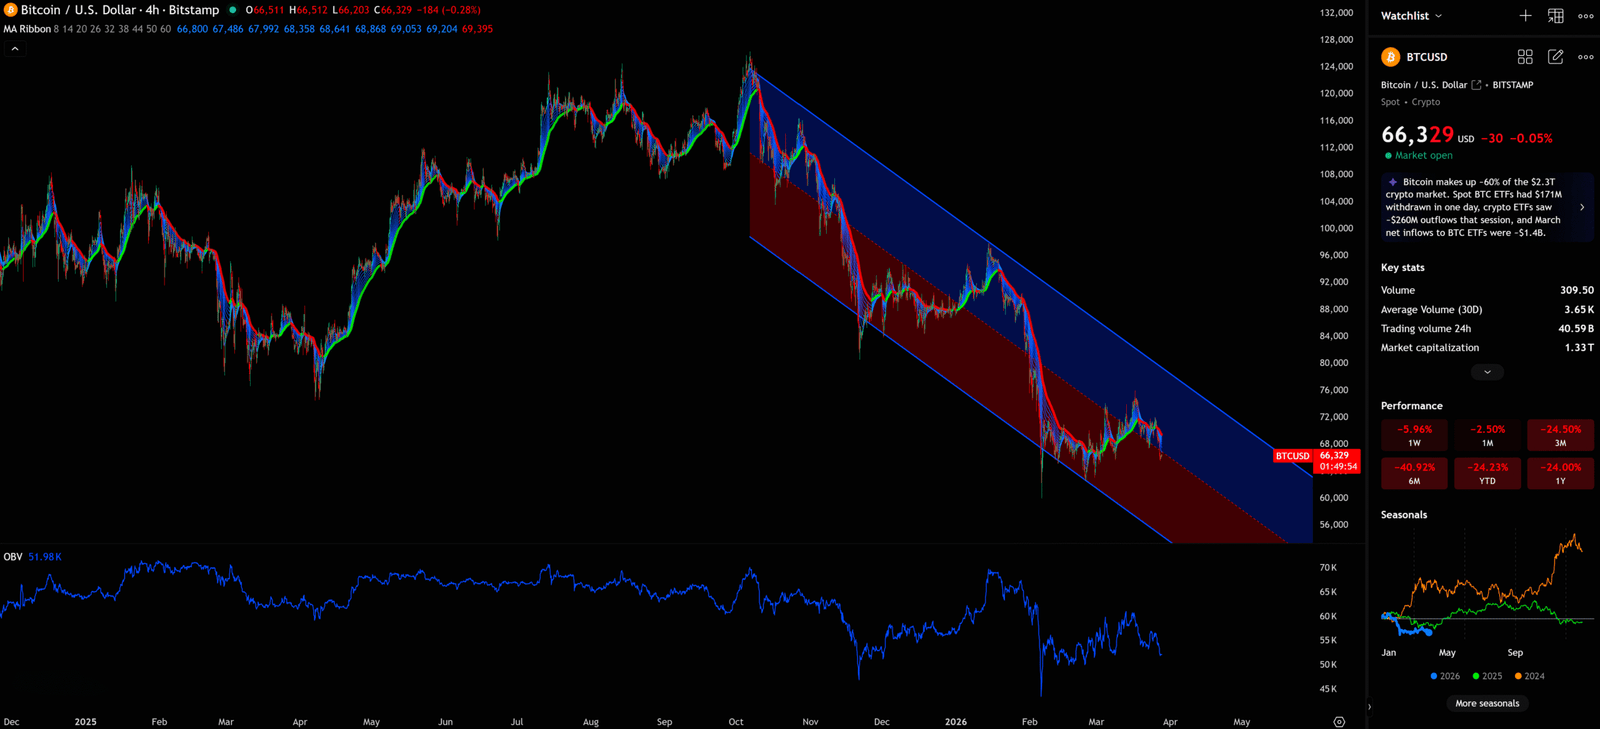
Finally, we return to the 4-Hour Chart to witness the agonizing struggle faced by short-term traders.
Under the dual onslaught of options expiry and ETF outflows, BTC is perfectly confined within a Descending Parallel Channel on the 4-hour timeframe. A parallel channel is a technical pattern formed by two parallel trendlines, where the upper boundary represents resistance and the lower boundary represents support. The slope of the channel reflects the direction and intensity of the trend. This channel’s upper boundary has been pressing down from $124,000, while the lower boundary points toward the abyss at $56,000. The current price of $66,329 is languishing in the lower half of this channel, heavily suppressed by the dense resistance of the 4-hour MA Ribbon above.
Even more concerning is the OBV (On Balance Volume). OBV measures the balance of buying and selling power by cumulatively adding volume on up days and subtracting volume on down days. The OBV has plummeted to 51.98K, indicating that the recent decline has been accompanied by a genuine exodus of capital (which perfectly aligns with the ETF net outflow data). Without the backing of real capital inflows, any short-term bounce will be nothing more than a “Dead Cat Bounce.”.
♟️ Comprehensive Conclusion and the S/R Flip Trading Plan
Synthesizing this deep dive across multiple timeframes, a crystal-clear logical chain emerges: The deterioration of macro fundamentals (options liquidations, ETF outflows, a hawkish Fed) acted merely as the catalyst, while the pre-existing bearish structures on the charts (Lower Highs, EMA death crosses, MACD below zero) are the root cause of the price collapse.
As rational traders, we never blindly predict the bottom; instead, we formulate strict trading plans. Based on the Support and Resistance (S/R) Flip Rule, we have mapped out the following two scenarios:
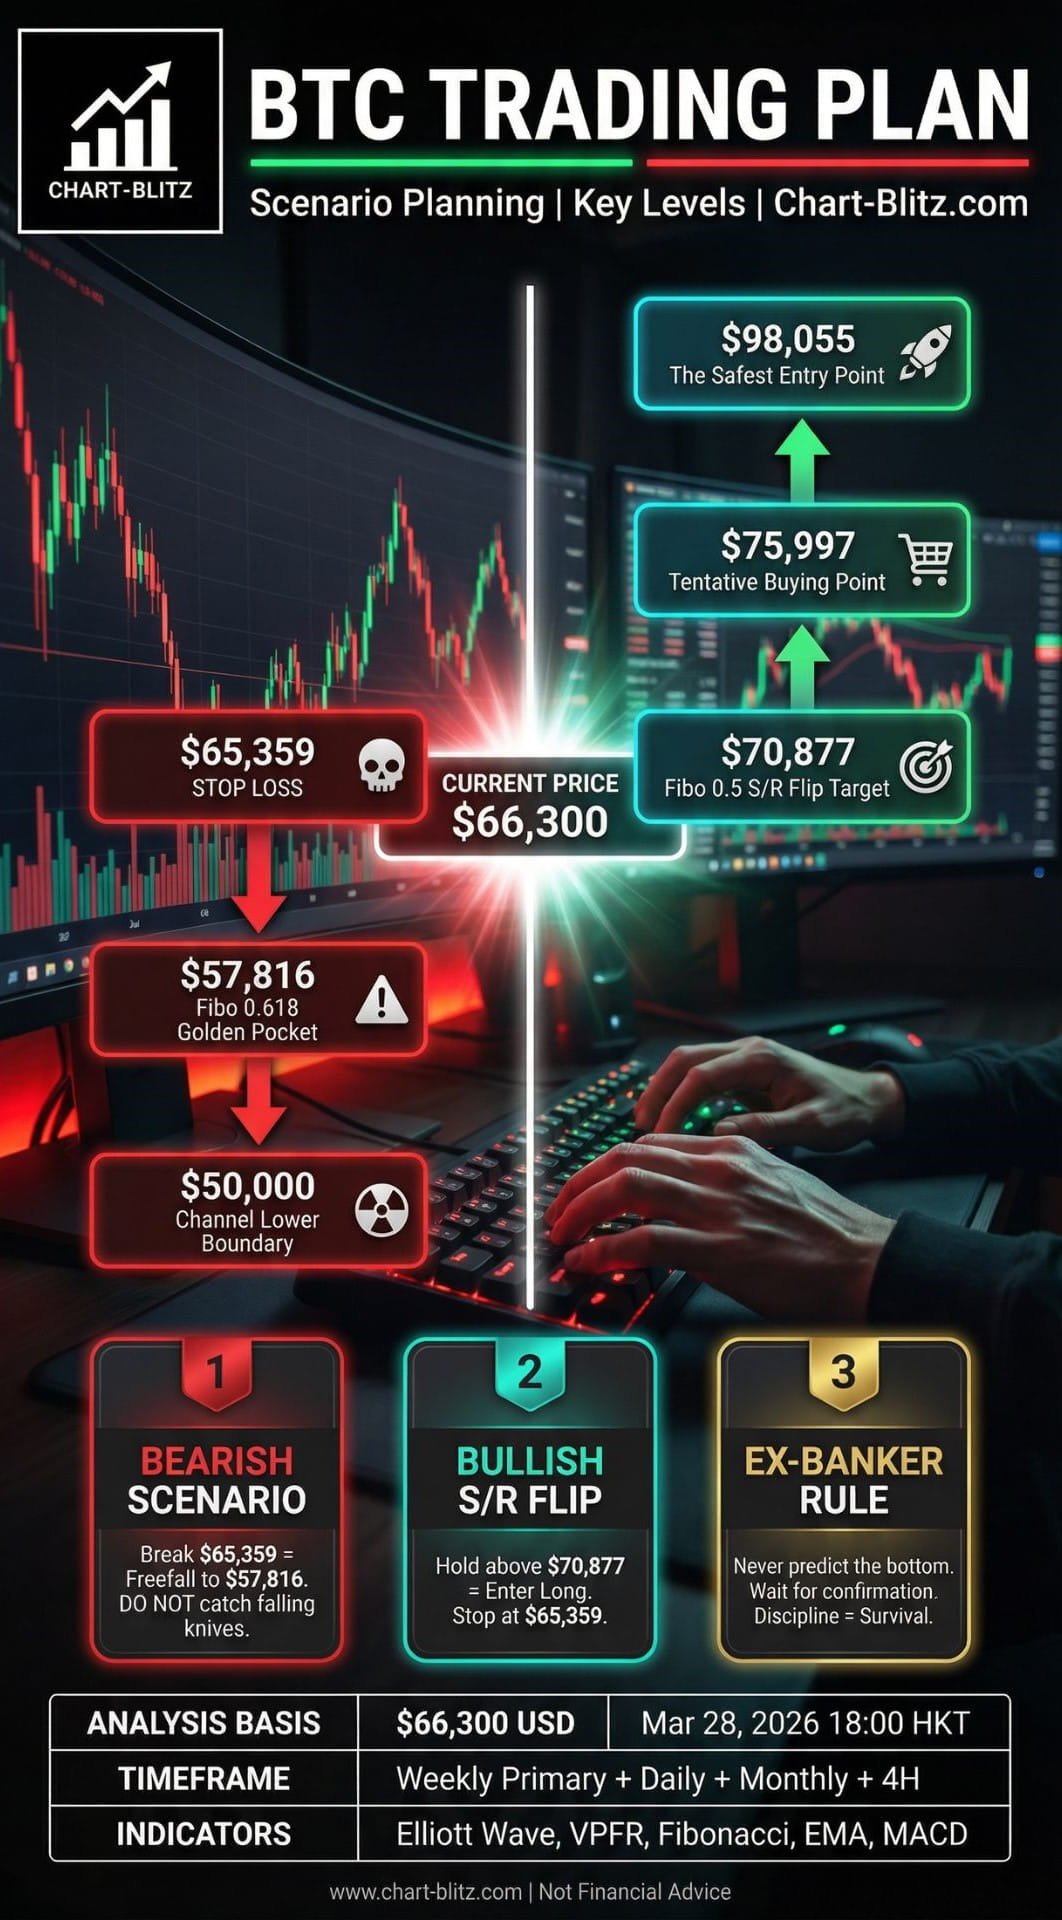
Bearish Scenario – High Probability
If BTC fails to hold the current Stop Loss ($65,359) defense line, the price will plunge directly into the VPFR Vacuum Zone. The next major support will be the daily Fibonacci 0.618 level at $57,816. If panic intensifies, we could even see a test of the channel’s lower boundary and the historical monthly support zone around $50,000.
Bullish Scenario – S/R Flip Trigger
Theoretically, the BTC downtrend should not be over yet, but if the BTC price does not continue to fall but instead turns upwards and explodes, it needs to be seen whether it can rise to the resistance zone (namely the Fibo 0.5 at $70,877 and the channel midline). If it breaks above and holds (forming an S/R Flip), then enter the market; otherwise, it will reach the stop loss and you must sell off and exit. Furthermore, our marked “The Safest Entry Point” ($98,055) will only become a truly safe zone for heavy capital deployment after the price reclaims all moving averages and confirms a definitive trend reversal.
| Scenario | Trigger | Target | Stop Loss |
| Bearish (High Probability) | Break below $65,359 | $57,816 → $50,000 | N/A |
| Bullish (S/R Flip) | Break and hold above $70,877 | $75,997 → $98,055 | $65,359 |
I will continue to closely monitor the price action of this Crypto. As soon as a critical reversal signal appears on the charts, I will update my analysis and insights right here immediately. Remember to Bookmark this page and come back often to check for the latest updates! Want to unlock more bank-grade, exclusive trading models and indicator parameters? Head over to www.chart-blitz.com now to explore more in-depth content. Let’s use an institutional perspective to conquer this noise-filled market!.
Want to see our full, interactive chart breakdown? If you want to learn how to draw Fibonacci Retracement Ratio yourself, identify S/R Flips, and stop trading blind. Please browse the following『Further Reading』links. Fundamental news tells you what happened. Technical analysis predicts what will happen. To master the professional framework that separates market signal from noise, explore our exclusive models at www.chart-blitz.com.
📚Further Reading:
- Complete Guide to Fibonacci Retracement — The magical application of Fibonacci sequences in financial markets, and how to combine them with other indicators to improve the accuracy of Fibonacci levels.
- Elliott Wave Theory for Beginners — Learn the counting methods for 1-2-3-4-5 impulse waves and A-B-C corrective waves, as well as the four iron rules of Elliott Wave theory. Master this tool and you’ll be able to see the “roadmap” that retail investors cannot.
- Volume Profile (VPFR) Tutorial — Learn how to use VPFR to identify POC (Point of Control) and “vacuum zones,” thereby predicting market maker layouts and retail liquidity traps.
- S/R Flip Support and Resistance Swap Strategy — S/R Flip is one of the most powerful concepts in technical analysis. This article uses real cases to teach you how to use S/R Flip to capture the highest win-rate trading opportunities.
- MACD Divergence Trading Strategy: How to use MACD divergence to identify trend turning points and position in advance.
- Bill Williams Alligator: Catching the Slumber and Awakening of Long-Term Trends.
- Descending Parallel Channel and OBV Resonance Trading Strategy.
【Disclaimer】 The content herein is for educational purposes and reflects the author’s personal opinion only; it is not investment advice. All financial investments, including cryptocurrencies, carry significant risk, and you could lose your entire capital. To support this site, this article may contain affiliate links. While we strive for accuracy, we cannot guarantee all information is complete or error-free. Please conduct your own research and be fully responsible for your own investment decisions.