The speculator’s chief enemies are always boring from within. It is inseparable from human nature to hope and to fear
William Delbert Gann – 1949
Hello Chart-Blitz warriors!
Feeling the rollercoaster ride in the market lately? Watching Cardano (ADA)’s price fluctuate and feeling your heart skip a beat? You might have heard experts talk about MACD, channels, and whatnot. But today, I want you to forget all the complex stuff.
You only need to keep an eye on one line, one price: US$0.51.
This price level is ADA’s short-term “lifeline,” and it will determine whether the market is facing a “dip-buying opportunity” or a “red alert evacuation.”
- All technical analysis below is based on a price snapshot locked in on November 3, 2025, 16:27 (UTC+8): ADA = $0.58 USD.
- This price snapshot provides a stable reference point for analysis. All support, resistance, and projected paths are relative to this benchmark. Market prices are highly volatile; readers should treat this report as an “analytical map,” not a real-time price feed.
Analysis Benchmark Statement
The Catalyst & Fundamental View (The Rear-view Mirror) In the last 24 hours, there has been no significant, ADA-specific news. The market sentiment has generally followed the broader market downturn. This perfectly validates the core philosophy of www.chart-blitz.com: when the news is quiet, the technical structures on the chart become the most reliable clues for predicting future movements.
Multi-Timeframe Technical Deep Dive (The Predictive Lens)
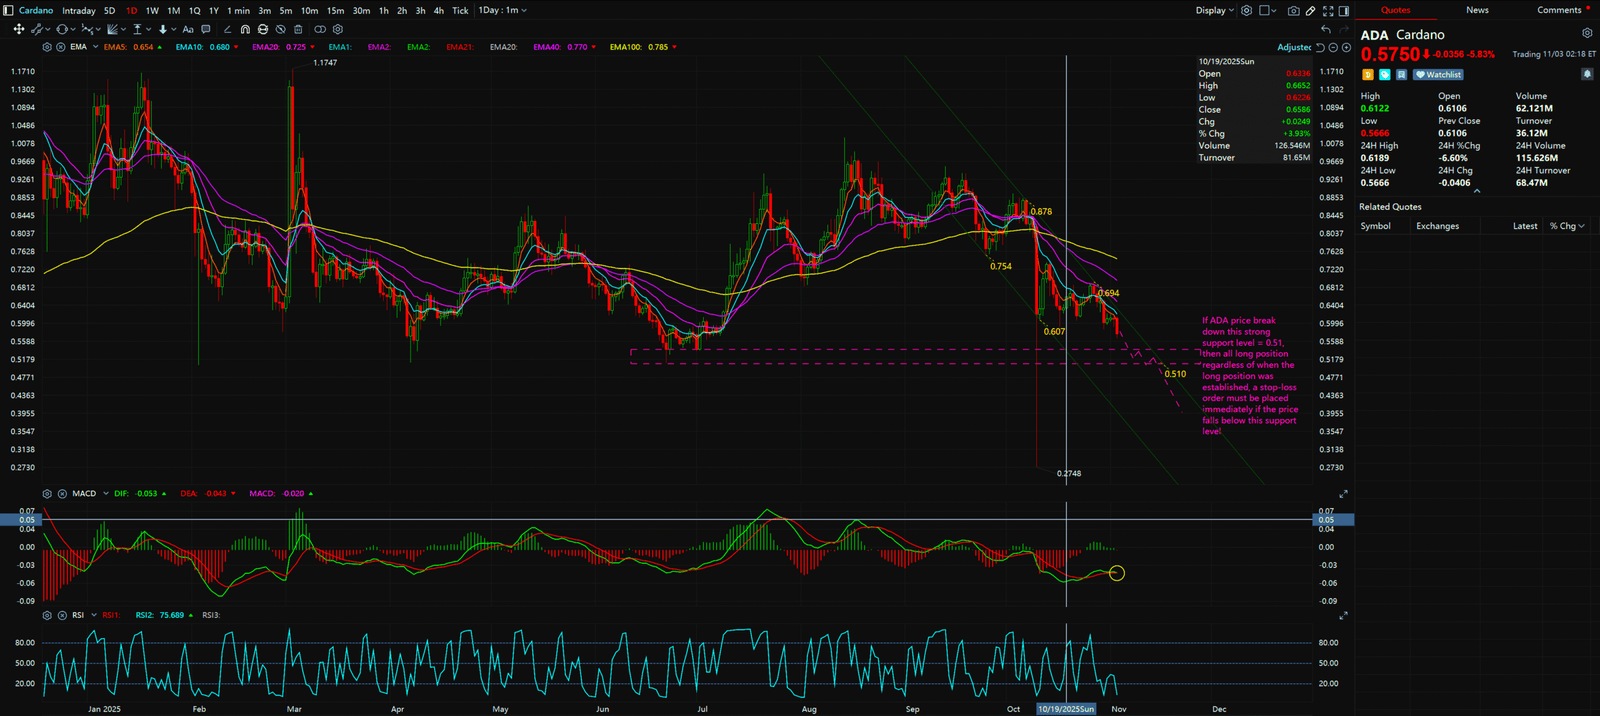
Let’s get straight to the chart’s story. The daily chart clearly shows ADA in a distinct “descending channel,” as if it’s sliding down a slope. And US$0.51 is the last significant “guardrail” at the bottom of this slope.
- The Bear Case: If this level fails to hold, it’s like a car crashing through the final barrier. Based on the chart structure, there is virtually no strong support below it. The next major level where buyers might consider “bottom-fishing” could be as far down as US$0.2624. Yes, you read that right. The potential drop is staggering. Furthermore, the MACD indicator (a momentum tool) on the daily chart is showing a bearish signal, suggesting that downward momentum might be building.
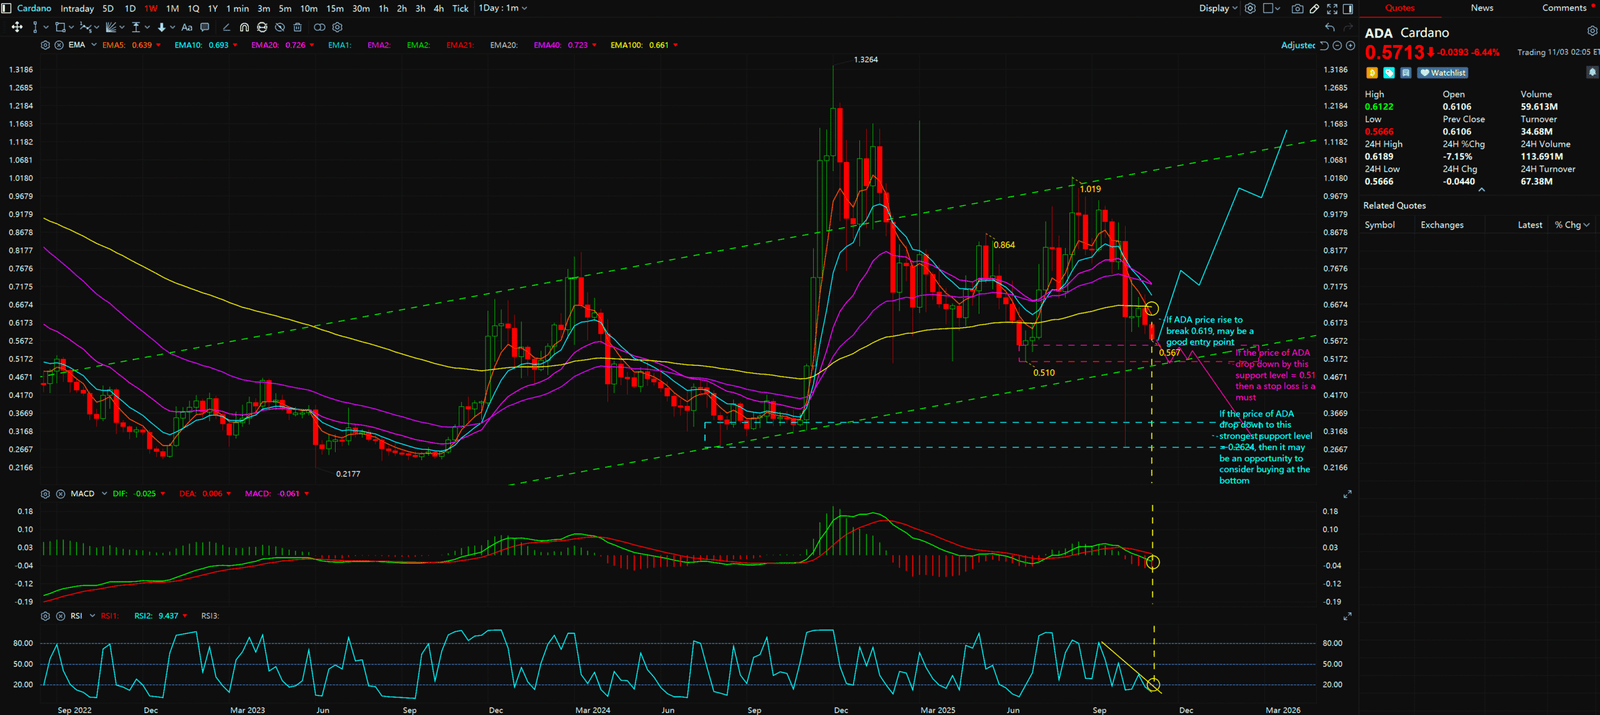
- The Bull Case: Does this mean all hope is lost? Not entirely. If ADA can miraculously stabilize above US$0.51 and, even better, manage to break back above the recent key resistance level of US$0.619, it would signal a reversal in market power. Only then, with the previous resistance turning into new support, could we reconsider entering the market.
【The Beginner’s Playbook: What Should I Do?】
By combining the different timeframe analyses, we can derive two clear scenarios:
- If You Already Hold ADA:
- Be Disciplined: Immediately set a stop-loss just below US$0.51, for instance, at US$0.505. No hesitation, no averaging down. If it breaks, you get out. Preserving your capital is the name of the game. Remember, the market is always there, but your capital isn’t infinite.
- If You Want to Buy ADA:
- Patience! Don’t Catch a Falling Knife: Buying now is like trying to catch a falling knife with your bare hands—extremely risky.
- Two Options: Either wait patiently for the price to reclaim US$0.619 to confirm a reversal, OR wait for it to potentially drop to the next major support zone around US$0.2624 before considering a phased entry.


Key Takeaways
Summary / Key Price Levels:
The situation for ADA is critical. Instead of guessing the direction, focus on risk management. US$0.51 is the only line you need to draw on your chart. If it holds, there’s a fighting chance. If it breaks, please exit immediately to protect yourself.
- Lifeline Support: US$0.51
- Bullish Confirmation: US$0.619
- Next Major Support: US$0.2624
For continuous, real-time analysis of these developing market structures, visit www.chart-blitz.com.
Fundamental news tells you what happened. Technical analysis predicts what will happen. To master the professional framework that separates market signal from noise, explore our exclusive models at www.chart-blitz.com.
Sources:
- https://www.msn.com/en-us/money/economy/cardano-price-analysis-ada-consolidates-while-this-new-crypto-targets-500-upside/ar-AA1PF4SI
- https://www.goodreturns.in/news/bitcoin-price-falls-below-108-000-as-crypto-market-slumps-doge-cardano-down-over-25-this-month-1467131.html
- https://coinmarketcap.com/currencies/cardano/
Unlocking Technical Analysis: Power Moves with Diagrams !
Weekly Timeframe for Cardano (ADA)
Daily Timeframe for Cardano (ADA)