Alright, all you Market Bottom Hunters, Crypto cycle surfers, and long-term planners looking to catch those “once-in-a-generation” lows! Today, we’re decoding an OG indicator with a rich history and even a touch of “market psychology” – the Coppock Curve! This isn’t for chasing quick rips or dips; it was designed to signal when a bear market might be bottoming out, suggesting it’s time to consider “bargain hunting” for long-term buys!
What the heck is the Coppock Curve? Why is it Special?
The Coppock Curve is a Long-Term Momentum Oscillator. It’s fundamentally different from the short-term volatility trackers like RSI or Stochastics we often use. Its line oscillates above and below a Zero Line.
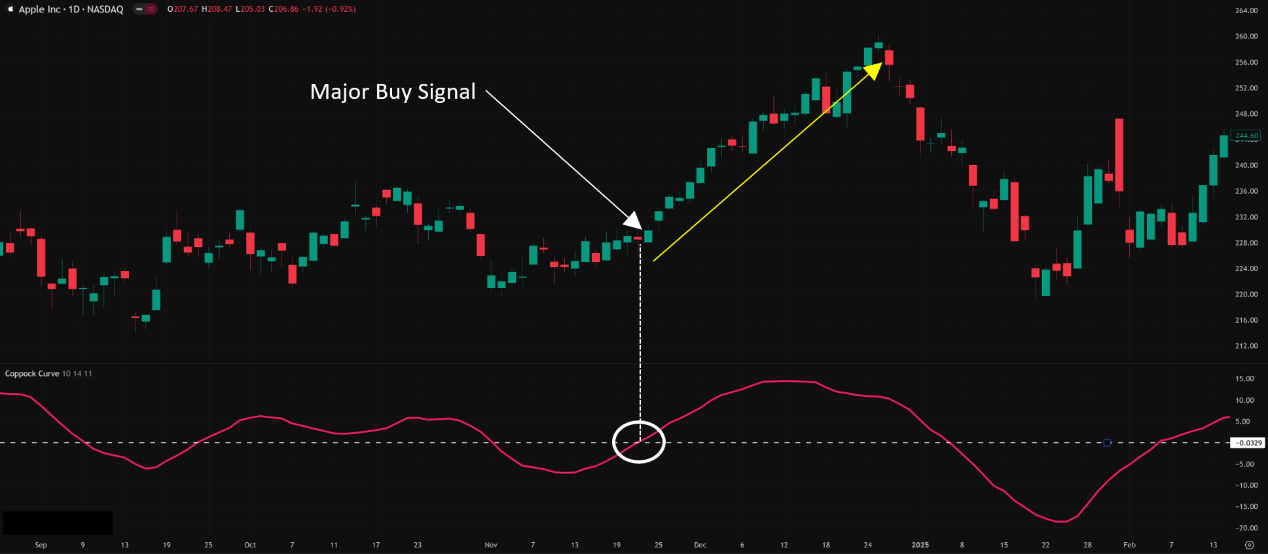
- Core Signal: When the curve turns upwards from well below the zero line, it’s considered a potential long-term buy signal.
- Design Purpose: It wasn’t built for picking tops or short-term trading. Its sole original goal was to try and identify major long-term bottoms in stock market indices (like the S&P 500, Dow Jones).
「Coppock Curve: Long-Term Bottoming Momentum Signal」
Why is it special? Because its design philosophy and origin story are fascinating, involving human emotional cycles!
Coppock Curve’s Origin Story & Design: Market Insights from Love & Loss?
This indicator was created in 1962 by an American economist and investment advisor named Edwin Sedgwick Coppock. The story goes like this: The Episcopal Church wanted a reliable method to determine when bear markets were ending so they could start buying stocks for the church’s long-term endowment fund. They asked Coppock for help.
Coppock had a unique perspective. He believed long-term market fluctuations were related to human mass emotional cycles, specifically the bereavement period after significant loss. He asked an Episcopal bishop how long, on average, it takes for someone to overcome grief after losing a loved one. The bishop reportedly said about 11 to 14 months.
So, Coppock thought: A bear market crash is like investors experiencing collective “grief.” Could measuring the market’s momentum change over this period indicate when the “grieving” is ending and it’s time to re-engage?
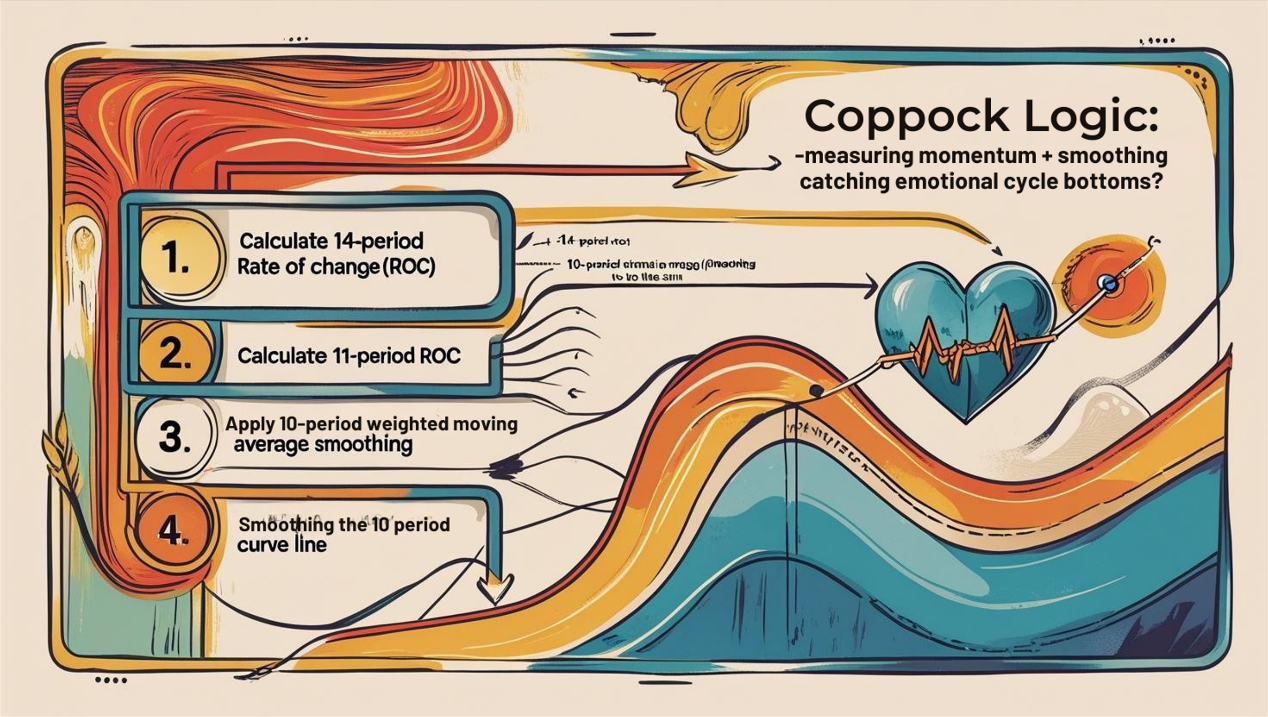
How it’s Calculated (Conceptual Flow, no need for formula memorization):
- Calculate Two Rates of Change (RoC): RoC measures the speed of price changes over time. Coppock used two RoCs:
- A longer-term RoC (e.g., 14 months).
- A shorter-term RoC (e.g., 11 months).
- Goal: Capture market momentum at different speeds.
- Weighted Average of the Two RoCs: He then took the sum of (14-month RoC + 11-month RoC) and applied a Weighted Moving Average (WMA), typically over 10 months.
- Using WMA gives more weight to recent data and smooths out the RoC fluctuations, making the signal clearer.
- The Result is the Coppock Curve: This final line, derived from RoC calculations smoothed by a WMA, is the Coppock Curve.
Simply Put: It measures medium-to-long-term downward/upward momentum (RoC), then smooths the result with a weighted average (WMA). The goal is to catch long-term buying opportunities when market momentum shifts from negative to positive, and this shift shows persistence (confirmed by WMA smoothing). The whole design is steeped in insights about market sentiment cycles.
「Coppock Logic: Measuring Momentum Shift + Smoothing = Catching Emotional Cycle Bottoms?」
Coppock Curve Basic Plays (The Traditional, Orthodox Use):
Remember! The traditional use of the Coppock Curve is VERY specific!
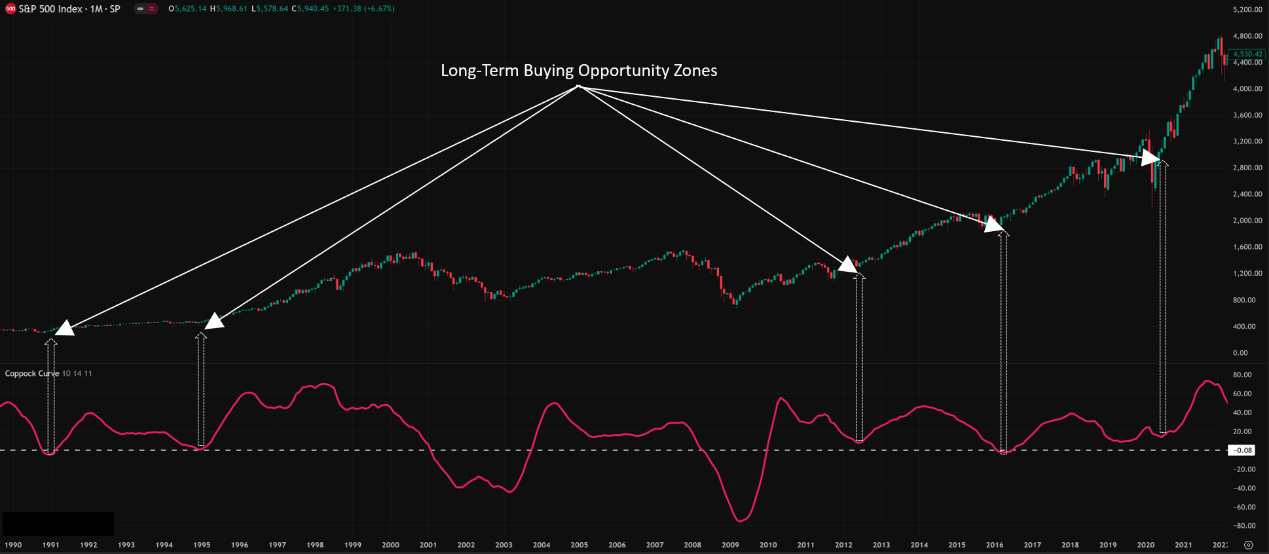
- Timeframe: MONTHLY CHART!
- This is the most crucial point! Coppock designed it specifically for monthly charts, and the parameters (14, 11, 10) are based on “months.” Using it on other timeframes drastically reduces its effectiveness or makes it completely invalid!
- Primary Targets: Major Stock Indices / Long-Term Investment Assets.
- E.g., S&P 500, Dow Jones, or potentially Bitcoin (if looking at its very long-term cycles).
- The Core Buy Signal (The ONLY Signal):
- Wait for the Coppock Curve to fall well below the zero line (indicating the market has experienced prolonged negative momentum/decline).
- When the curve makes a clear turn upwards while still below zero, that’s considered a long-term buy signal.
- This signal isn’t telling you to go all-in catching the exact V-bottom. It’s suggesting the bear market might be over, and it could be time to start considering scaling into positions or using Dollar-Cost Averaging (DCA) for long-term investment.
- NO SELL SIGNALS!
- The Coppock Curve was NOT designed to pick tops or provide sell signals. After it turns up from below zero, even if it later crosses back below zero, that’s not a traditional sell signal. Its one job: identify potential major bottom buying opportunities.
- Not a Precision Timer!
- It’s a momentum indicator and inherently lags. By the time it turns up, the price might have already bounced significantly off the absolute low. Its purpose is to confirm a bottoming zone, not the exact bottom point.
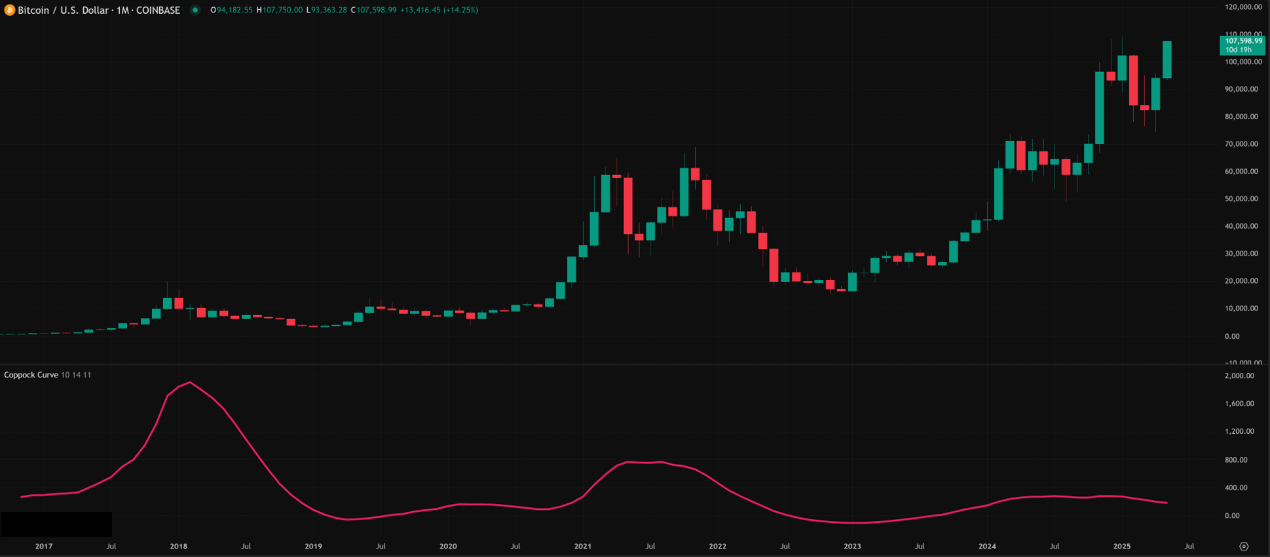
「Coppock Curve in Action (Monthly Chart): Historical Bottom Buy Signals」
Coppock Curve Advanced Plays & Parameter/Timeframe Breakdown (Expert Lab – High Risk Warning!)
Alright, I know you young guns are thinking: “Dude, monthly charts are slow AF! Can I use this on Crypto? Daily charts? Does changing parameters work?”
Parameter Settings: To Change or Not to Change? Why?
- Traditional Parameters: 14 (Long RoC), 11 (Short RoC), 10 (WMA). This is the combo Coppock found best captured the (then) market emotional cycle, specifically on monthly charts.
- Attempts to Change Parameters (Highly Experimental!):
- Goal: Make the indicator react faster or apply it to shorter timeframes.
- Common Changes:
- Shortening RoC periods (e.g., 10, 6, 10; or even shorter).
- Shortening WMA period (e.g., 14, 11, 5).
- The Result? Which is Hottest?
- Highly Questionable! No recognized “better” combo!
- The Problems:
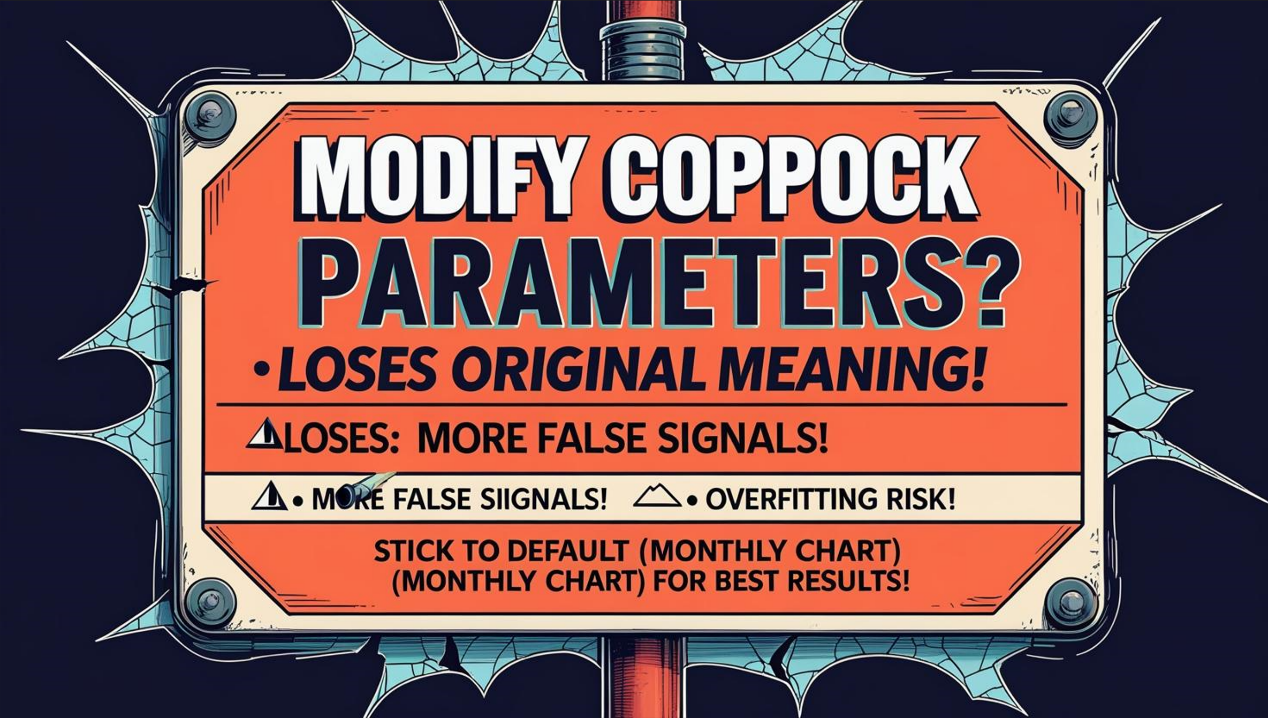
- Loses Original Intent: Changing parameters completely detaches the indicator from Coppock’s “human bereavement period” design philosophy.
- Increases Noise: Shortening periods makes the indicator hyper-sensitive to short-term volatility, generating tons of false signals. The Coppock Curve is fundamentally a momentum indicator; shortening periods makes it whip around zero meaninglessly.
- Backtesting Trap: You might find a “perfect” parameter set for a specific historical period, but it’s likely overfitting and will fail miserably in the future.
- **Conclusion: The “hottest” and most effective parameter combo is using the default (14, 11, 10) on a MONTHLY chart! If you insist on changing parameters for shorter timeframes, you’re not really using the Coppock Curve as intended, the results are highly unreliable, and require massive independent validation.
「Coppock Parameters: Modify with Extreme Caution!」
Timeframe Analysis:
- Monthly Chart: Designed Use! Best Stage! Best reflects the indicator’s ability to capture long-term market sentiment bottoms. Signals are rare but historically relatively reliable.
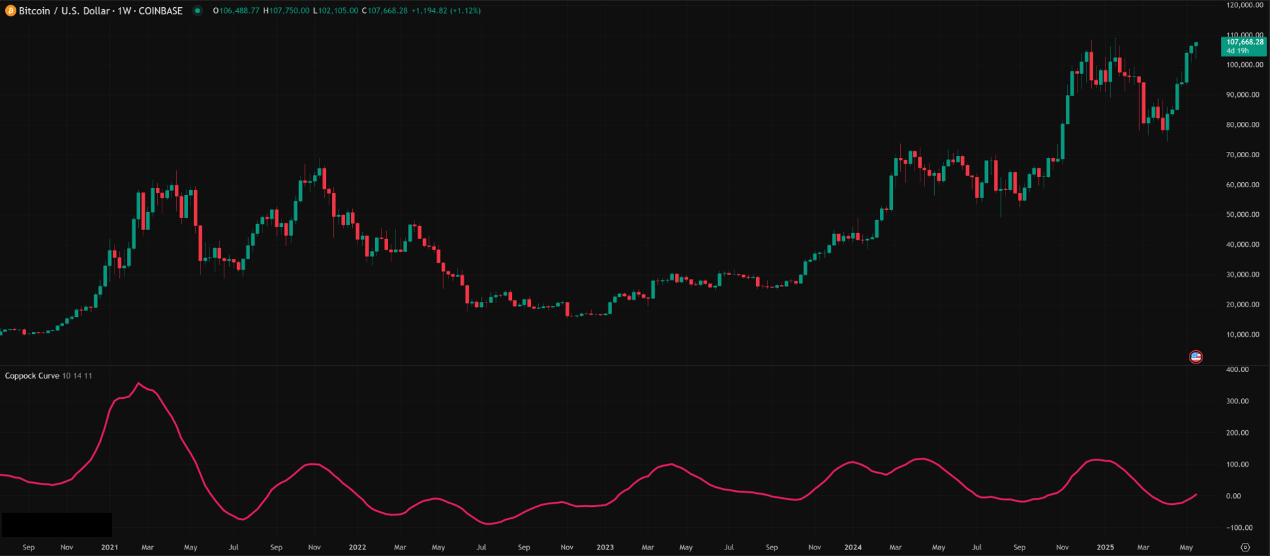
- Weekly Chart:
- Barely Usable, Downgrade Expectations! A Coppock turn on the weekly chart might catch the bottom of intermediate corrections, not major bear market lows. Signals will be much more frequent, and the false signal ratio increases significantly.
- How to Use: Can be an auxiliary tool, suggesting an intermediate correction might be ending, possibly for swing trading considerations. But never give it the same weight as a monthly signal.
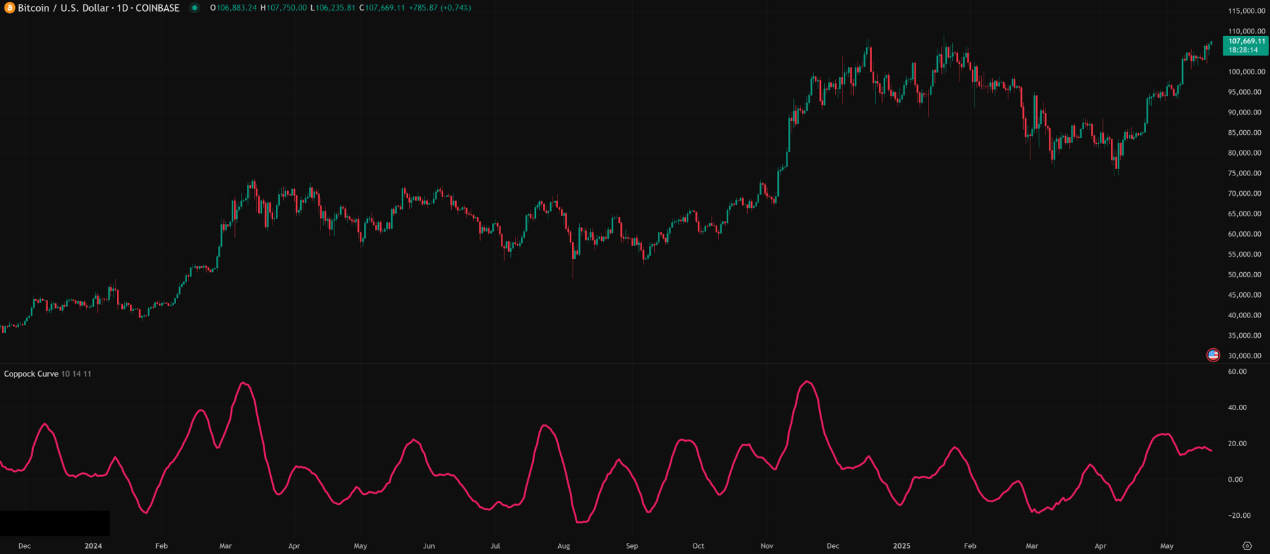
- Daily Chart:
- Highly NOT Recommended! On daily charts, the Coppock Curve behaves like any standard momentum oscillator, frequently crossing zero. An upturn from below zero might just be a minor bounce, losing all significance of catching a “generational bottom.” You’ll be flooded with false signals.
- Intraday Charts (H4, H1, M15…):
- Complete Disaster Zone! Absolutely Unusable! Applying an indicator designed for 11-14 month emotional cycles to charts spanning minutes or hours is fundamentally flawed. The results will be random noise.
「Coppock Timeframes: Monthly is King, Daily & Below Invalid」
Summary: Which Unique Parameter Combo + Timeframe is Hottest & Most Effective? How to Use It?
- Parameters: Default (14, 11, 10)! Nothing else!
- Timeframe: Monthly Chart! Nothing else!
- Hottest / Most Effective Usage = Back to Basics, Long-Term Positioning:
- Target Assets: Major stock indices (S&P 500, etc.), or assets you intend to hold for the very long term (e.g., Bitcoin monthly chart – but be aware of Crypto’s shorter history for validation).
- Chart View: Use the MONTHLY chart!
- Wait: Exercise extreme patience, waiting for the Coppock Curve to fall well below zero.
- Trigger: When the curve makes a confirmed upward turn from below zero (usually wait for the next month’s candle to confirm the turn).
- Action: Treat this signal as a timing window signal to begin considering long-term Buy and Hold or scaling into positions / DCA.
- Mindset: Understand it lags, it’s not a bottom-picking tool, but momentum-based evidence that the darkest period of the bear market might be over.
- Combine: Use with fundamental analysis, market cycle theory, or other long-term indicators.
- Ignore ALL Other Scenarios! Don’t use it for selling, don’t watch it above zero, don’t use it short-term!
Coppock Curve: The Market’s “Tide” Forecaster, Not a “Wave” Catcher
The Coppock Curve is an indicator rich with wisdom and history. It reminds us that markets have grand cycles, and catching the bottoms of these cycles requires extraordinary patience and long-term vision. Its pros:
- Unique design philosophy, incorporating emotional cycles.
- Historically decent track record at identifying major monthly bottoms in stock indices.
- Simple signal: Just look for the turn up from below zero.
But its limitations are severe:
- Extremely Lagging: Especially on monthly charts.
- Specific Purpose: Only for long-term buys, only for major bottoms.
- Specific Timeframe: Primarily monthly.
- No Sell Signals.
- Performs terribly in unintended markets/timeframes.
「Coppock Curve: The Long-Term Tide Gauge」

For young traders seeking fast action, the Coppock Curve might seem too slow and “boring.” But understanding its principles and history helps build an appreciation for market cycles and cultivates long-term thinking. Even if you don’t trade with it directly, knowing where the monthly Coppock Curve is can be valuable macro context.
Next Steps:
- Add the Coppock Curve (using default 14, 11, 10) to the MONTHLY charts of major stock indices (like SPX, IXIC) and maybe Bitcoin.
- Look back historically and see how it performed near past major bear market bottoms.
- Understand why it’s a “buy” indicator, not a sell indicator.
- Resist the urge! Don’t try to apply it to daily or shorter timeframes looking for quick wins.
- Treat it as part of your macro analysis toolkit, not a daily trading tool.
May you gain the wisdom to see the market’s grand cycles and remain calm during pivotal moments! 🧘♂️🌊📉📈