The speculator’s chief enemies are always boring from within. It is inseparable from human nature to hope and to fear
William Delbert Gann – 1949
Hello Chart-Blitz warriors!
Every crypto group is talking about DASH right now. You’ve probably watched it rocket from around $50 in mid-October to over $150, a massive 3x gain in just a few weeks.
And a thought is screaming in your head: “It’s pumped so hard, this must be the top, right? Chasing it now is just asking to get wrecked.”
That feeling is completely normal. Staring at a chart that volatile is scary. But I’m here to tell you: Don’t panic, and you don’t need a textbook to understand this. While most of the market trades on FUD (Fear, Uncertainty, Doubt), we trade on strategy.
To figure out if DASH is currently an opportunity or a trap, you only need to draw two lines on your chart and remember two “magic numbers.”
【Analysis Benchmark Statement】
- All technical analysis below is based on a price snapshot locked on Nov 5, 2025, 17:30 (UTC+8): DASH = $119.50 USD.
- This price snapshot provides a stable reference point for analysis. All support, resistance, and projected paths are relative to this benchmark. Consider this report an “analysis map,” not a real-time price feed.
The News Hype (The Rear-view Mirror): Why Is Everyone Suddenly Talking About DASH?
Lately, the broader crypto market has been gloomy. But DASH and a few other “privacy coins” have been partying, rallying hard against the trend. The news attributes this to market capital rotating to find new narratives to trade. The news tells you what is happening, but it won’t tell you what happens next. For that, we need the charts.
Magic Number 1: The Former Boss, Now Your Bodyguard ($72)
Imagine playing a video game where you couldn’t beat a specific boss for two years. In the world of DASH, $72 was that boss.
Since early 2024, every time DASH rallied near $72, it hit an invisible wall and was brutally pushed back down. This level, which we’ll call the “2-Year Ceiling,” trapped countless traders.
But in early November 2025, DASH did something monumental: it smashed through this nearly two-year-old ceiling with a single, powerful move.
According to a golden rule of technical analysis: “Old resistance becomes new support.” The strongest enemy of the past has now become our most powerful ally. Therefore, $72 is our “ultimate line of defense.” As long as the price stays above it, the long-term bullish structure remains intact.
Magic Number 2: The “Healthy Refueling Station” for the Rally ($98)
Okay, the boss has been defeated. But even heroes need to catch their breath. After such a rapid ascent, a pullback to shake out impatient speculators is perfectly healthy.
The question is, where does the pullback stop being “healthy”?
Based on chart analysis, the area around $98 is the first “healthy refueling station” for this rally.
- If DASH pulls back to the $98 area and finds support: This is an incredibly strong signal. It tells us the “breather” is over, and the next major wave of the rally is likely beginning, with potential to go far beyond the recent high.
- If it fails to hold $98: This is a warning sign. It means selling pressure is stronger than expected, and the next stop we must watch is our “ultimate line of defense” at $72.
Conclusion: Your Game Plan as a Newcomer
Forget complex indicators. Just add two numbers to your watchlist:
- Healthy Refueling Station (Short-term strength): $98
- Ultimate Line of Defense (Long-term trend): $72
As long as DASH holds above these levels, especially $98, the recent explosive move is likely just the beginning. Remember, investing is a game of knowledge, not guesswork.


Key Takeaways
Summary / Key Price Levels:
The situation for DASH is critical. Instead of guessing the direction, focus on risk management. US$98 is the only line you need to draw on your chart. If it holds, there’s a fighting chance. If it breaks, please exit immediately to protect yourself.
- Lifeline Support: US$98
- Bullish Confirmation: US$108.84
- Next Major Support: US$72
For continuous, real-time analysis of these developing market structures, visit www.chart-blitz.com.
Fundamental news tells you what happened. Technical analysis predicts what will happen. To master the professional framework that separates market signal from noise, explore our exclusive models at www.chart-blitz.com.
Sources:
- https://coinjournal.net/news/dash-coin-lead-privacy-coins-rally-as-broader-crypto-market-bleeds/
- https://coingape.com/markets/why-these-crypto-coins-are-soaring-today-dash-zec-and-icp/
- https://u.today/dash-dash-crypto-price-jumps-by-50-in-one-day-possible-reasons
- https://invezz.com/news/2025/11/04/privacy-coins-defy-crypto-crash-decred-dash-and-zcash-lead-stunning-rally/
Unlocking Technical Analysis: Power Moves with Diagrams !
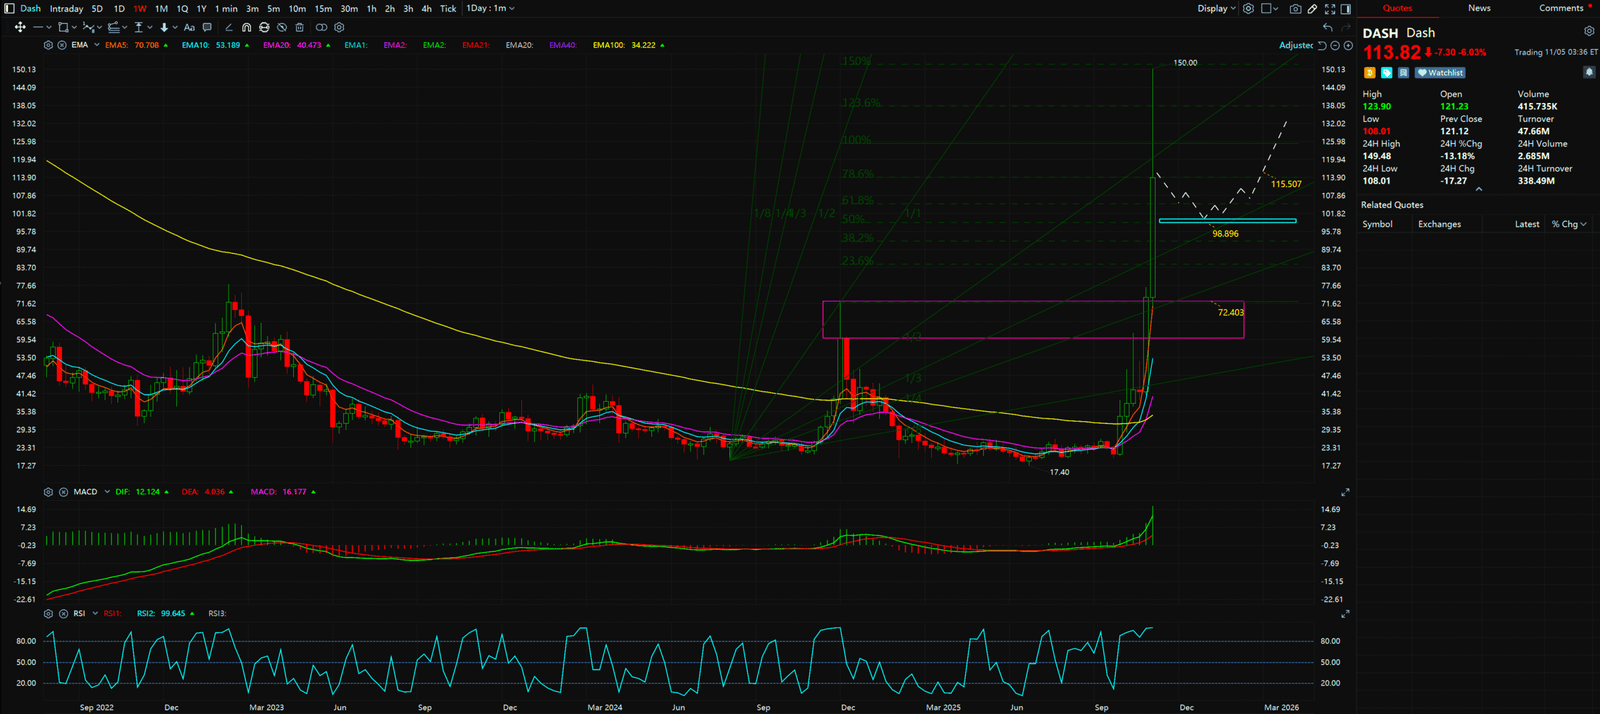
Weekly Timeframe for Dash (DASH)
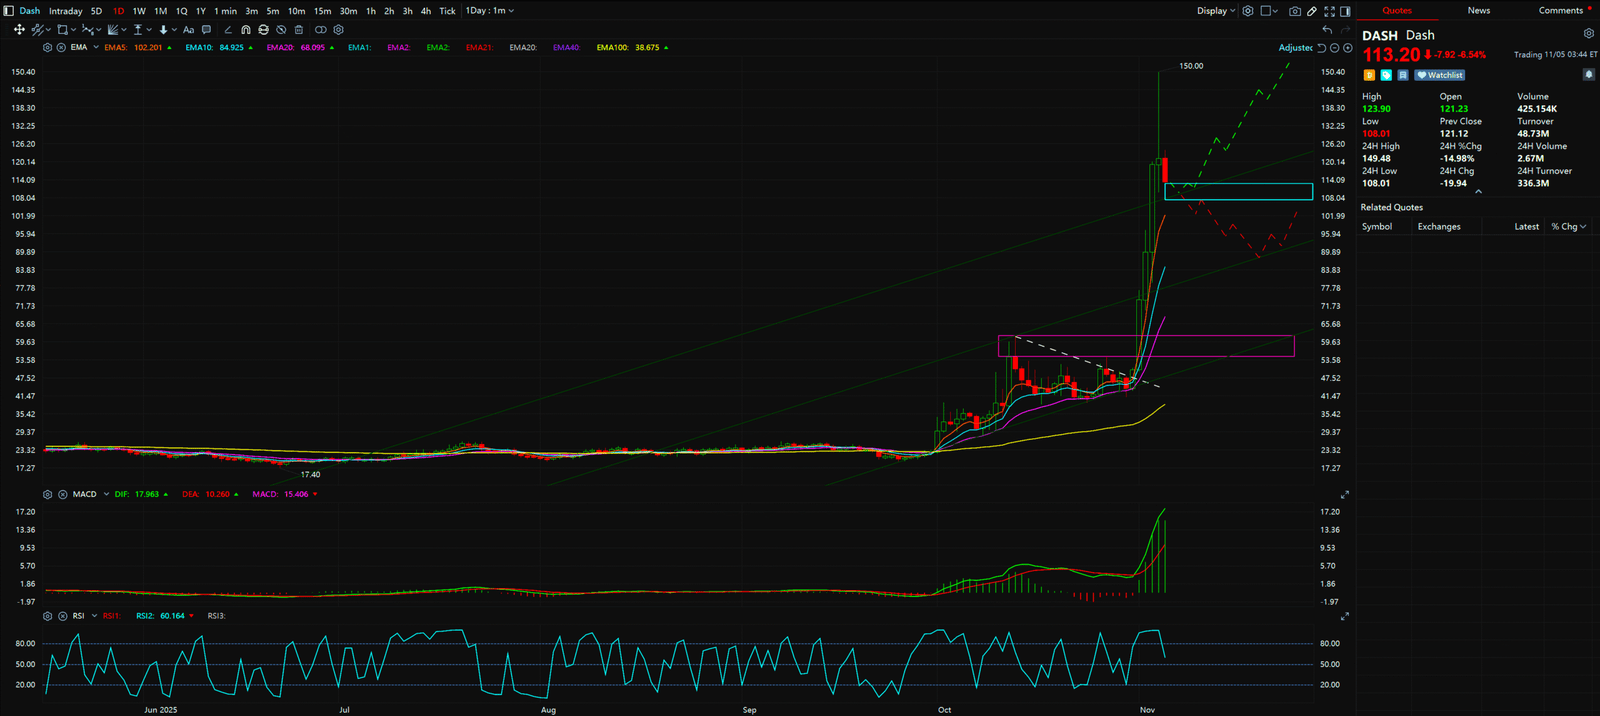
Daily Timeframe for Dash (DASH)