When you make a trade, you should have a clear target of where you expect to get out
William Delbert Gann – 1949
In my 20 years of banking and trading, I’ve seen retail traders make the same mistake over and over again: Trading with their eyes on the news and their emotions on their sleeves, while completely ignoring the math.
The price action of BNB (Binance Coin) over the last few days is a textbook case study. The headlines are filled with regulatory FUD and whale movements, causing extreme fear in the market. Many retail traders were shaken out around $930, thinking a crash was imminent. But if you look through an institutional lens, you see the exact opposite—not a crash, but a carefully orchestrated “Liquidity Hunt” followed by “Algo Accumulation.”
Today, I’m going to cut through the noise and dissect the BNB charts. No vague predictions—just math, logic, and how Smart Money is using the $930 level to harvest retail liquidity.
【Analysis Benchmark Statement】
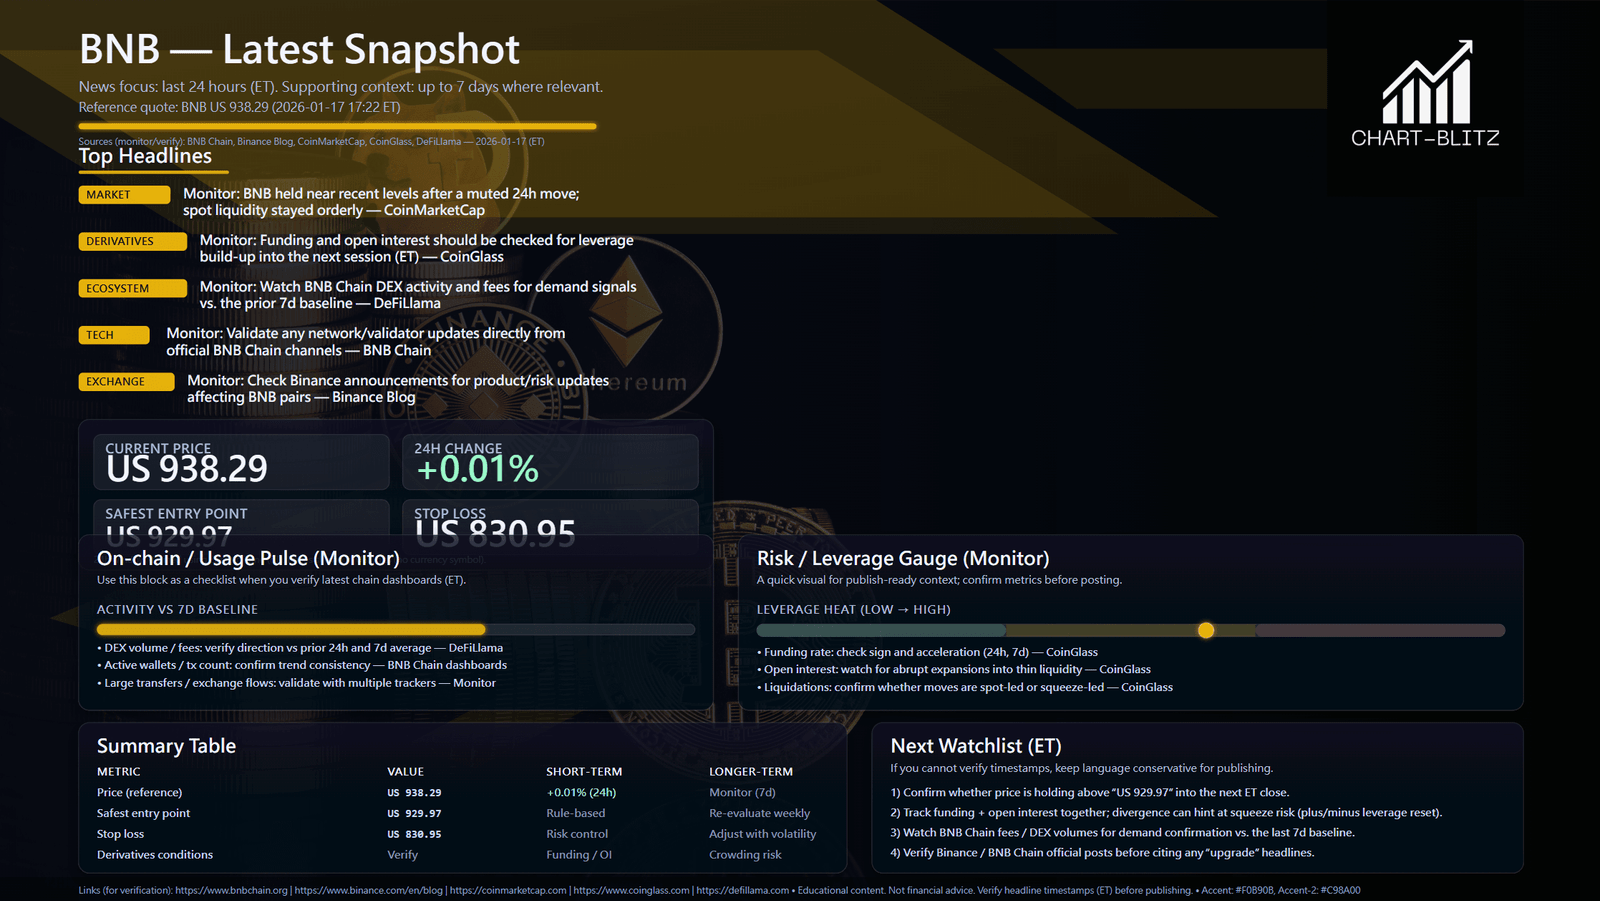
To ensure analytical rigor, all technical judgments below are based on the price snapshot locked on 2026-01-17, 16:36 (HKT): BNB = 936.50 USD. This snapshot provides a stable reference point. All support, resistance, and projected paths are relative to this benchmark. Market prices change instantly; please view this report as an ‘analytical map,’ not a real-time quote.
Catalysts & Fundamental View (Rearview Mirror – Filtering Noise)
First, we must learn to filter “noise.” In the last 24 hours, Google News has been buzzing with reports of “Crypto Whales shifting funds to low-cap tokens on BSC” and “Bitcoin consolidating at $95,000.” The retail interpretation? “Whales are leaving! BNB is going to dump!” The institutional interpretation? “Whales aren’t leaving the ecosystem; they are sector rotating. As the Gas Token of BSC, more on-chain activity actually drives more demand for BNB.” News is often lagging or designed to mislead. The true catalyst isn’t the headline; it’s how price reacts to key levels. When bad news hits but price refuses to drop, that is the strongest Bullish Signal of all.
Multi-Timeframe Technical Deep Dive (Predictive Lens – The Banker’s View)
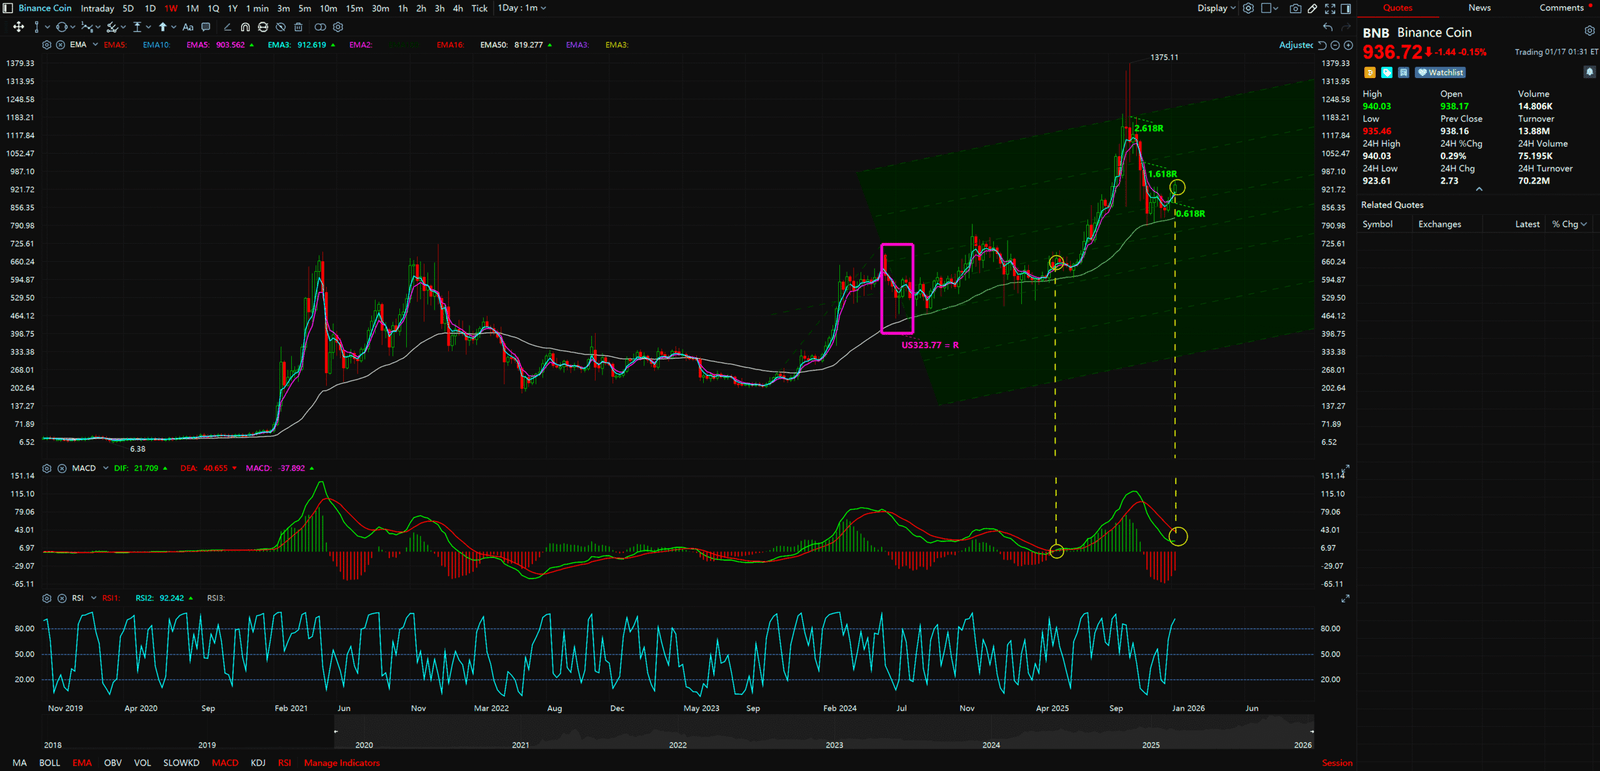
1. The Weekly Chart: Schiff Pitchfork & The Algo Defense Line Look closely at the weekly chart provided. This isn’t just a random uptrend; it’s a perfect Schiff Pitchfork formation.
- Institutional Mindset: Bank Algo Trading systems are often programmed to trigger buy orders at the median lines or key ratios of a Pitchfork.
- Key Discovery: Using the pivot points from the Oct 2023 start, the June 2024 peak, and the Aug 2024 low, we draw the Pitchfork. You will be shocked to see that the current price has retraced exactly to the 0.618R level (approx. $923 – $930).
- Interpretation: 0.618 is the Golden Ratio—the equilibrium point of nature and markets. Finding support here is no accident. It means the long-term bullish structure (Higher Highs, Higher Lows) remains completely intact. As long as this line holds, the macro bull thesis is solid
Weekly Timeframe for BNB Binance Coin
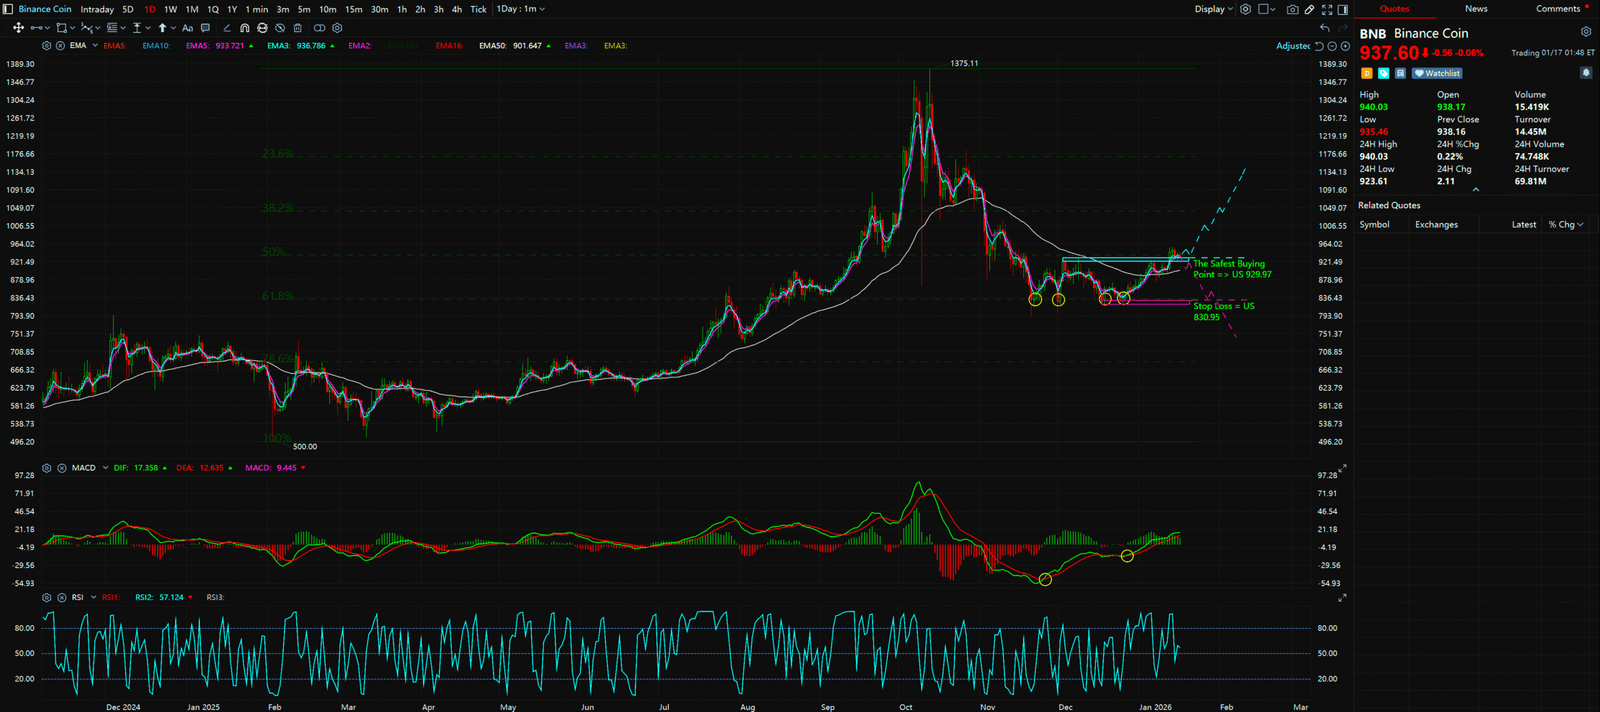
2. The Daily Chart: Fibonacci & MACD “Silent Divergence” Switching to the daily chart reveals the subtle footprints of Smart Money.
- The Golden Retracement: Measure the entire rally from the early 2025 low of $500 to the $1375 peak. The recent correction bottomed around $830, which sits precisely on the 61.8% Fibonacci Retracement.
- Weekly at 0.618. Daily at 61.8%. When mathematical ratios from different timeframes overlap at the same price, we call this “Confluence.” This is where institutions place their heaviest bets.
- MACD Bullish Divergence: This is the indicator that betrays the whales. In late December, BNB price made a lower low (testing $830), creating a “breakdown” trap to scare retail. However, the MACD indicator made a higher low.
- This is a “Bullish Divergence.” It means downward momentum is exhausted, selling is purely retail panic, and Smart Money is quietly accumulating.
Daily Timeframe for BNB Binance Coin


Synthesis & Unique Insight
The True Meaning of the $929.97 Breakout Combining the Weekly and Daily views, the script is clear: The market has undergone a two-month “Washout.” Whales used the $830-$900 zone to shake out weak hands. The most critical signal right now is this: BNB has officially broken out above the “Resistance Zone” of USD 929.97. This isn’t just a number; it’s a confirmation of a “Market Structure Shift.”
- Before Breakout: The market was in “Left Side” trading (uncertainty).
- After Breakout (Now): The market is in “Right Side” trading. Resistance has flipped to Support. $930 is now the institutional “Line in the Sand.”
Key Takeaways
Summary / Key Levels: As an ex-banker, I won’t tell you to “All-in.” I will teach you to manage risk.
⛔ Critical Support (Stop Loss / The Line of Death): USD 830.95
- This is the hard deck. If this breaks, the institutional thesis is invalid, and you must cut losses without hesitation. But until then, dips are for buying.
🛡️ The Safe Entry (The Banker’s Trigger): > USD 929.97
- Action Guide: At the current price (~$936), if it holds above $930 for 3 consecutive days, it is a prime entry. Entering here, your win rate increases exponentially. You aren’t buying cheap coins; you are buying a “Confirmed Trend.”
🎯 Capital Allocation:
- Consider deploying 10-15% of capital at current levels. Add more only after confirmation of the support hold.
Our goal is not to provide a crystal ball, but to offer a clear, logical, and actionable framework by simplifying professional analysis.
Summary: Don’t Be Exit Liquidity
Fundamental news tells you what happened. Technical analysis predicts what will happen. Don’t gamble your future on a “maybe”. Your capital is your ammunition. Don’t spray and pray.
Unlocking Technical Analysis: Power Moves with Diagrams !
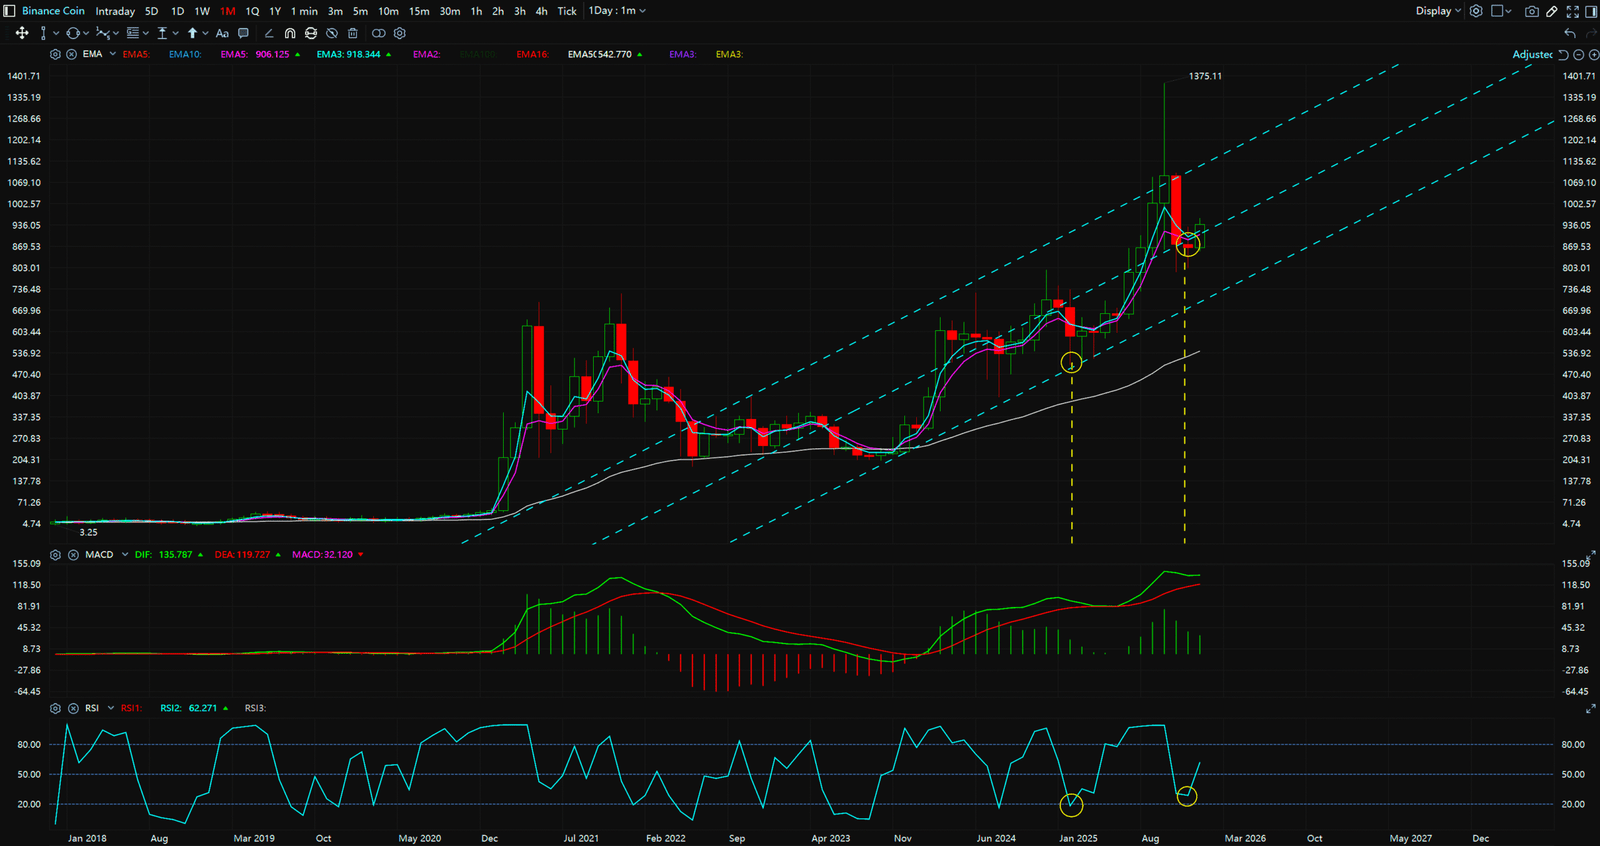
Monthly Timeframe for BNB Binance Coin
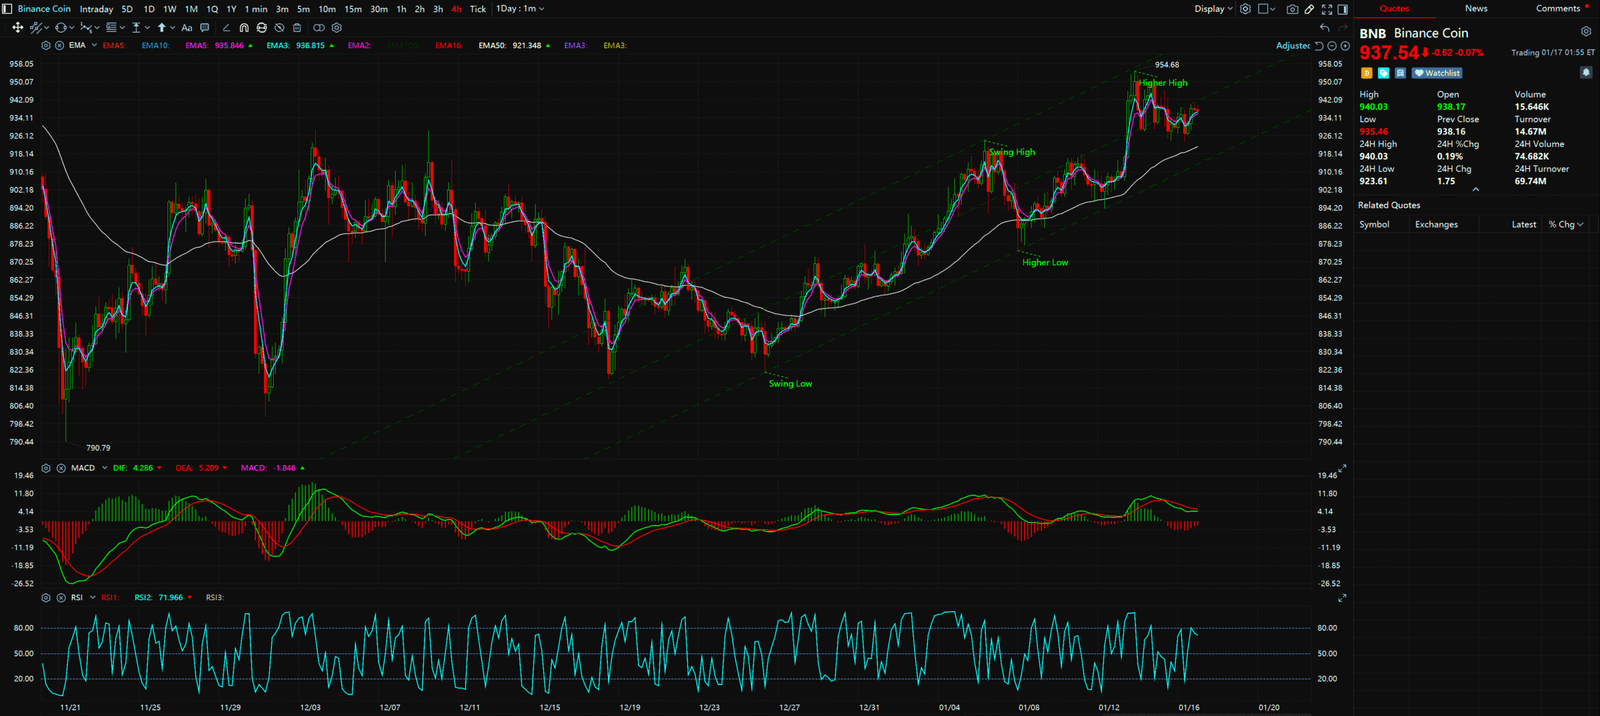
4-Hour Timeframe for BNB Binance Coin
Charts don’t lie, but you have to learn their language. See our full, interactive chart breakdown at www.chart-blitz.com.
Fundamental news tells you what happened. Technical analysis predicts what will happen. To master the professional framework that separates market signal from noise, explore our exclusive models at www.chart-blitz.com.
Sources:
- https://crypto2community.com/crypto-news/best-cryptocurrencies-to-buy-today-january-16-eth-link-bnb/
- https://www.msn.com/en-us/money/markets/crypto-whales-shift-to-low-priced-bsc-solana-tokens-as-btc-eth-consolidate/ar-AA1UlnTH
- https://coinmarketcap.com/currencies/bnb/
【Disclaimer】 The content herein is for educational purposes and reflects the author’s personal opinion only; it is not investment advice. All financial investments, including cryptocurrencies, carry significant risk, and you could lose your entire capital. To support this site, this article may contain affiliate links. While we strive for accuracy, we cannot guarantee all information is complete or error-free. Please conduct your own research and be fully responsible for your own investment decisions.