The speculator’s chief enemies are always boring from within. It is inseparable from human nature to hope and to fear
William Delbert Gann – 1949
Dogecoin (DOGE) has recently recaptured the market’s spotlight, with discussions around a potential Exchange-Traded Fund (ETF) propelling its price to new heights. While the market is dominated by headlines, savvy investors turn their attention to the charts, where the real clues about the market’s future path are hidden.
Analysis Benchmark Statement All technical analysis below is based on a price snapshot locked in on Sep 13, 2025, 13:14 (UTC+8): DOGE = $0.28102 USD. This price snapshot provides a stable reference point for analysis. All support, resistance, and projected paths are relative to this benchmark. Market prices are volatile; readers should treat this report as an “analytical map,” not a real-time quote.
The Catalyst & Fundamental View (The Rear-view Mirror) Over the past 24 hours, news about the first potential DOGE ETF has been the primary market driver. Despite reports of a slight delay in its launch, this anticipation has successfully ignited speculative fervor. Fundamentally, this type of news is a classic “catalyst.” It attracts massive attention and capital inflow, explaining why the price suddenly became active. However, it offers no information on trend sustainability or key price levels.
The Predictive Lens: A Multi-Timeframe Technical Deep Dive
Multi-Timeframe Technical Deep Dive (The Predictive Lens) This is the core section. Our analysis is strictly based on the user-provided charts:
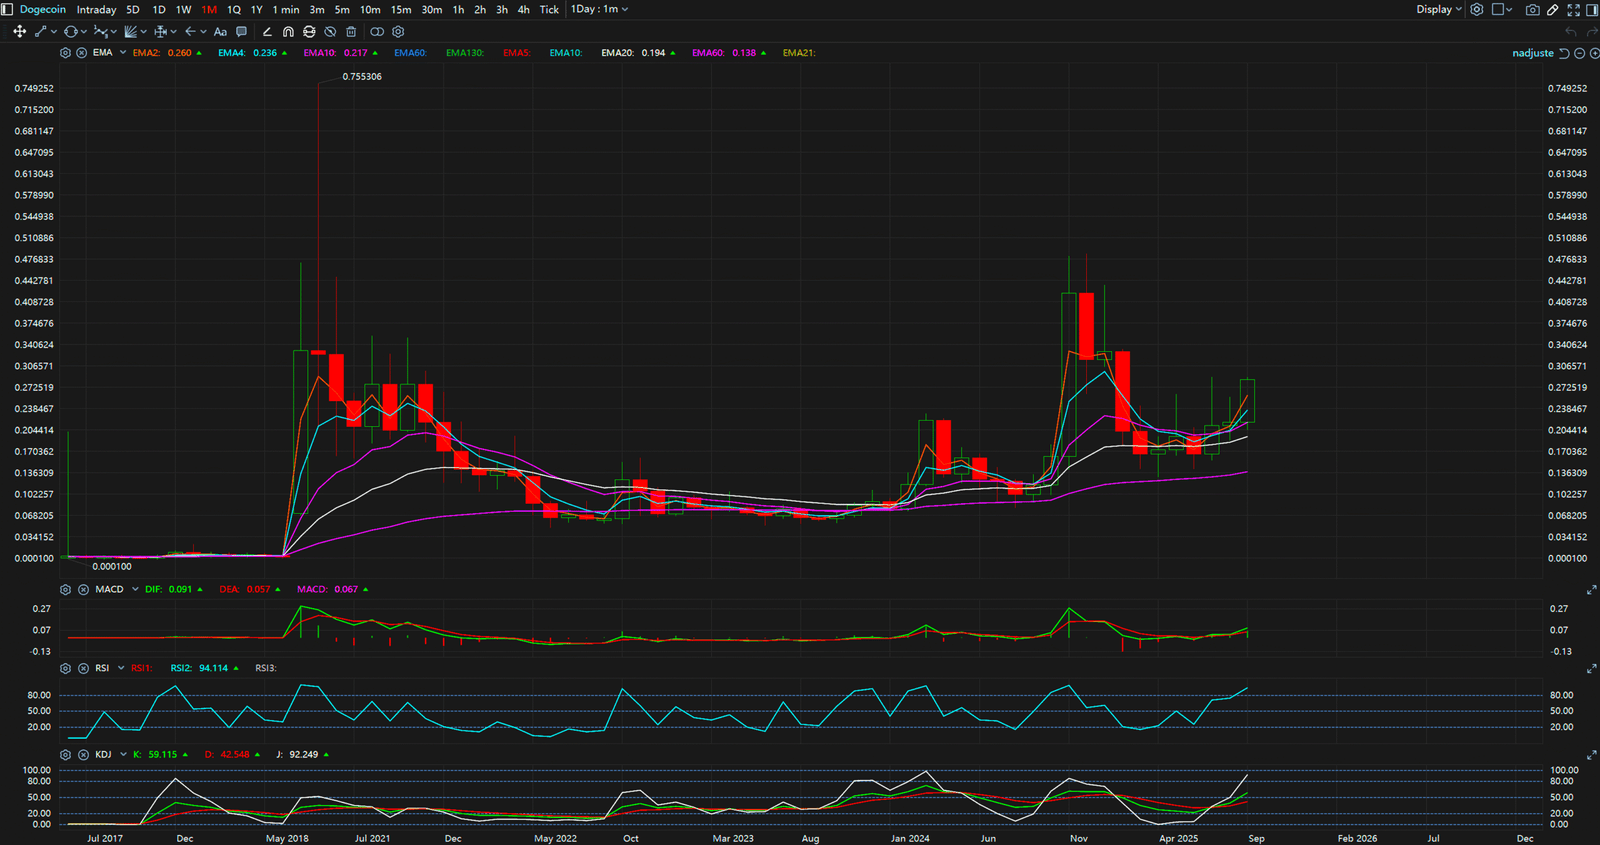
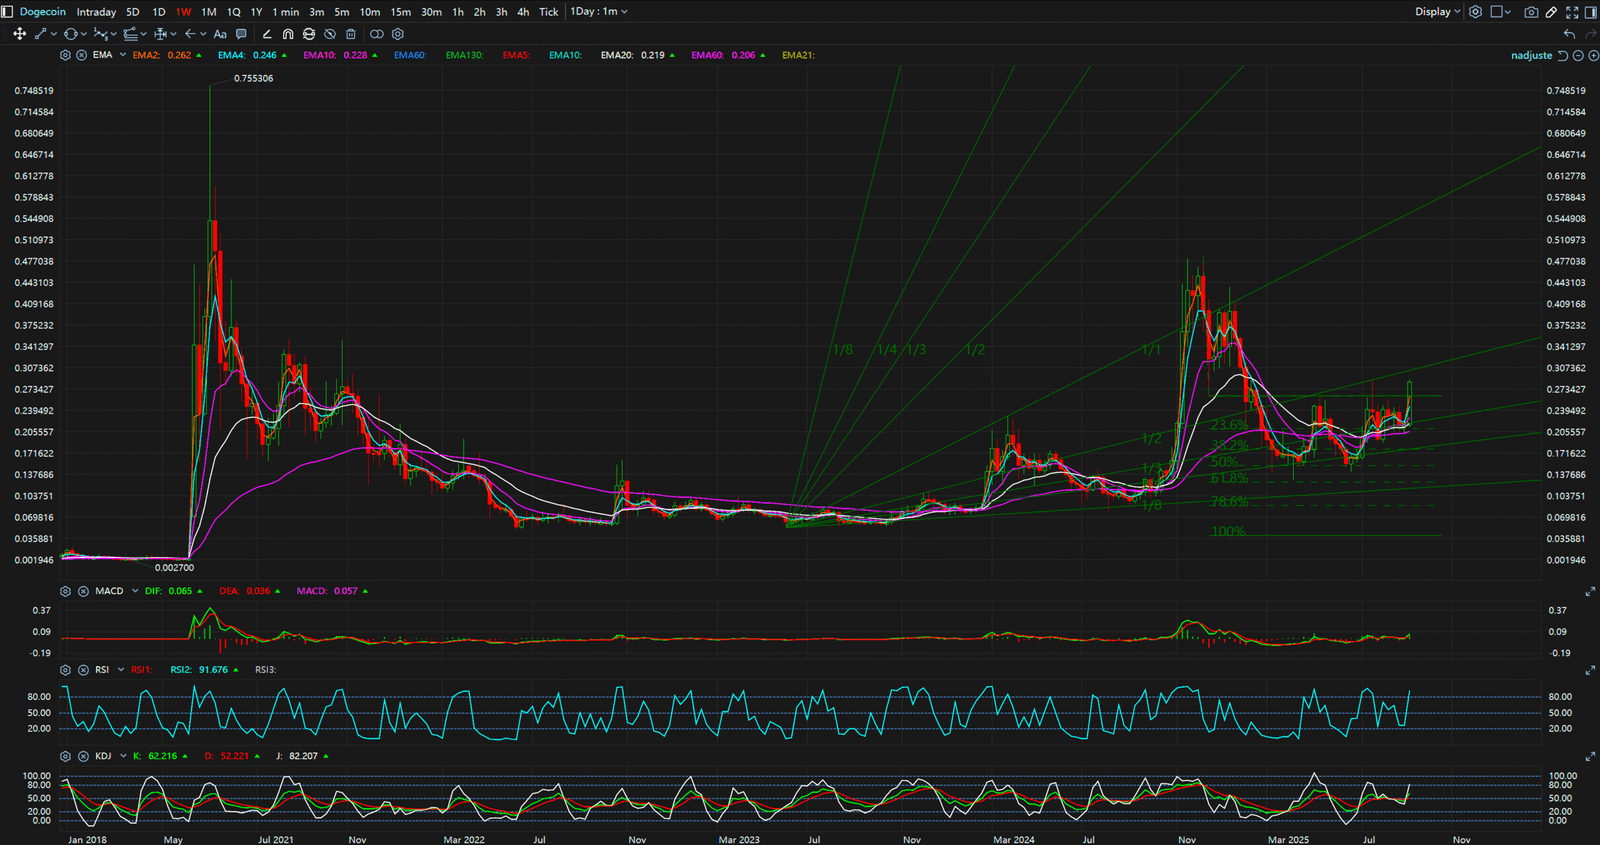
- Macro Perspective (Monthly/Weekly Charts): From the user-provided weekly chart, it’s clear that DOGE has broken out from a long-term downtrend formed since its 2021 peak. More importantly, between late 2023 and 2025, the price has formed a distinct market structure of “Higher Highs” and “Higher Lows.” This is the most fundamental criterion for defining an uptrend in technical analysis. The price is currently above all key Exponential Moving Averages (EMAs), indicating very strong long-term momentum.
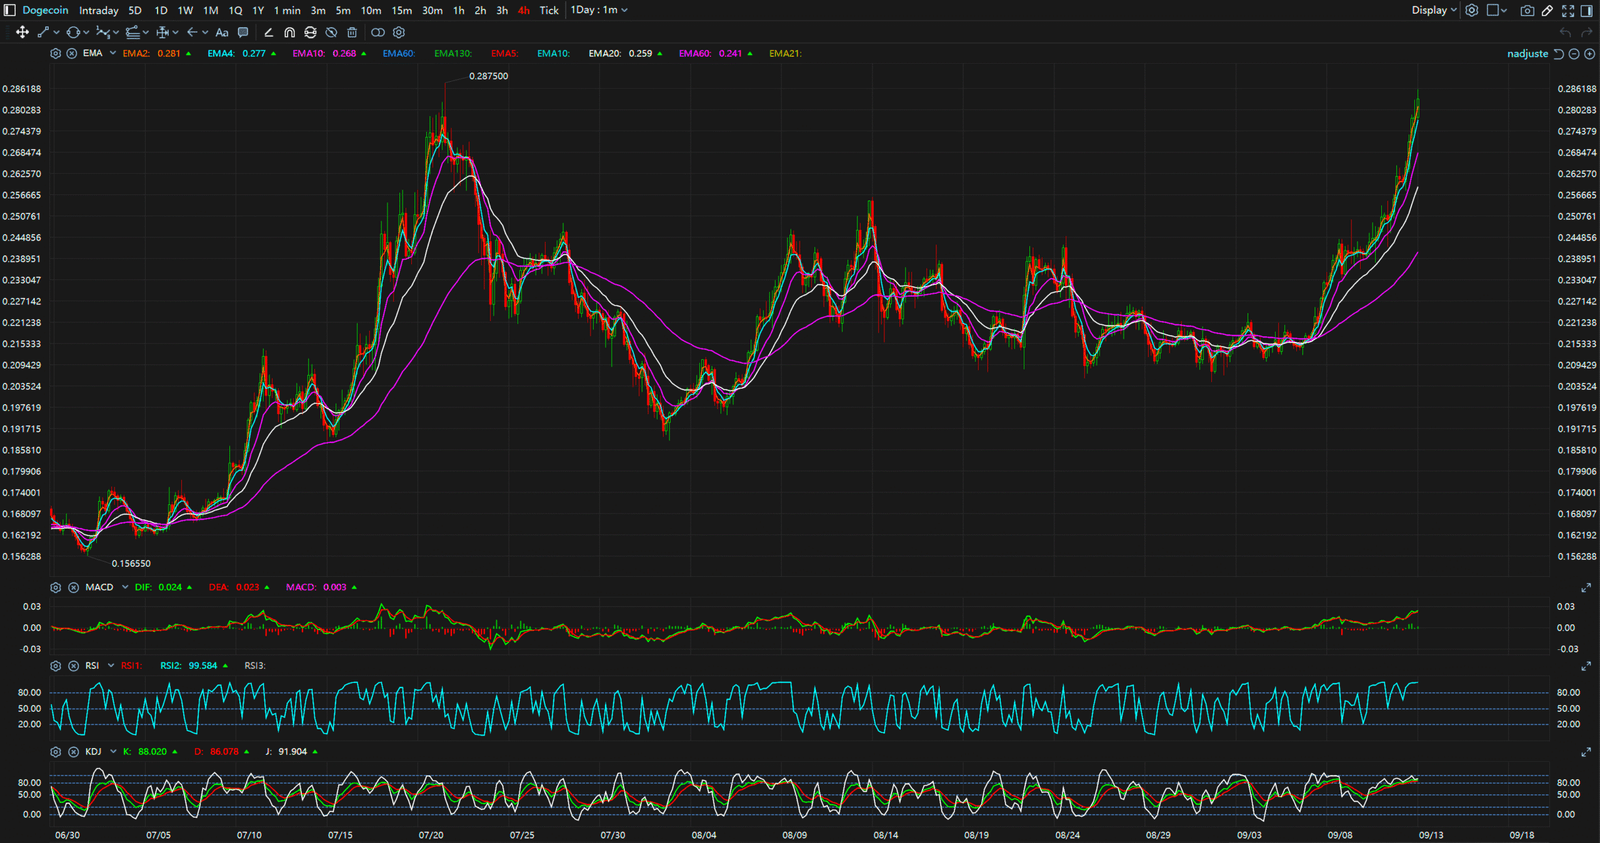
- Intermediate Structure (4-Hour Chart): Switching to the 4-hour chart, a healthy ascending channel is evident. On pullbacks, the price has repeatedly found support near the EMA10 and EMA20 before breaking upwards again, forming a textbook “higher highs, higher lows” progression. The most recent consolidation occurred around $0.2500, followed by a strong breakout, showing that buyers are in full control. As long as the price remains within this channel, the intermediate trend remains bullish.
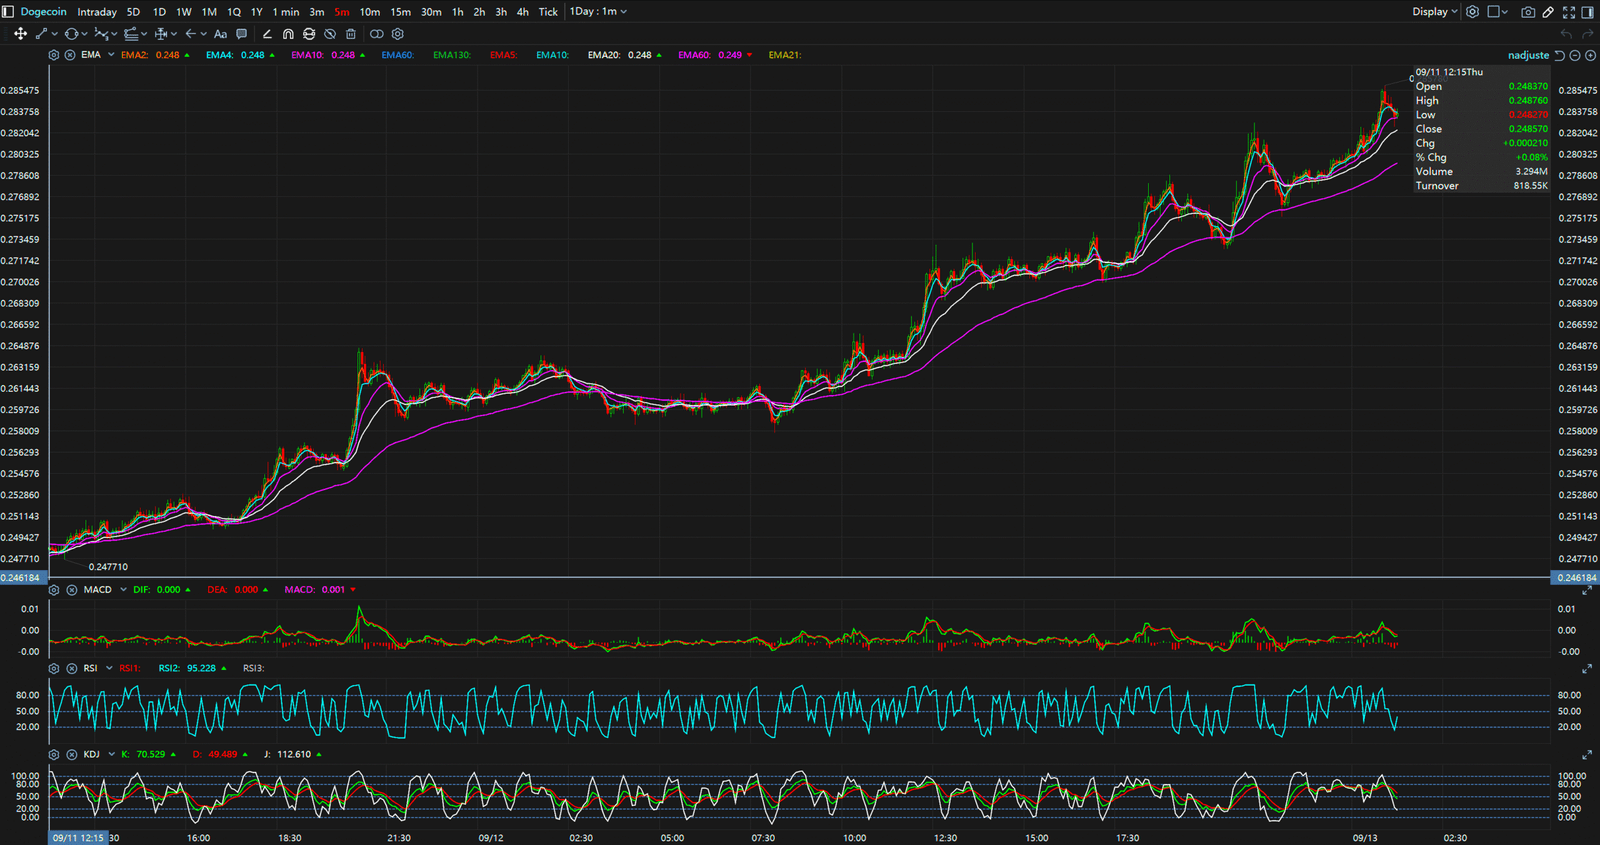
- Micro Dynamics (5-Minute Chart): However, the 5-minute chart reveals another side of the story. After the recent rapid ascent, the Relative Strength Index (RSI) has soared above 90, entering a severely overbought territory. This is a clear signal that short-term buying pressure may be nearing exhaustion, and the market needs time to consolidate sideways or pull back slightly to build energy for the next leg up.
Synthesis and The Professional’s Viewpoint
The “trend alignment” across timeframes, coupled with “micro-divergence,” is the key insight of this analysis. The macro bull structure on the monthly and weekly charts provides confidence for long-term holders. The solid ascending channel on the 4-hour chart gives trend traders direction and dynamic support levels. Meanwhile, the overbought signal on the 5-minute chart warns short-term traders against chasing the pump at current highs, advising patience for a pullback to safer support zones.


Key Takeaways
Based on the integrated chart analysis, the overall outlook for DOGE is bullish, but a short-term correction is needed.
- Key Support Levels: $0.2650 (recent breakout point on 4H chart), $0.2500 (previous consolidation zone on 4H chart)
- Key Resistance Levels: $0.2880 (recent high), $0.3000 (psychological barrier)
For continuous, real-time analysis of these developing market structures, visit www.chart-blitz.com.
Fundamental news tells you what happened. Technical analysis predicts what will happen. To master the professional framework that separates market signal from noise, explore our exclusive models at www.chart-blitz.com.
Sources:
- https://www.msn.com/en-us/money/other/dogecoin-surges-despite-etf-launch-delay-to-new-date/ar-AA1MoZGp
- https://cryptonews.com/news/dogecoin-price-prediction-etf-launch-could-spark-meme-supercycle-will-doge-be-the-first-to-fly/
- https://coingape.com/trending/crypto-market-update-why-is-sol-bnb-doge-price-soaring-high-today/
Unlocking Technical Analysis: Power Moves with Diagrams !
Monthly Timeframe for Dogecoin (DOGE)
Weekly Timeframe for Dogecoin (DOGE)
4-Hour Timeframe for Dogecoin (DOGE)
5-Minutes Timeframe for Dogecoin (DOGE)