The speculator’s chief enemies are always boring from within. It is inseparable from human nature to hope and to fear
William Delbert Gann – 1949
Recently, market discourse surrounding Dogecoin (DOGE) has reached a fever pitch, with headlines celebrating its overtaking of major rivals and analysts issuing optimistic price targets like $0.30 and $0.40. However, fundamental news merely provides the “what” to analyze; true trading decisions must be based on rigorous technical analysis to understand the “when” and “how” of market movements.
Analysis Benchmark Statement: All following technical analysis is based on a price snapshot locked in on October 6, 2025, 14:55 (UTC+8): DOGE = $0.2543 USD. This price snapshot provides a stable reference for analysis. All support, resistance, and projected paths are relative to this benchmark. Market prices are volatile; readers should treat this report as an “analytical map,” not a real-time quote.
Catalysts & Fundamental View (The Rear-view Mirror): Over the past 24 hours, DOGE has undoubtedly been the market’s darling. Its price surged, briefly surpassing XRP in market capitalization to become the 8th largest cryptocurrency. Media and social platforms are awash with bullish predictions. This collective optimism provides DOGE with powerful market attention. However, this news-driven enthusiasm is often a double-edged sword; it can accelerate a trend or create a trap before a key technical resistance.
The Predictive Lens: A Multi-Timeframe Technical Deep Dive
Multi-Timeframe Technical Deep Dive (The Predictive Lens) The core of this analysis comes from interpreting the provided weekly and daily charts.
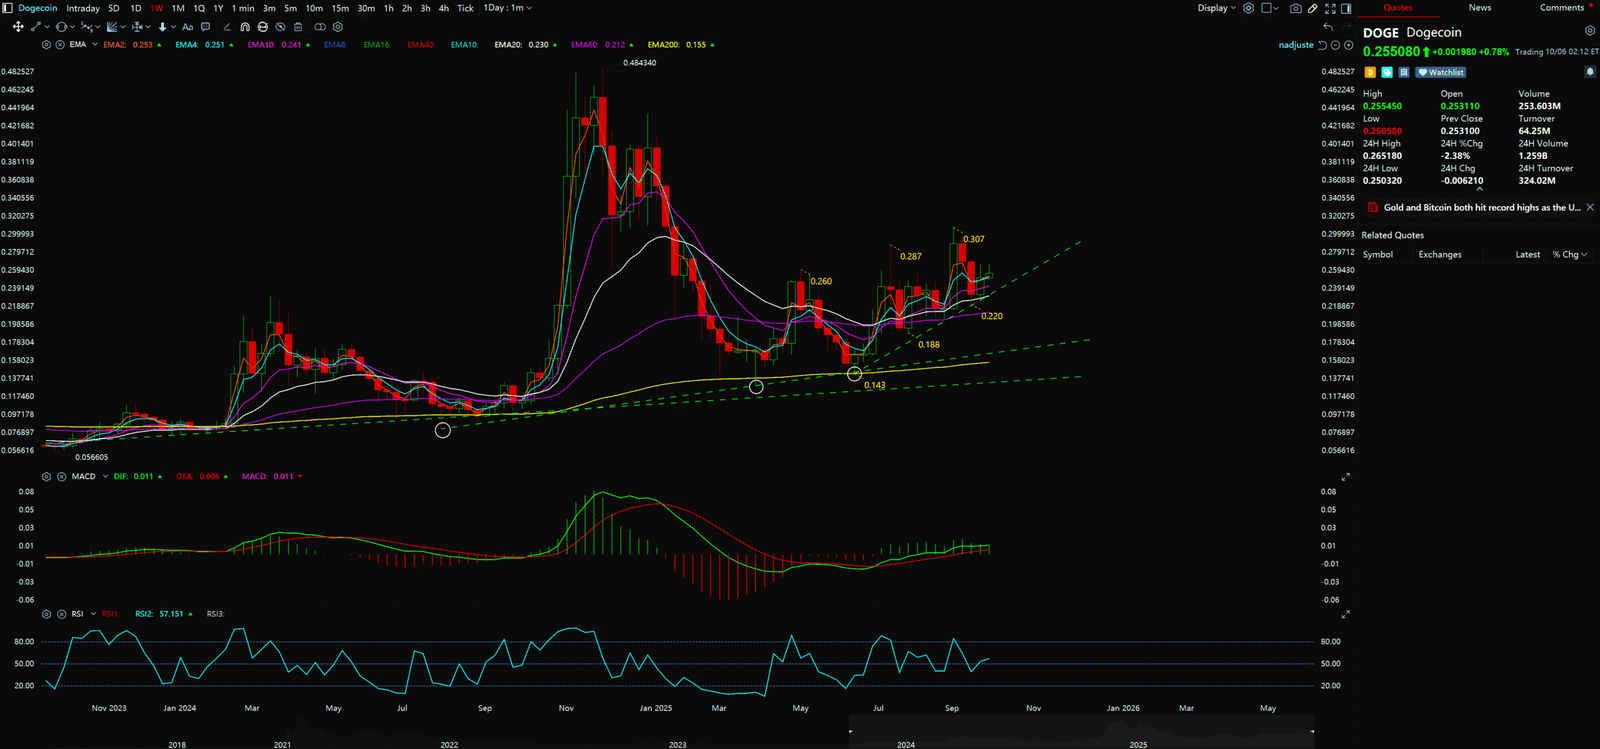
- The Weekly Chart (Macro Structure): Confirming the Long-Term Uptrend From the provided weekly chart, a very healthy macro uptrend structure is clearly visible. The price action perfectly exhibits a pattern of “Higher Highs and Higher Lows.” Specifically, after peaking around $0.287, the price corrected to establish a “Higher Low” at approximately $0.188, then broke out again to set a “Higher High” near $0.307. The current price is bouncing from another higher low around $0.22, which perfectly aligns with your initial analysis. More critically, the long-term ascending trendline, formed by the swing low of June 2025 and the higher low of August, continues to provide solid dynamic support. Concurrently, on the weekly MACD indicator, both the fast and slow lines are above the zero axis, with the fast line (blue) above the slow line (orange), confirming that the long-term trend is in a strong bullish development phase.
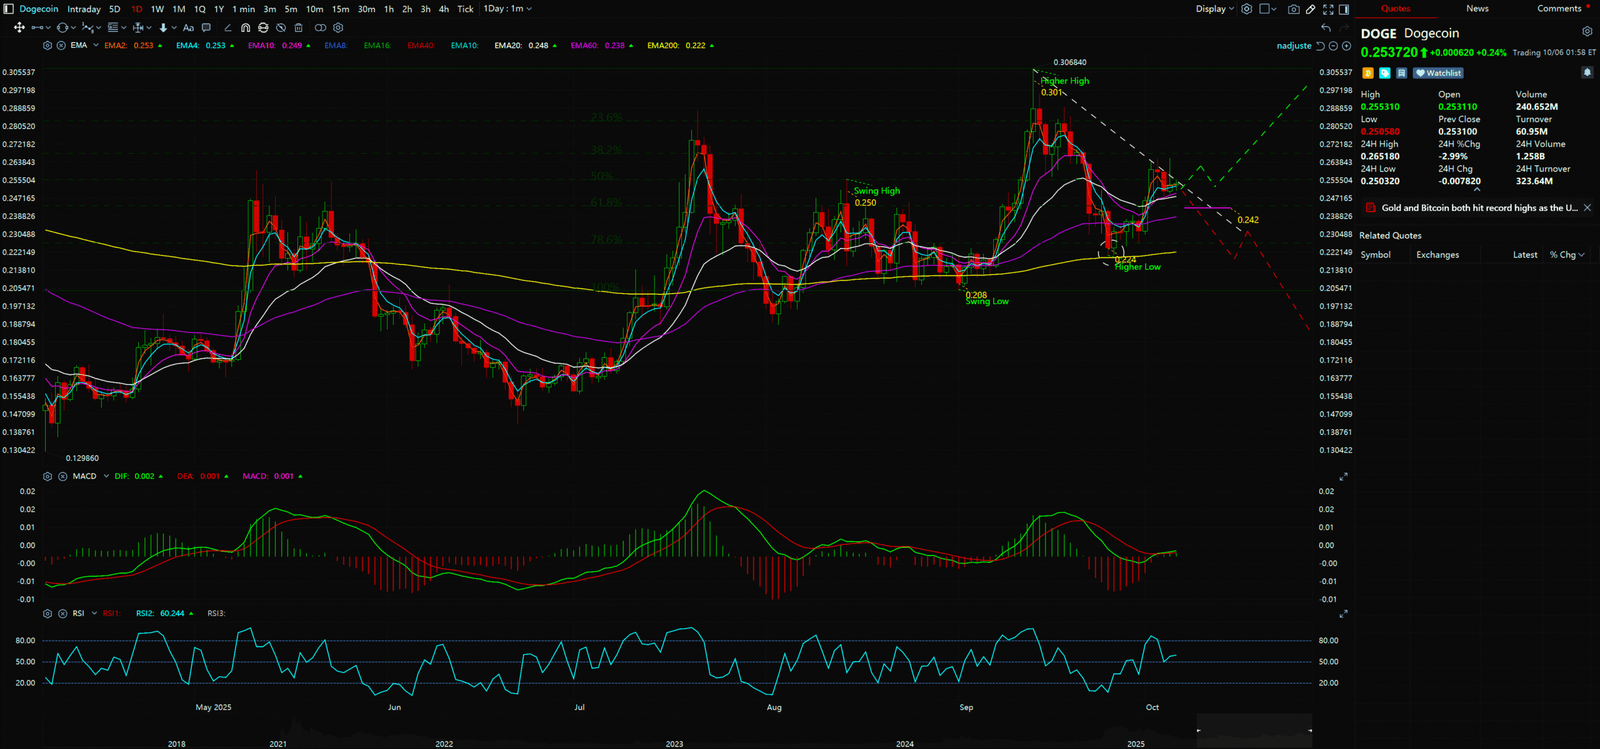
- The Daily Chart (Short-Term Tactics): At a Critical Decision Apex Switching to the daily chart reveals a more nuanced but crucial picture. While the long-term trend is positive, DOGE is currently being suppressed by a short-term descending trendline. This line connects the recent high of $0.306 with the subsequent lower high of $0.26. Currently, the price is being squeezed between the “long-term ascending support” and the “short-term descending resistance,” forming a narrowing apex. Our locked-in price of $0.2543 USD is right at the vertex of this triangle. This is a classic “decision point”:
- Bullish Breakout Scenario: If the price can break out with volume and close above the daily descending trendline (approximately in the $0.255 – $0.260 range), it would signal the end of the short-term correction and the continuation of the weekly-level uptrend. This would open the door to challenge the previous high of $0.307 and even higher targets (like the $0.30-$0.40 predicted in the news).
- Bearish Breakdown Scenario: Conversely, if the price fails to break out and instead breaks down below the weekly ascending trendline below (currently around the $0.22 – $0.23 range), the macro uptrend structure would be threatened, potentially triggering a deeper correction.
Synthesis Analysis & Unique Insight
The weekly and daily charts present a classic divergence: “long-term bullish, short-term undecided.” The weekly chart gives us the “reason” to hold, while the daily chart provides the “timing” to enter or exit. The current optimistic news provides fuel for a potential upward breakout. However, any attempt to chase the price before a valid breakout above the daily descending resistance carries significant risk. The most professional approach is to wait for the market to give a clear signal—the breakout from the aforementioned apex.


Key Takeaways
Summary / Key Price Levels:
- Primary Resistance (Must Break): $0.255 – $0.260 (Daily descending trendline)
- Secondary Resistance: $0.307 (Previous swing high)
- Primary Support (Must Hold): $0.220 – $0.230 (Weekly ascending trendline)
- Secondary Support: $0.188 (Previous swing low)
For continuous, real-time analysis of these developing market structures, visit www.chart-blitz.com.
Fundamental news tells you what happened. Technical analysis predicts what will happen. To master the professional framework that separates market signal from noise, explore our exclusive models at www.chart-blitz.com.
Sources:
- https://www.benzinga.com/crypto/cryptocurrency/25/10/48034903/dogecoin-overtakes-xrp-to-end-week-8-higher-doge-to-hit-30-cents-soon-here-is-what-this-analyst-says
- https://www.msn.com/en-us/money/savingandinvesting/doge-predicted-to-hit-0-40-soon-but-traders-debate-this-best-crypto-will-hit-1-before-the-next-bull-cycle/ar-AA1NTTSr
- https://blockonomi.com/best-altcoins-to-buy-dogecoin-and-paydax-take-center-stage-with-100x-rally-predictions/
Unlocking Technical Analysis: Power Moves with Diagrams !
Weekly Timeframe for Dogecoin (DOGE)
Daily Timeframe for Dogecoin (DOGE)