The speculator’s chief enemies are always boring from within. It is inseparable from human nature to hope and to fear
William Delbert Gann – 1949
Introduction: The Great Deception
Are you feeling the FOMO yet? With Ethereum (ETH) reclaiming $2,900, the headlines are screaming “Bull Market,” and your favorite influencers are posting rocket emojis. Your finger is hovering over the “Buy” button, terrified of being left behind.
STOP. Take a breath.
I spent 20 years on bank trading desks, managing flows that would make your head spin. And I am telling you right now: What you are feeling is exactly what they engineered.
To a professional eye, this chart is not a recovery; it is a textbook “Liquidity Trap.” While retail investors chase the green candles, Smart Money is using your greed to unload their heavy bags. Why do retail traders always buy at the top? Because you trade what you feel, while institutions trade what they calculate. This article is not just an analysis; it is a warning. I am going to expose the institutional playbook for ETH and reveal the shocking “Ultimate Bottom” that the algorithms are targeting: $1,462.
【Analysis Benchmark Statement】
All technical analysis below is based on the price snapshot locked on December 19, 2025, at 01:01 ET: ETH = 2919.07 USD. Please view this report as an “analytical map,” not a real-time quote.
Catalyst & Fundamental View (Rearview Mirror): The News is the Bait
ETH is up 3.20% in 24 hours. The news is full of blockchain upgrades and DeFi adoption. But here is a rule from the trading floor: “News provides the narrative; Liquidity provides the exit.”
When a whale wants to sell $100 million worth of ETH, they can’t just dump it. They need buyers. They need you. Positive news creates a surge of retail buying pressure—a “Dead Cat Bounce”—which provides the perfect liquidity for institutions to sell into. They are selling to you.
Multi-Timeframe Technical Deep Dive (The Predictive Lens): Decoding the “Institutional Algorithm”
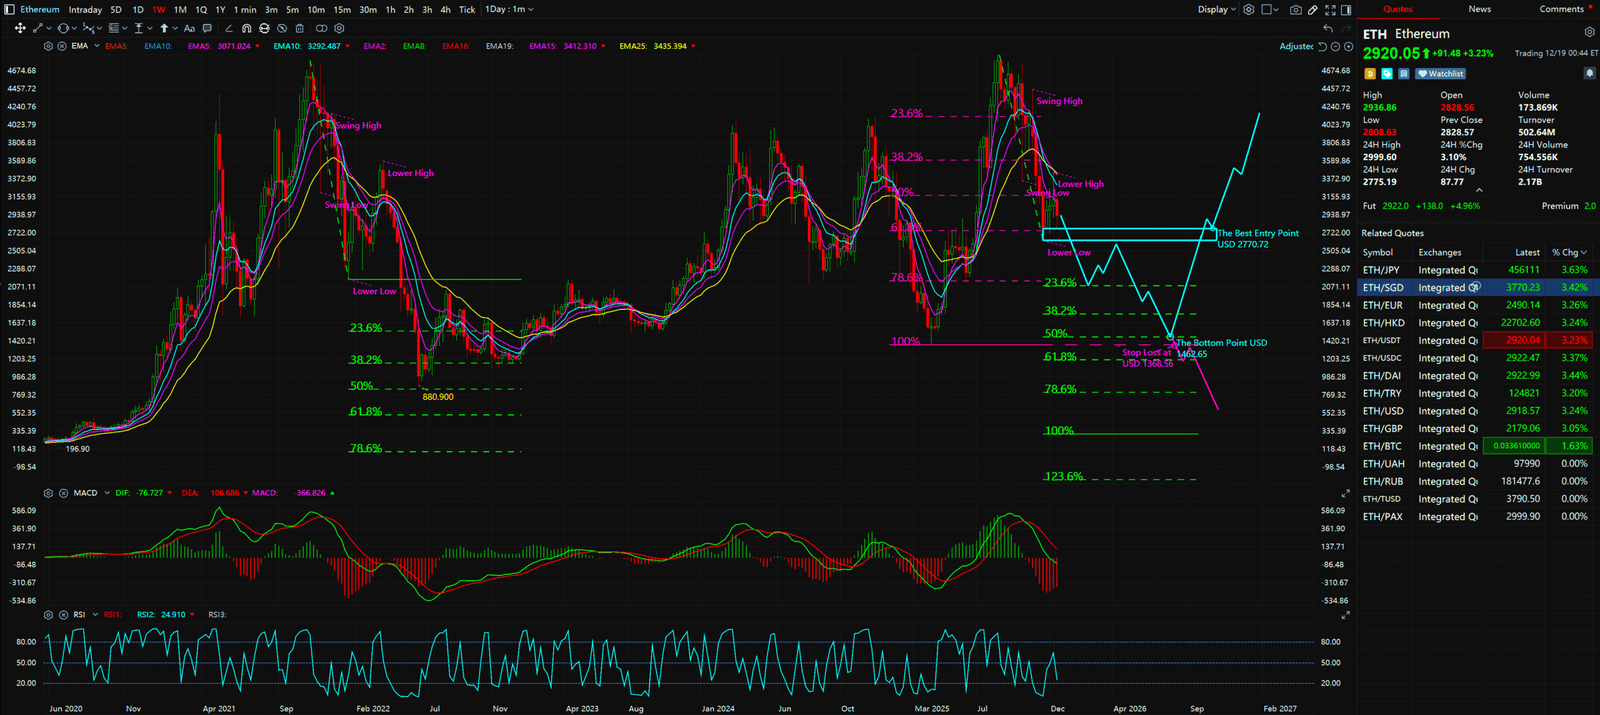
【The Weekly Chart & The Fibonacci “Kill Zone”】
Let’s look at the math. The Weekly Chart shows a brutal structure of “Lower Highs.” Every rally is weaker than the last. The trend is undeniably down.
But the real horror story is in the Trend-based Fibonacci Extension. This tool is the backbone of algorithmic trading systems.
- The History: In the 2022 crash, ETH bottomed exactly at the 50% Extension level.
- The Prediction: Applying the same model to the 2025 drop, the algorithm points to a new target: $1,462.65.
From $2,919 to $1,462 is a 50% drop. Institutions are patient. They will wait for the price to hit this “mathematical value zone” while retail traders exhaust their capital trying to catch the falling knife at $2,500.
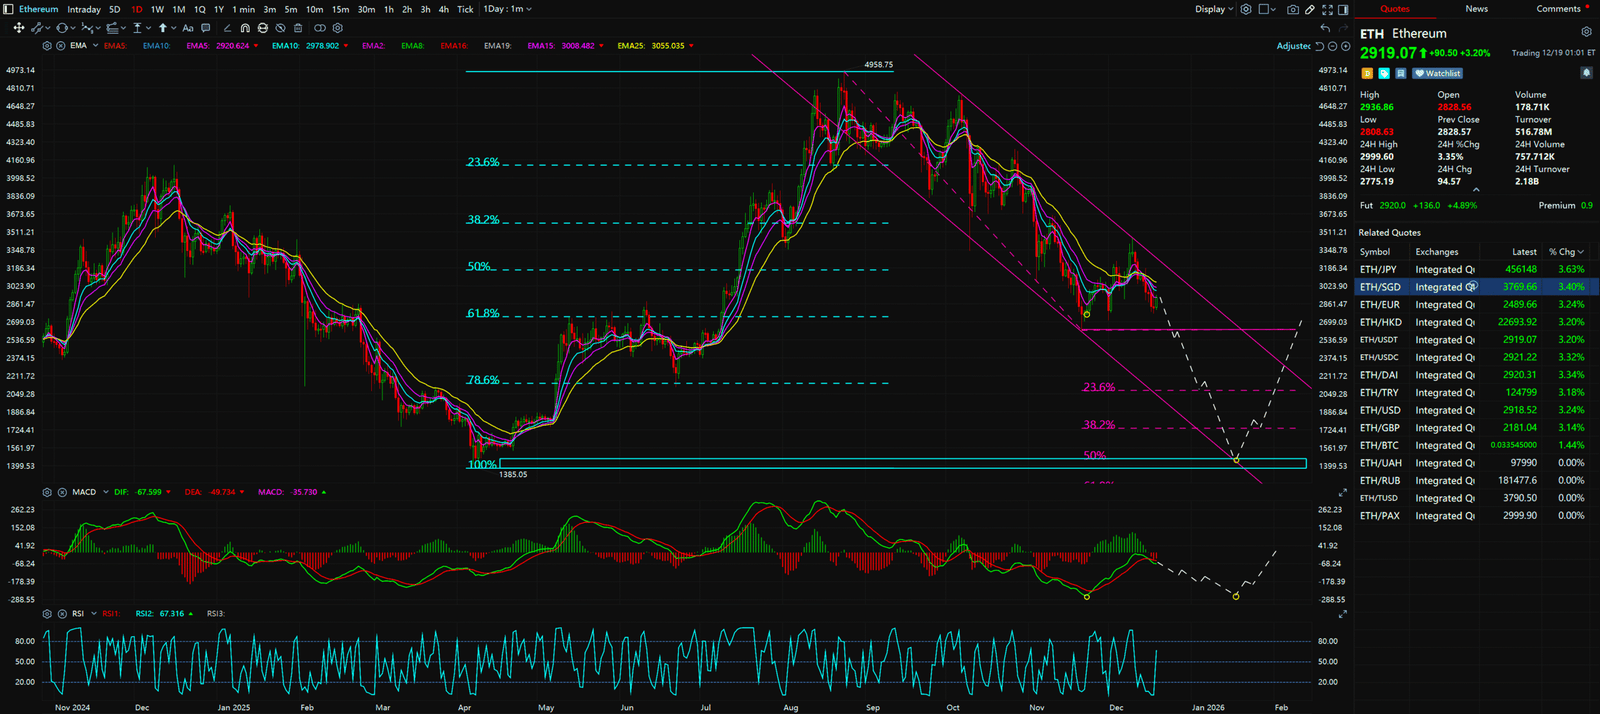
【The Daily Chart – Where is the Divergence?】
On the Daily Chart, ETH is trapped in a “Descending Channel.” We are currently hitting the upper resistance rail. Buying here is statistically suicide.
Moreover, the MACD (12,26,9) is screaming danger. True bottoms are almost always preceded by “Bullish Divergence” (price makes a lower low, momentum makes a higher low). Is there divergence now? No. The momentum is still bearish. This rally is hollow. It is a trap designed to suck in the last few bulls before the final flush.
Synthesis & Unique Insight: Why is $1462.65 Worth Gold?
【The Ex-Banker’s Survival Guide】
I share this to give you the “Institutional Edge.” The mantra of the smart money is: “Better to buy high and right, than low and wrong.”
Here is your battle plan:
- The Sniper (Aggressive):
- Wait. Do not touch the buy button until $1,462.65. This is the institutional accumulation zone. If it doesn’t hit, you keep your cash. Cash is a position.
- The Follower (Conservative):
- Confirm. Only buy if ETH breaks and holds above $2,770.72 as support. You pay a premium for confirmation, but you avoid the crash.
- The Stop Loss (The Eject Button):
- $1,368.56. If this breaks, the model is invalidated, and the market is in freefall. Get out.


Key Takeaways
Summary / Key Levels Tactical Manual
- ⛔ Stop Loss: USD 1368.56
- This is the last line of defense. If it breaks, the trend has completely reversed, and you must exit unconditionally to survive.
- 🎯 Tentative Entry Point: USD 1462.65
- Action Guide: This is the “Golden Point” for counter-trend trading. When price touches here, AND the MACD indicator shows “Bullish Divergence” (price makes a new low but momentum bars shorten), aggressive traders can deploy 30%-50% of capital. This is called “Dancing with the Whales.”
- 🛡️ Safest Entry Point: USD 2770.72
- Action Guide: This is for conservative traders. Only when the price reclaims $2770.72 does it mean bulls have regained control. You miss the bottom profit, but your win rate increases drastically.
Our goal is not to provide a crystal ball, but to offer a clear, logical, and actionable framework by simplifying professional analysis.
Unlocking Technical Analysis: Power Moves with Diagrams !
Weekly Timeframe for ETH (Ethereum)
Daily Timeframe for ETH (Ethereum)
For continuous, real-time analysis of these developing market structures, visit www.chart-blitz.com.
Fundamental news tells you what happened. Technical analysis predicts what will happen. To master the professional framework that separates market signal from noise, explore our exclusive models at www.chart-blitz.com.
Sources:
【Disclaimer】 The content herein is for educational purposes and reflects the author’s personal opinion only; it is not investment advice. All financial investments, including cryptocurrencies, carry significant risk, and you could lose your entire capital. To support this site, this article may contain affiliate links. While we strive for accuracy, we cannot guarantee all information is complete or error-free. Please conduct your own research and be fully responsible for your own investment decisions.