The speculator’s chief enemies are always boring from within. It is inseparable from human nature to hope and to fear
William Delbert Gann – 1949
Are you watching the market dip, thinking “I should have sold at the top”? Or are your friends buzzing about “buying the dip,” but when you look at the charts, it’s all just a confusing mess? You watched ETH rally from $1,385 while others made a fortune, leaving you with a major case of FOMO. Well, your second chance might be here. Ethereum has pulled back from its highs, and while beginners fear a bear market, experts see the price landing on a critical “life line.” This time, let’s forget the jargon. You only need one number to see the full picture.
Analysis Benchmark Statement:
- All technical analysis below is based on a price snapshot locked on October 17, 2025, 14:05 (UTC+8): ETH = $3,915.00 USD.
- This price snapshot provides a stable reference point. All support, resistance, and projected paths are relative to this benchmark. The market is volatile; please treat this report as an “analytical map,” not a real-time price feed.
The Catalysts & Fundamental View (The Background Noise): Over the past 24 hours, market sentiment has been tense. News headlines are dominated by ETH breaking below the $4,000 psychological level, fueling fears of a further downturn. However, the interesting part is that amidst the bearish sentiment, “smart money” like Tom Lee’s BitMine made headlines for purchasing over $400M worth of ETH. This counter-cyclical move by institutions tells us the story is far more complex than the headlines suggest. This news is the “background noise” we must be aware of, but not what we base our decisions on.
The Predictive Lens: A Multi-Timeframe Technical Deep Dive (The Core: One Life Line)
We’ve simplified your expert analysis into a concept anyone can grasp: The “Ethereum Uptrend Freeway.”
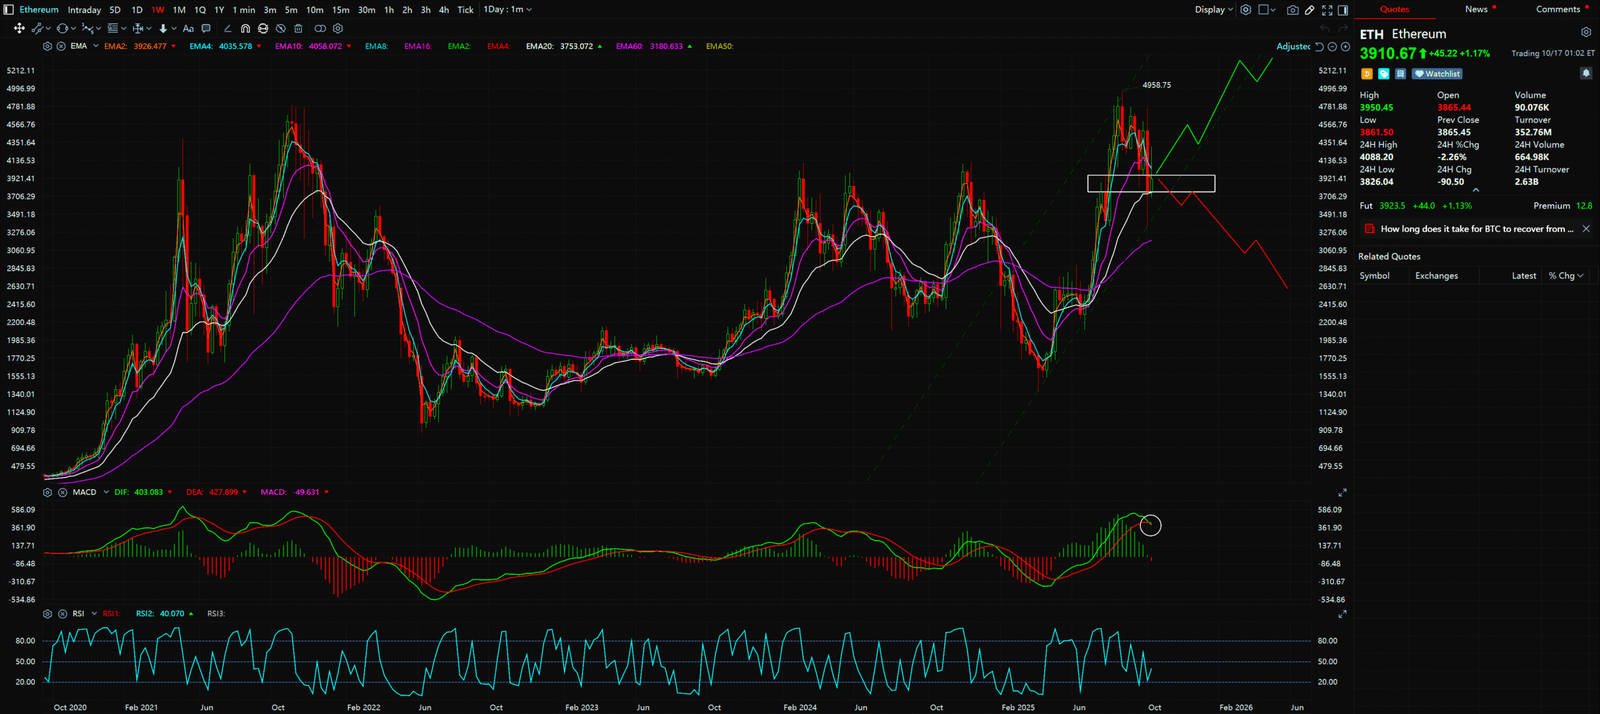
- The Big Picture (Weekly Chart): From the user-provided weekly chart, we can clearly see that since late 2023, ETH has been traveling in a steady, upward-sloping “freeway,” known as an ascending parallel channel. This freeway has two clear lanes:
- The Upper Lane (Resistance): Around $4,958 USD. Notice how every time the price hits this ceiling, it tends to pull back for a breather.
- The Lower Lane (The Life Line): Around $3,341 USD. This is the guardrail of the entire uptrend. When the price falls to this level, it finds powerful support. It’s the make-or-break point for the trend.
- The Current Situation: The price has just fallen from the top lane and is heading directly for this “life line” at $3,341 USD. Therefore, this is the only number you need to focus on right now.
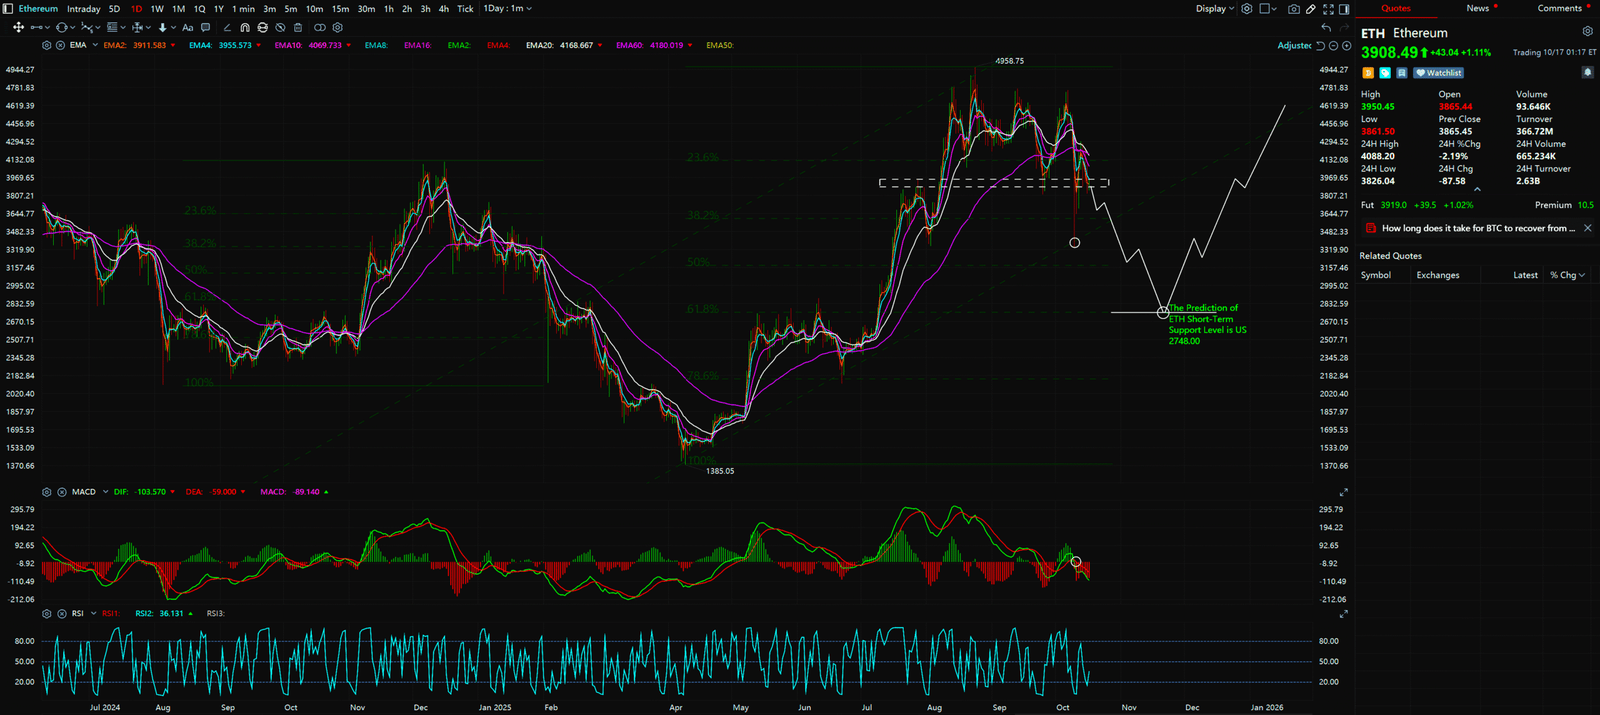
- The Advanced View (Daily Chart): The MACD indicator of daily chart shows weak short-term momentum, creating a “divergence”—the long-term trend is up, but the short-term trend is down. This explains why ETH is pulling back; it’s “refueling” for a healthier long-term journey.
Synthesized Analysis & Unique Insight (Two Scenarios):
Combining all this information, we arrive at a very simple playbook:
- Scenario 1 (Bullish ✅): The Price Holds the $3,341 Life Line If the price successfully “bounces” off the $3,341 guardrail and heads back up, it’s an incredibly positive sign that the uptrend remains intact. For those who missed the $1,385 opportunity, this could be a key “boarding zone” to watch closely.
- Scenario 2 (Bearish ❌): The Price Breaks the $3,341 Life Line If the price crashes decisively through the $3,341 guardrail, it’s a major warning sign. This signals that the uptrend in place since last year may be broken, and the market could enter a deeper correction. In this case, the next potential support levels are around $3,164 or $2,740. Caution would be the best strategy.


Key Takeaways
Summary / Key Price Levels: Forget the complex indicators for now. As a newcomer, all you need to do is watch $3,341 USD as your “line in the sand.” It’s your simplest guide to whether ETH is in danger or presents an opportunity.
- Core Support / Life Line: $3,341 USD
- Primary Resistance: $4,958 USD
- Secondary Support (If Broken): $3,164 USD, $2,740 USD
For continuous, real-time analysis of these developing market structures, visit www.chart-blitz.com.
Fundamental news tells you what happened. Technical analysis predicts what will happen. To master the professional framework that separates market signal from noise, explore our exclusive models at www.chart-blitz.com.
Sources:
- https://finance.yahoo.com/news/crypto-markets-today-bearish-october-162807140.html
- https://insidebitcoins.com/news/ethereum-price-plunges-2-as-tom-lees-bitmine-buys-the-dip-with-417m-eth-purchase
- https://cointelegraph.com/news/ether-confirms-bearish-signal-last-time-60-percent-eth-price-drop
Unlocking Technical Analysis: Power Moves with Diagrams !
Monthly Timeframe for Ethereum (ETH)
Daily Timeframe for Ethereum (ETH)